
Volatility Crush Rally Potential Builds as Dispersion and Correlations Shift

Strange day. For some reason, I lost track of the market during the afternoon because I had a few other projects to attend to.
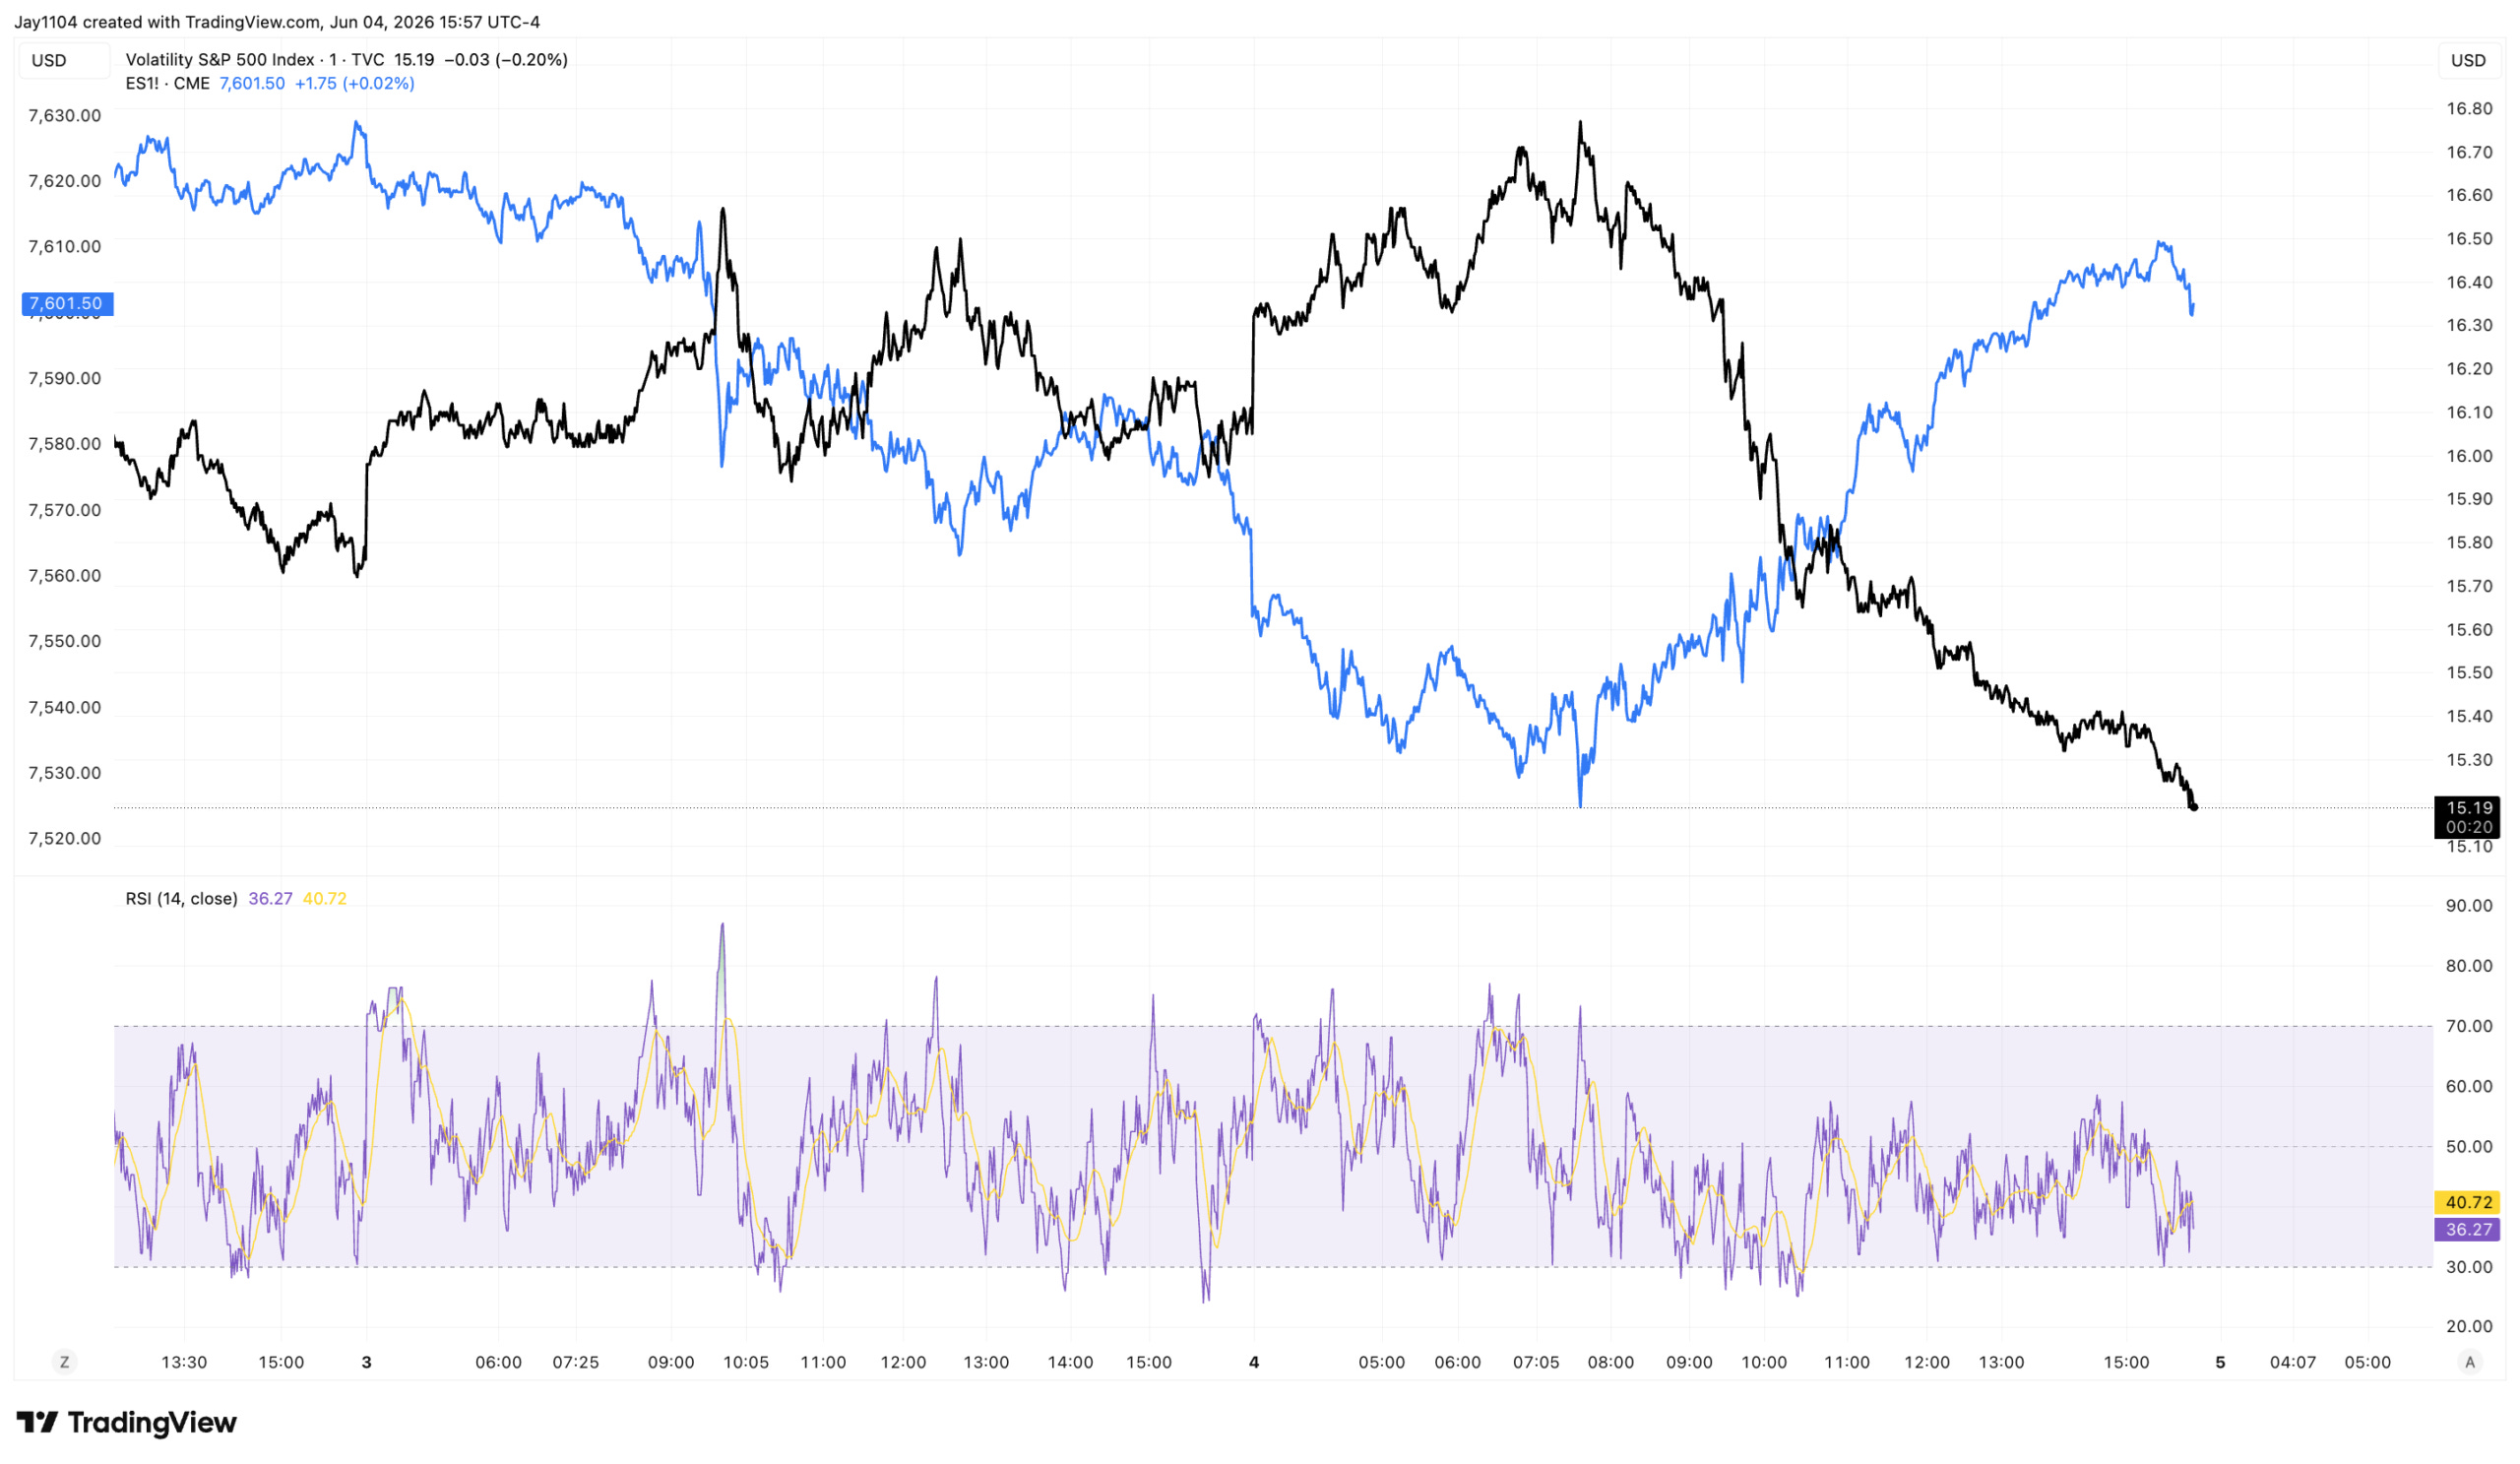
The market clearly is not concerned one bit about tomorrow’s May jobs report, with the VIX1D finishing lower and below 11. At that level, there should be the potential for a volatility crush rally, unless futures decline dramatically overnight.
, with RSI at 79.74 indicating overbought conditions")
The VIX was also crushed on the day, falling below 16. If volatility is going to decline throughout the session, then you would typically expect stocks to move higher, as volatility is crushed.
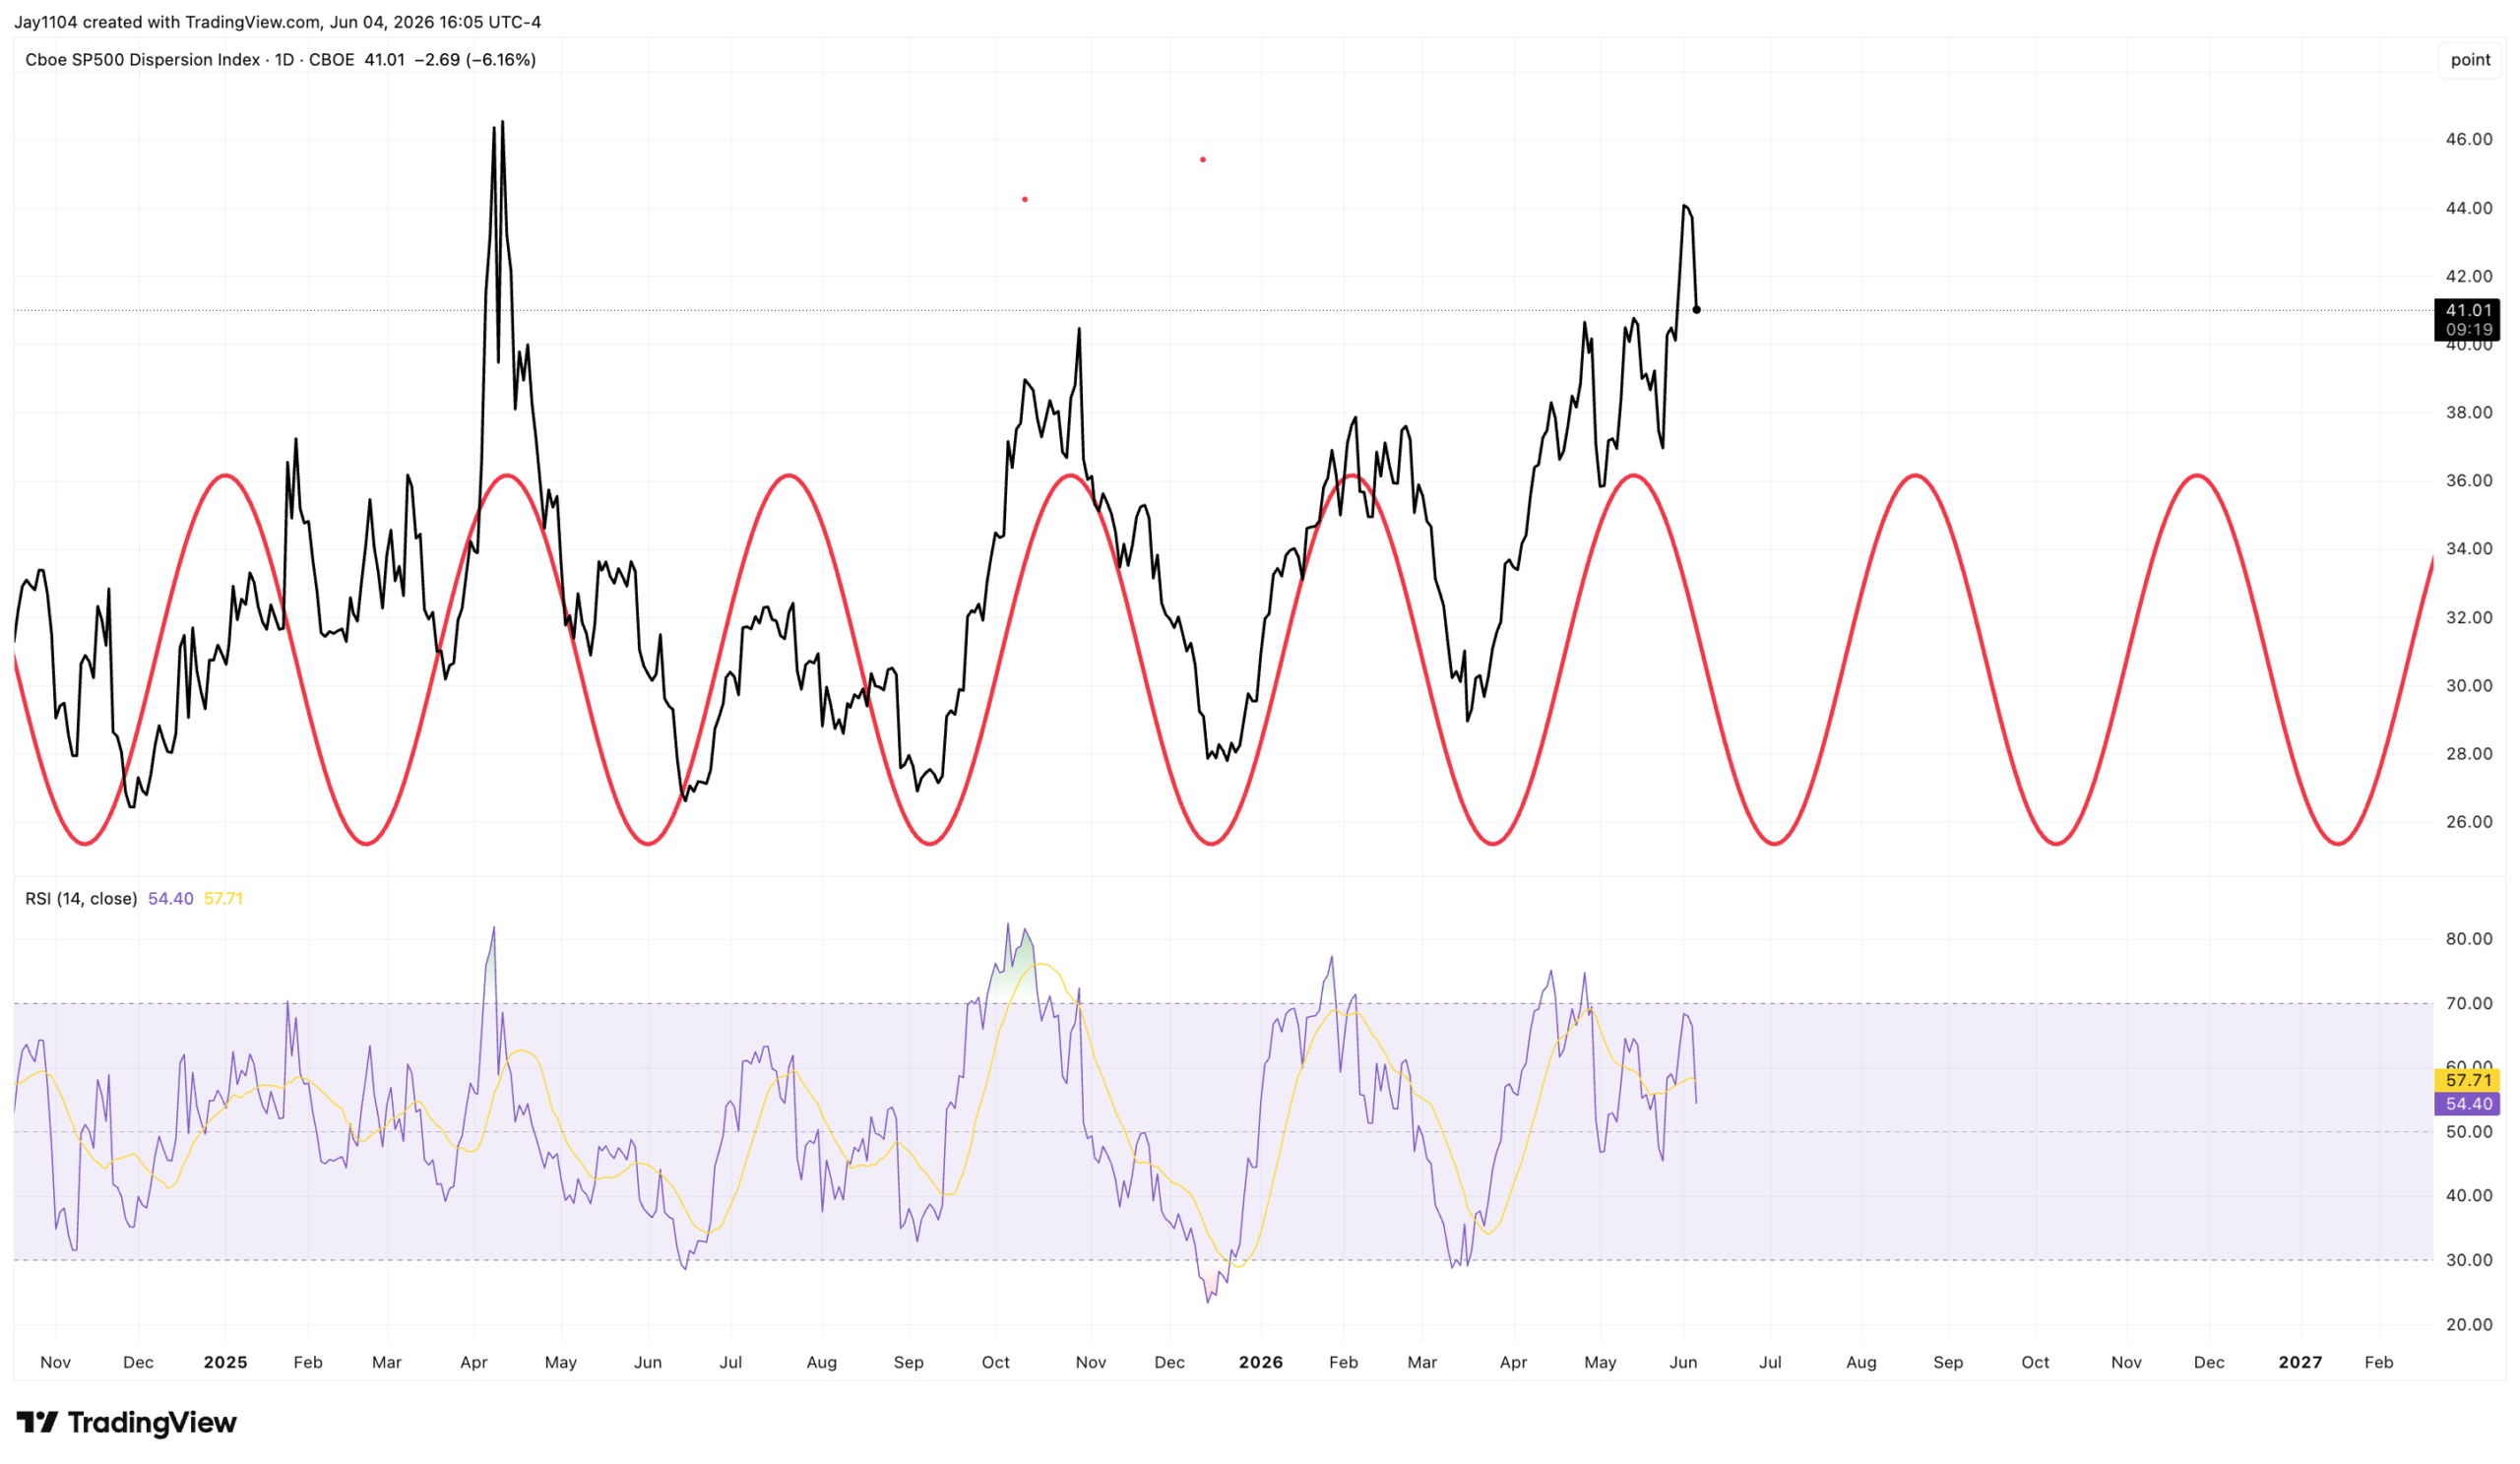
Dispersion fell sharply today as single-stock volatility was crushed, with Broadcom’s implied volatility declining considerably following its earnings report.

The Dispersion Index has been due for a peak, and perhaps now that Broadcom earnings are out of the way, that can finally happen. Unfortunately, we will not know until it does. Broadcom carries a weighting nearly as large as Amazon’s and larger than Meta’s in the S&P 500, so it is entirely possible that one reason dispersion has continued to work is because of Broadcom. However, I have no proof of that; it is just a theory.
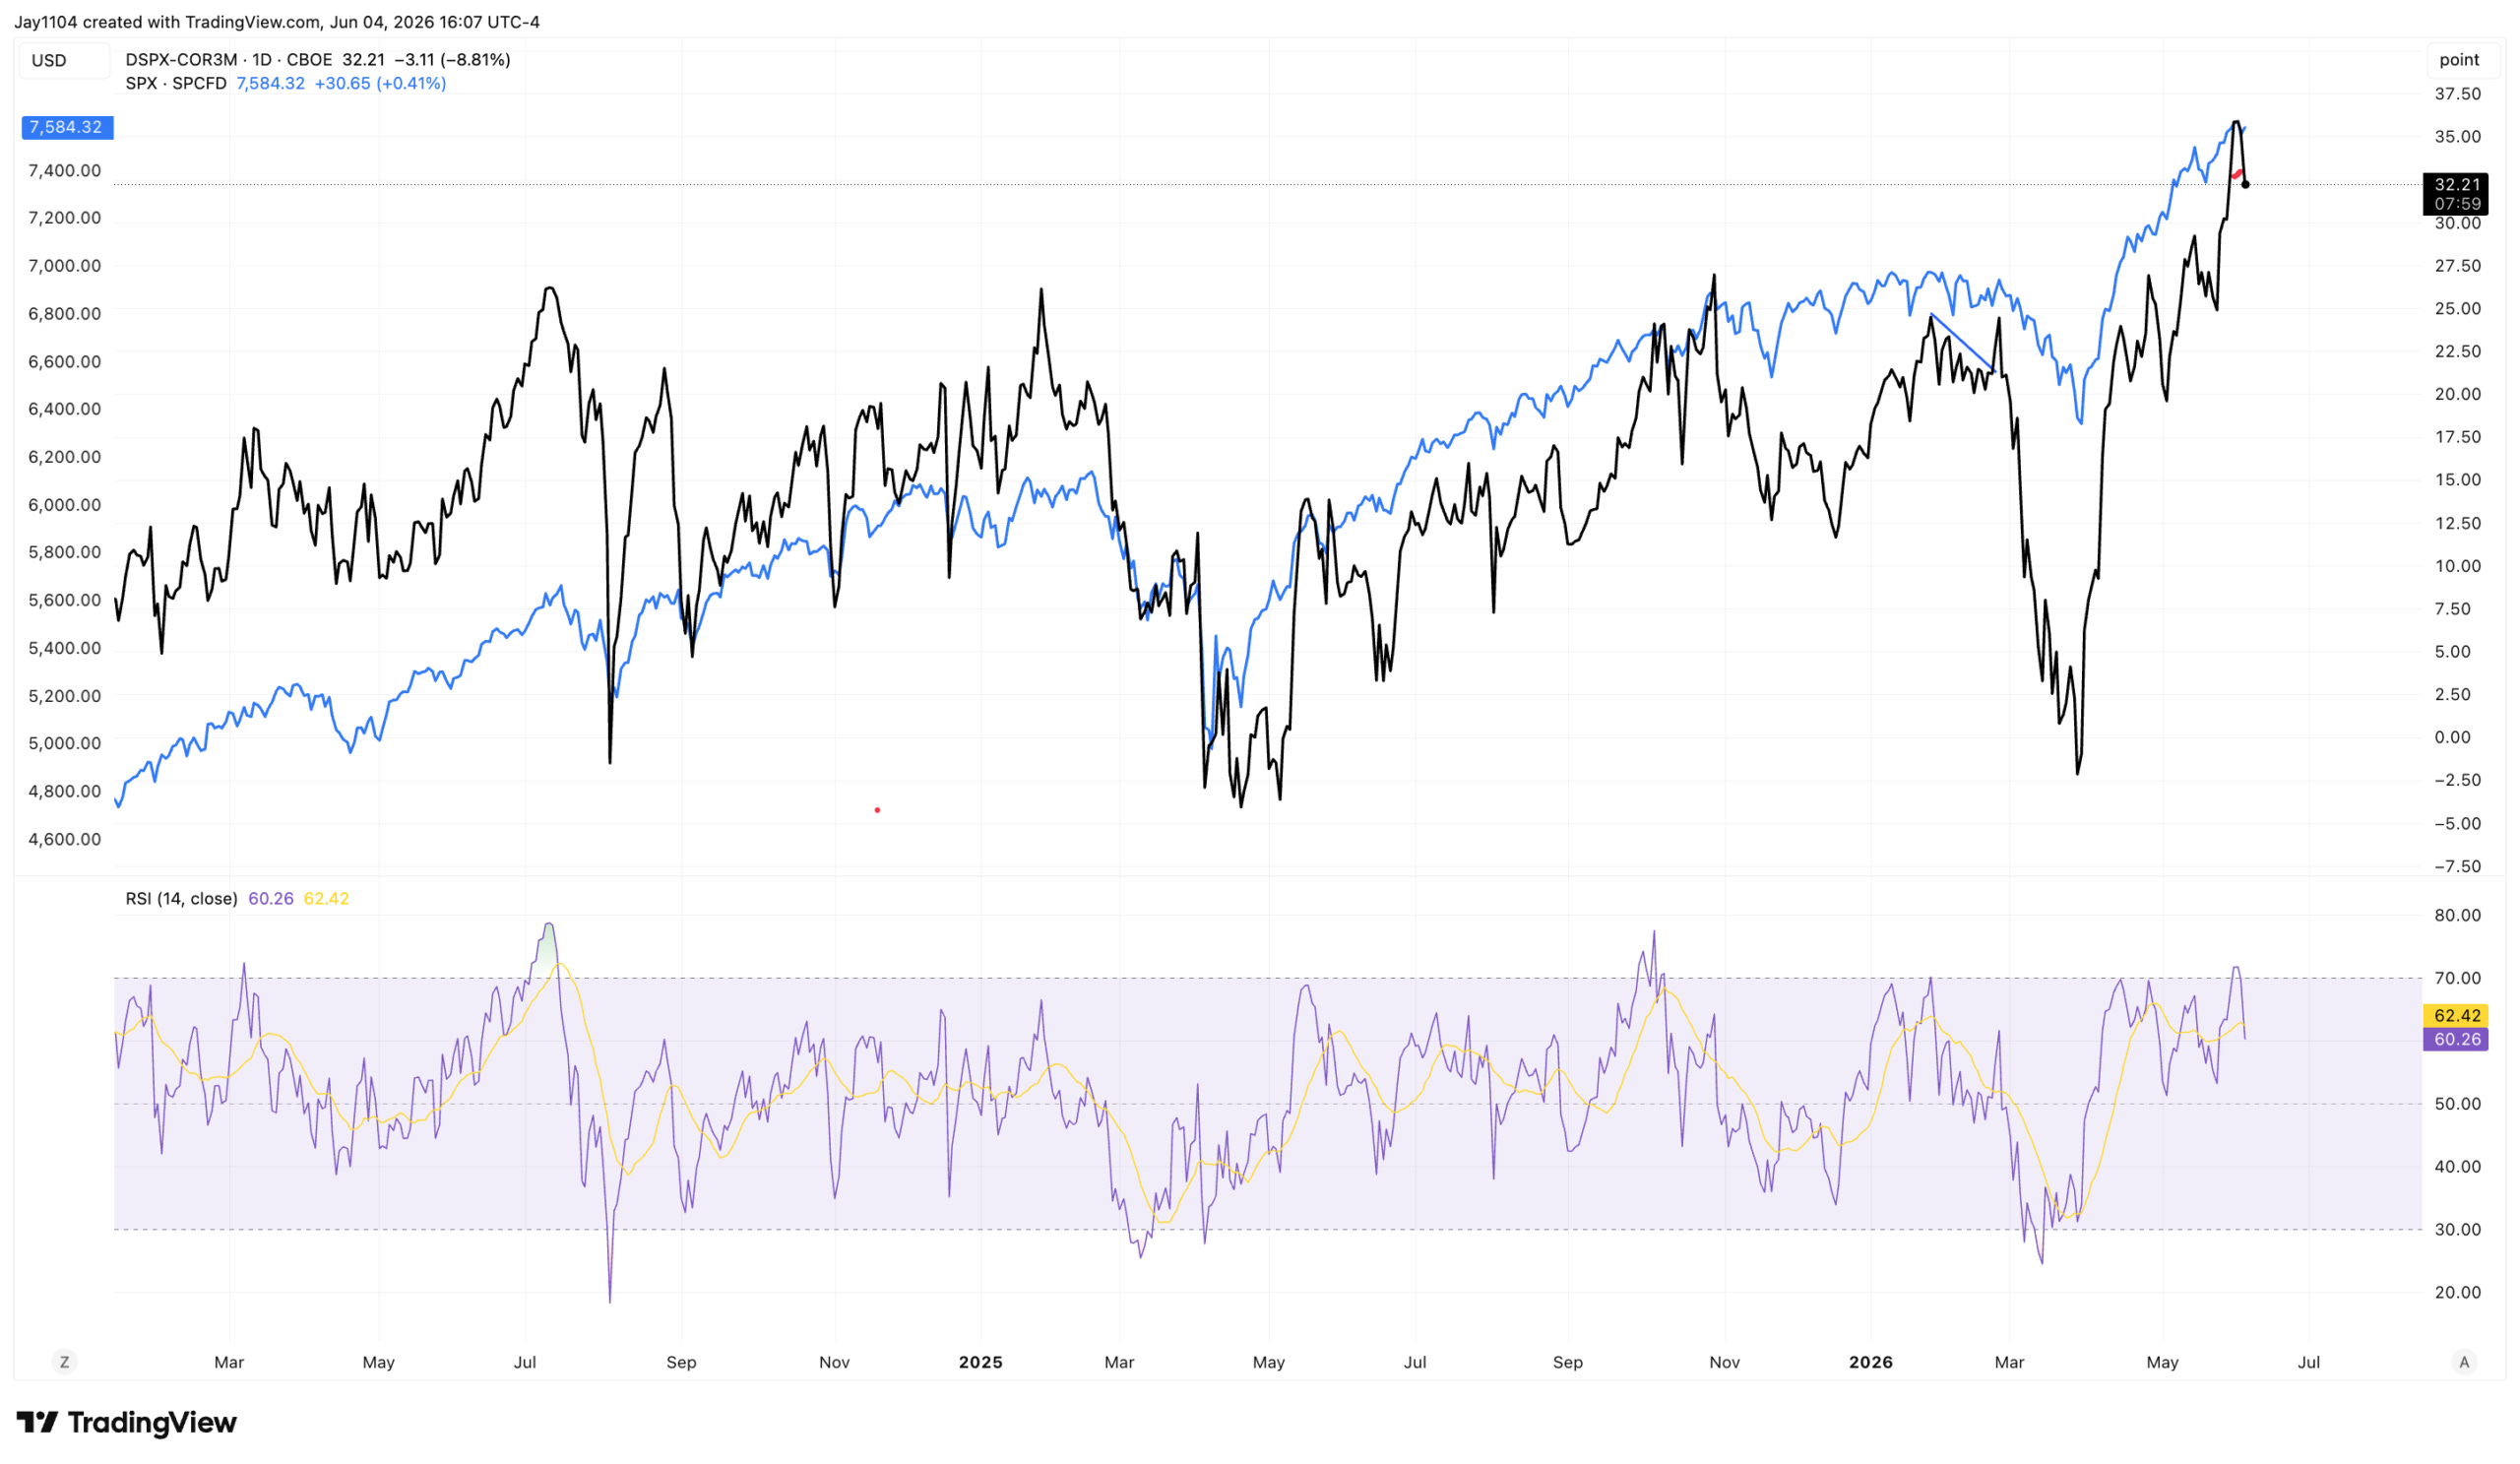
Three-month implied correlations rose today, narrowing the spread with dispersion. Historically, when this spread begins to turn, the S&P 500 tends to follow, and that relationship tends to work in both directions.
Oil’s 3% decline also helped reduce equity volatility. I am not entirely sure why oil was down so sharply today, but at this point, the news flow changes so rapidly that I have largely stopped trying to keep up with every headline.
The inverse head-and-shoulders pattern that appeared to be forming yesterday is now at risk of breaking down. For now, as long as oil remains above $90.50, I think the pattern can still work. However, if support breaks, the pattern is likely invalid, and my interpretation is wrong.

That’s all for today
Mike
Glossary by ChatGPT
Broadcom — A major semiconductor and infrastructure software company with significant weighting in broad equity indexes.
Dispersion — The degree to which individual stock returns or volatility differ from the overall market.
Dispersion Index — A measure that tracks the relative performance and volatility differences among individual stocks within an index.
Implied Correlation — The market-implied estimate of how closely stocks within an index are expected to move together.
Implied Volatility — The market’s forecast of future price fluctuations derived from options prices.
Inverse Head-and-Shoulders Pattern — A technical analysis formation often interpreted as a potential bullish trend-reversal signal.
S&P 500 — A capitalization-weighted index of 500 leading U.S. publicly traded companies.
VIX — The CBOE Volatility Index, commonly used as a measure of expected 30-day stock market volatility.
VIX1D — A volatility index measuring the market’s expectation of S&P 500 volatility over the next trading day.
Volatility Crush — A rapid decline in implied volatility, often occurring after a significant event or uncertainty is resolved.
Disclosure
This report contains independent commentary to be used for informational and educational purposes only. Michael Kramer is a member and investment adviser representative with Mott Capital Management. Mr. Kramer is not affiliated with this company and does not serve on the board of any related company that issued this stock. All opinions and analyses presented by Michael Kramer in this analysis or market report are solely Michael Kramer’s views. Readers should not treat any opinion, viewpoint, or prediction expressed by Michael Kramer as a specific solicitation or recommendation to buy or sell a particular security or follow a particular strategy. Michael Kramer’s analyses are based upon information and independent research that he considers reliable, but neither Michael Kramer nor Mott Capital Management guarantees its completeness or accuracy, and it should not be relied upon as such. Michael Kramer is not under any obligation to update or correct any information presented in his analyses. Mr. Kramer’s statements, guidance, and opinions are subject to change without notice. Past performance is not indicative of future results. Neither Michael Kramer nor Mott Capital Management guarantees any specific outcome or profit. You should be aware of the real risk of loss in following any strategy or investment commentary presented in this analysis. Strategies or investments discussed may fluctuate in price or value. Investments or strategies mentioned in this analysis may not be suitable for you. This material does not consider your particular investment objectives, financial situation, or needs and is not intended as a recommendation appropriate for you. You must make an independent decision regarding investments or strategies in this analysis. Upon request, the advisor will provide a list of all recommendations made during the past twelve months. Before acting on information in this analysis, you should consider whether it is suitable for your circumstances and strongly consider seeking advice from your own financial or investment adviser to determine the suitability of any investment.