
VIXEQ-VIX Spread Signals a Critical Week for Markets

Please remember to subscribe to my Substack to receive this free daily commentary—which I work very hard to produce—directly in your inbox.
This week’s economic data probably takes on added importance given the recent surge in interest rates. The ISM Manufacturing report is due on Monday, followed by JOLTS on Tuesday, ADP employment and the ISM Services report on Wednesday, productivity and unit labor costs on Thursday, and, of course, the jobs report on Friday.
As if that weren’t enough, the Quarterly Refunding Announcement also comes on Monday. It will tell us about the government’s borrowing needs for the rest of the year and, perhaps more importantly, the composition of how it plans to finance them. Given the surge in long-end rates, it seems unlikely to me that the Treasury will suddenly shift from heavy bill issuance to greater coupon issuance. I would expect bill issuance to remain the primary source of funding.
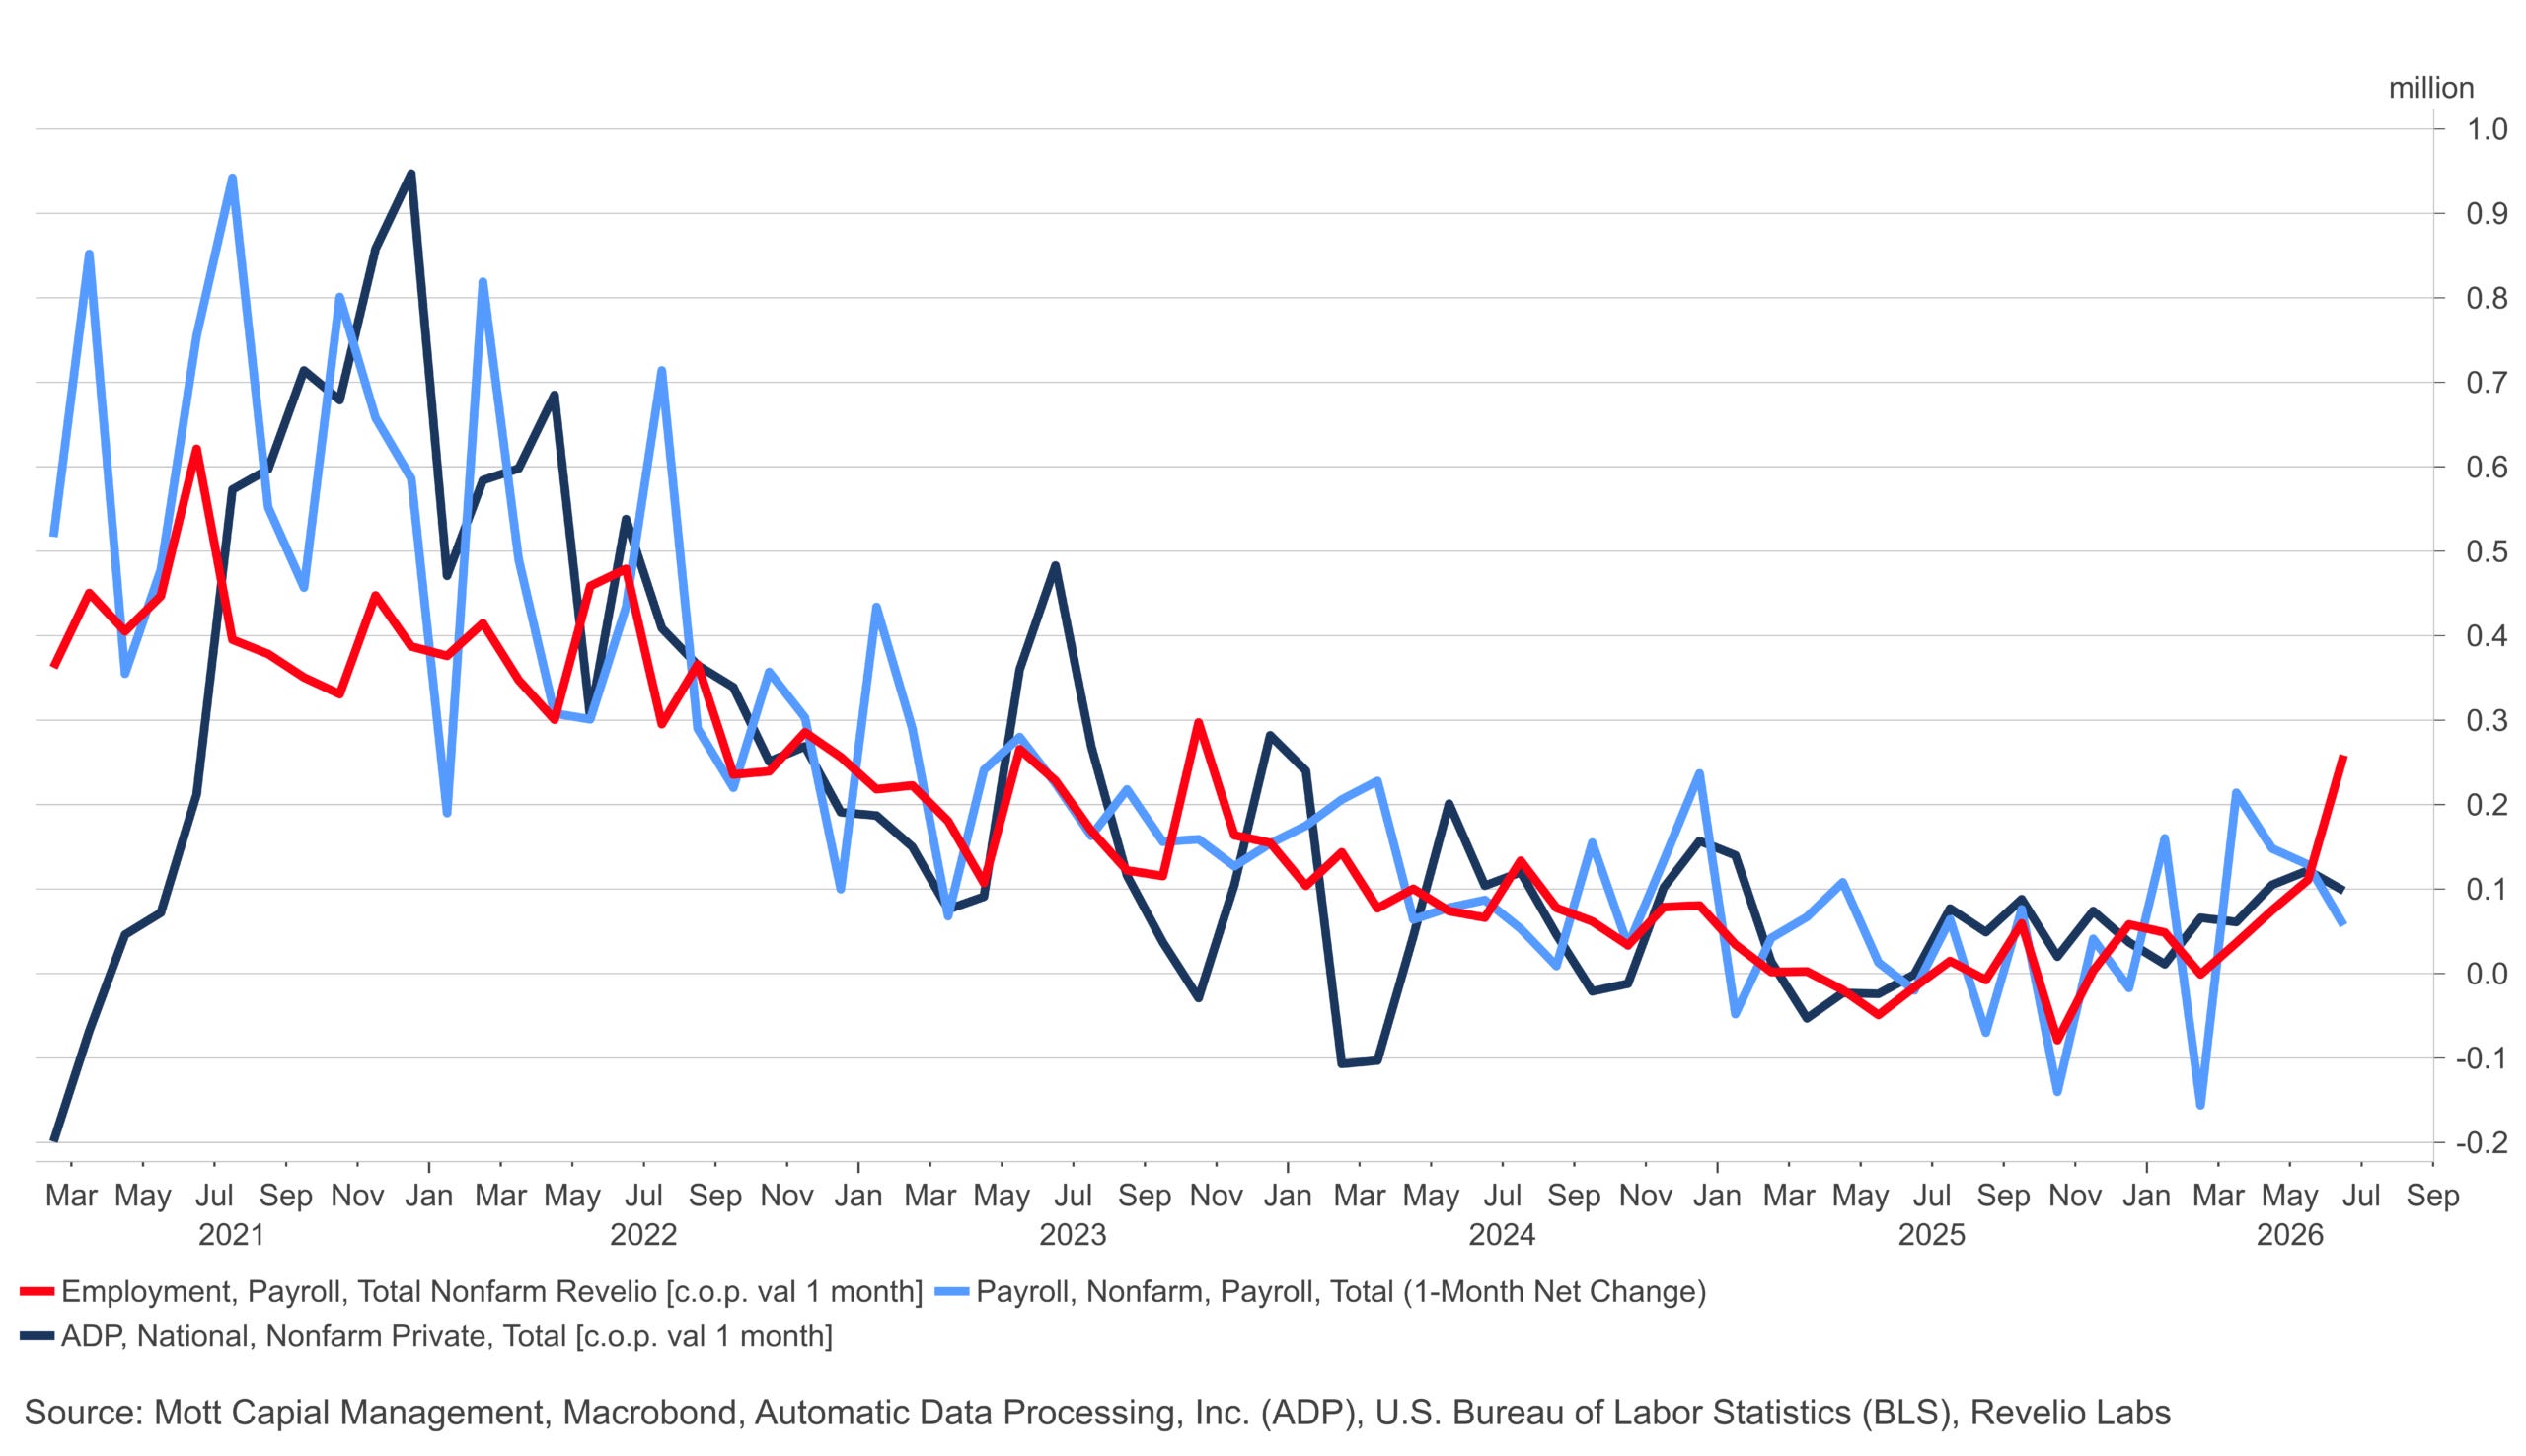
The jobs report is expected to show that 83,000 jobs were created in July, up from 57,000 in June. One thing worth pointing out is that the Revelio Labs job data is released the day before. That data has shown a solid improvement in U.S. hiring trends over the past couple of months and appears to lead both the BLS and ADP data by a few months. So it’s worth keeping an eye on that release on Thursday.
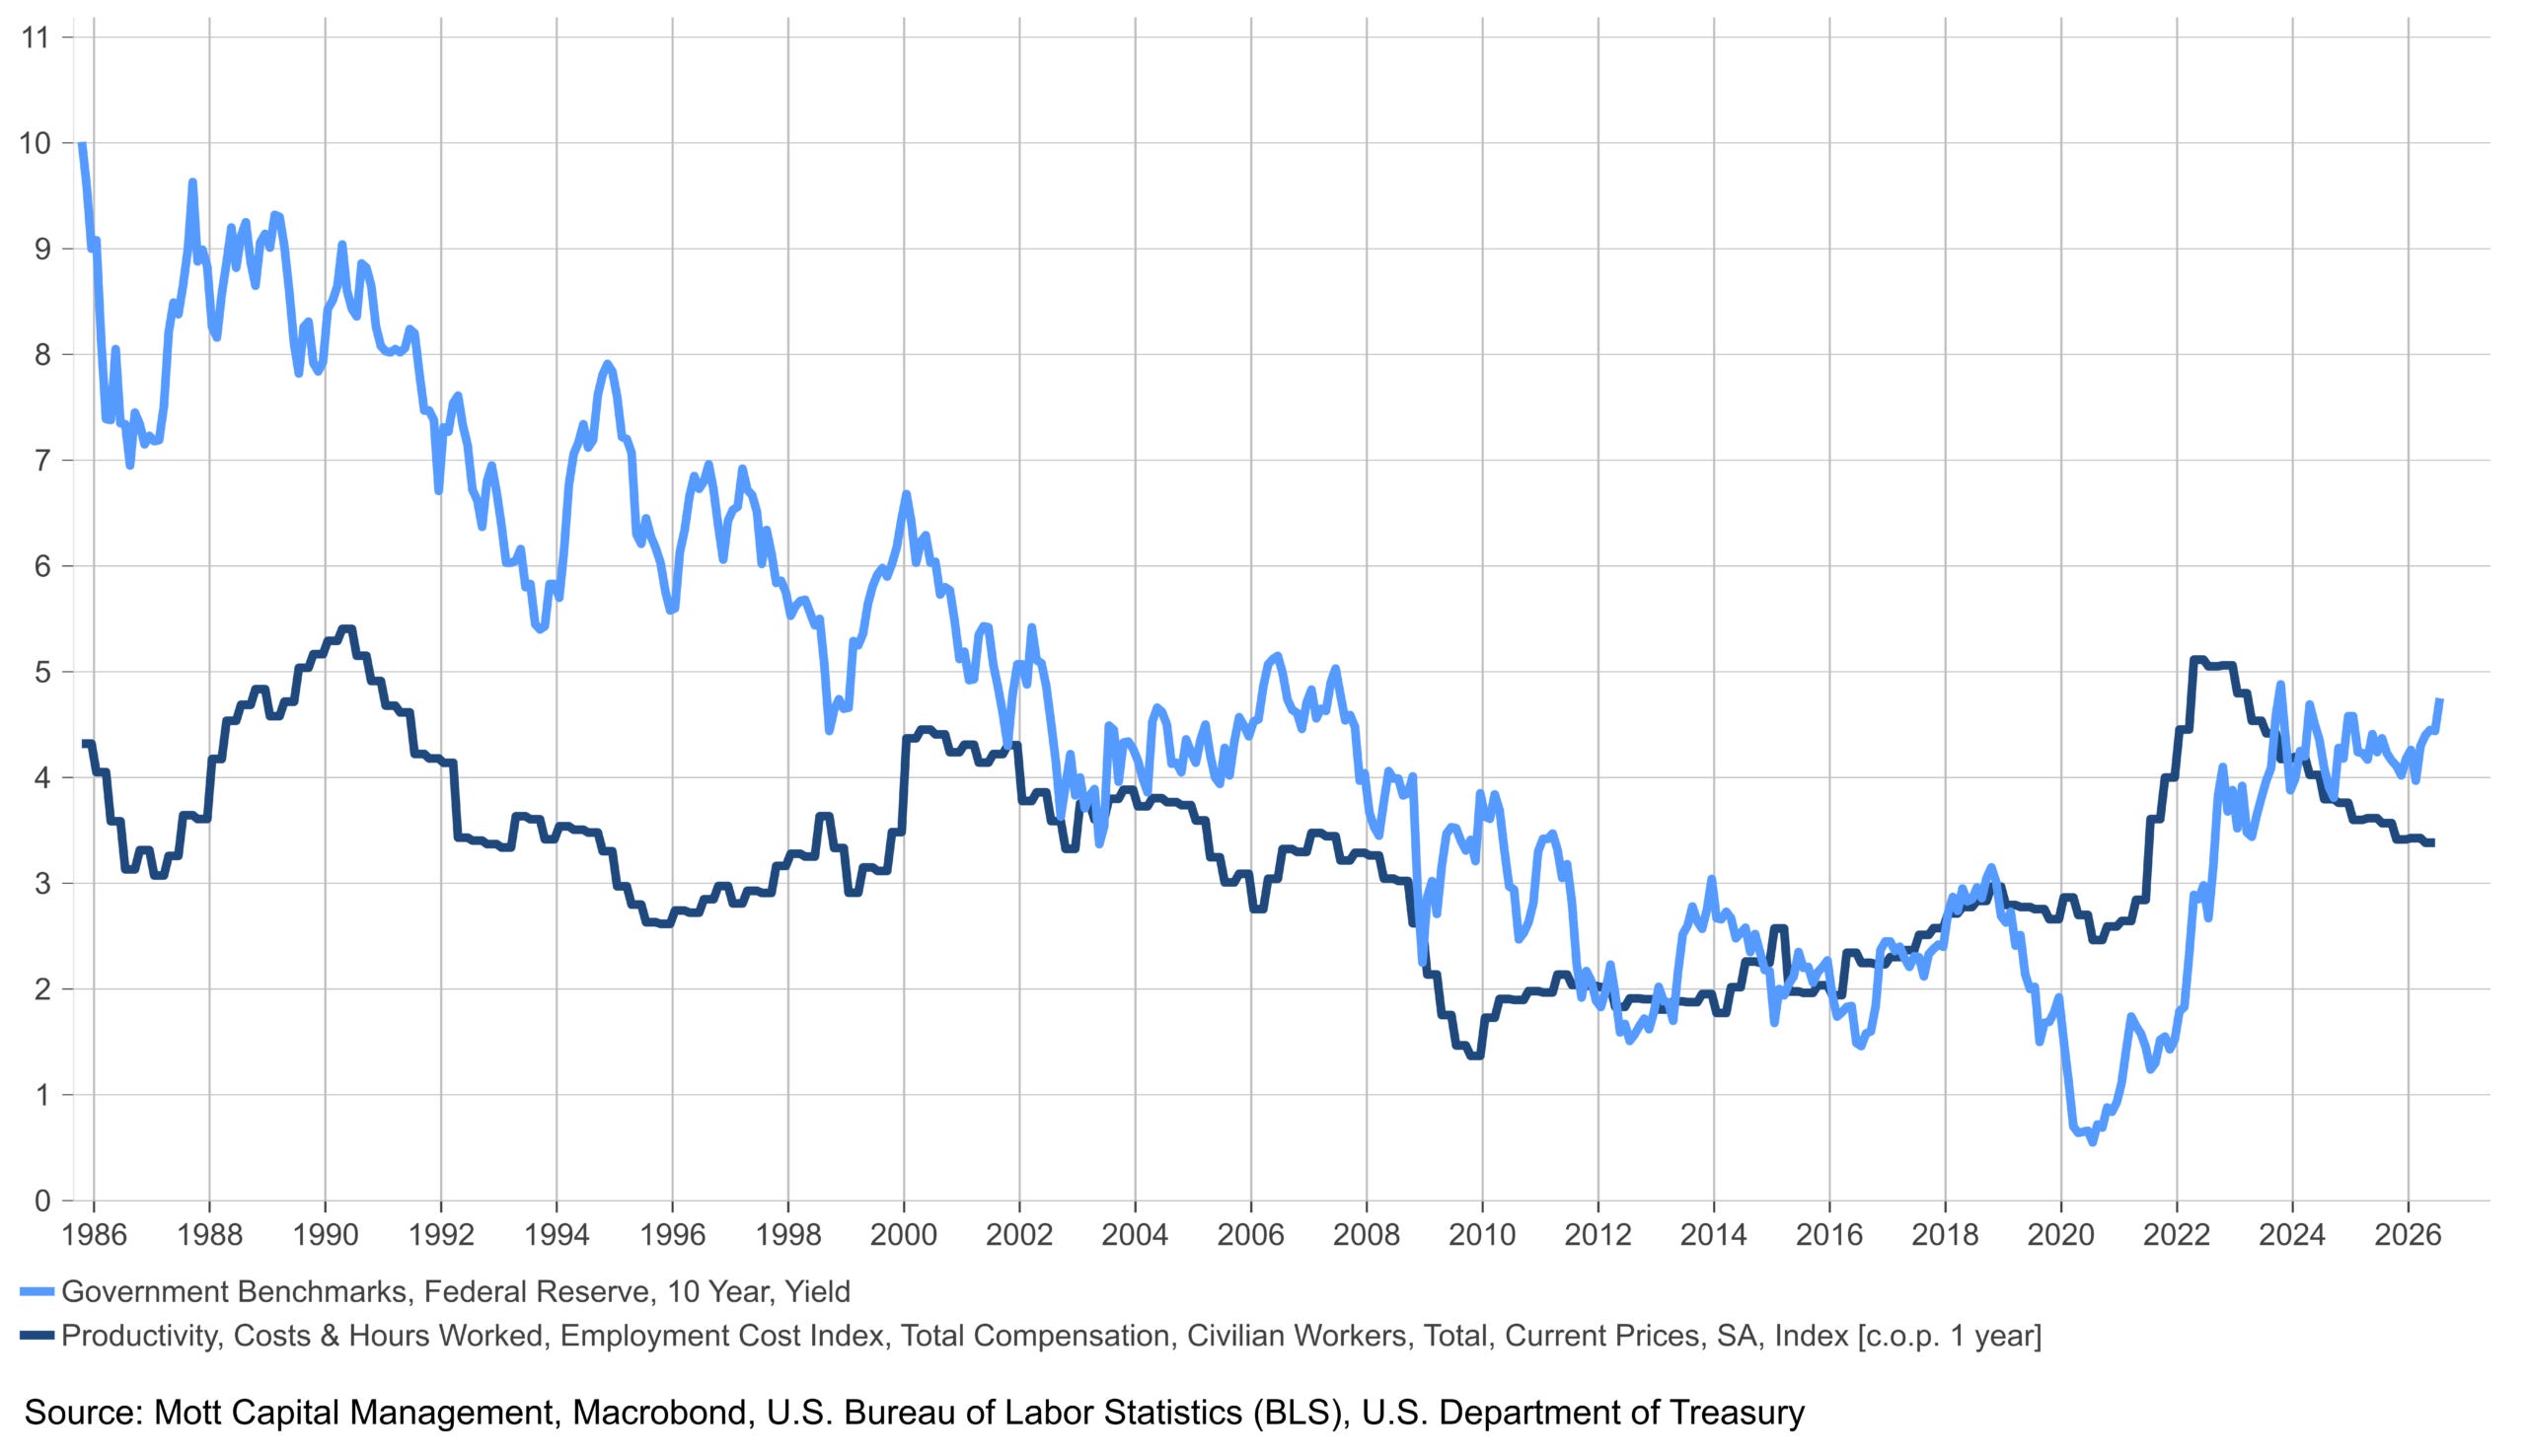
The Employment Cost Index rose more than expected for the second quarter when it was reported on Friday, increasing 0.9% versus expectations of 0.8%. Historically, there has been a relationship between the Employment Cost Index and the 10-year Treasury yield, so it may have partially contributed to the move higher in rates on Friday.
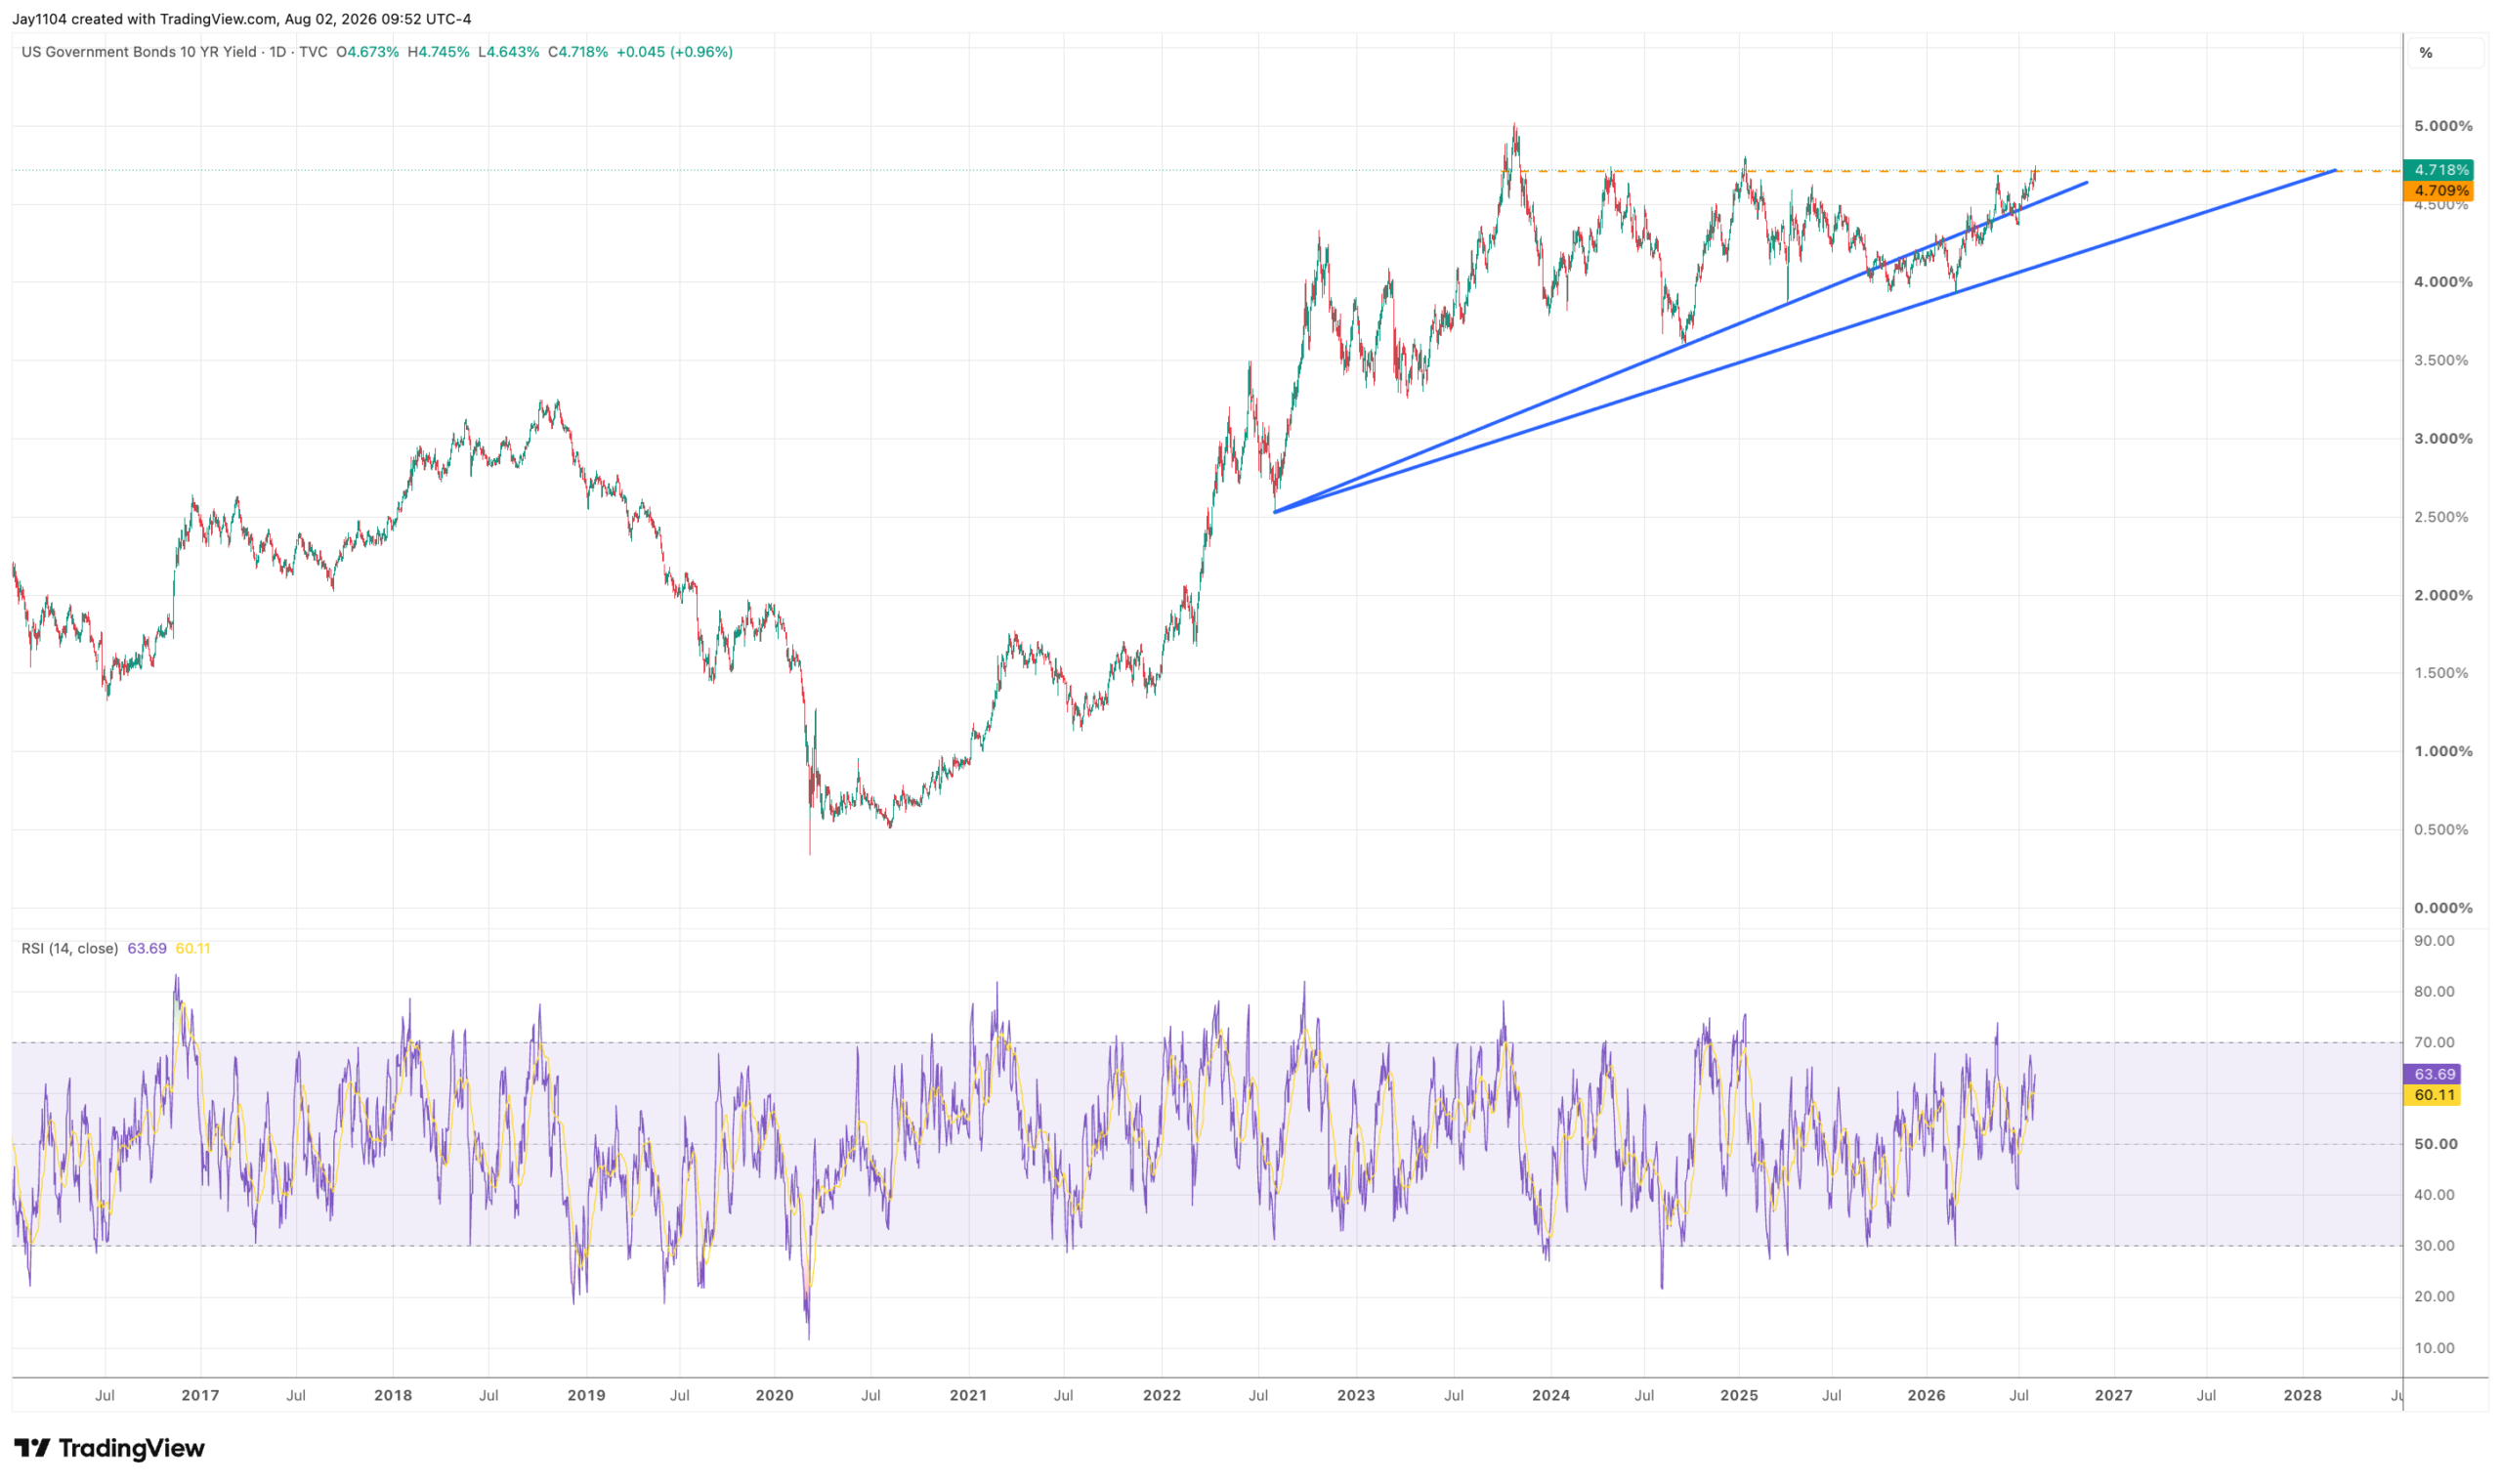
The 10-year Treasury yield finds itself at a very important inflection point as it pushes up against resistance in the 4.7% to 4.8% range. A break above that area would open the door to the October 2023 high near 5%. In that sense, this is shaping up to be a critical week for bonds and interest rates.
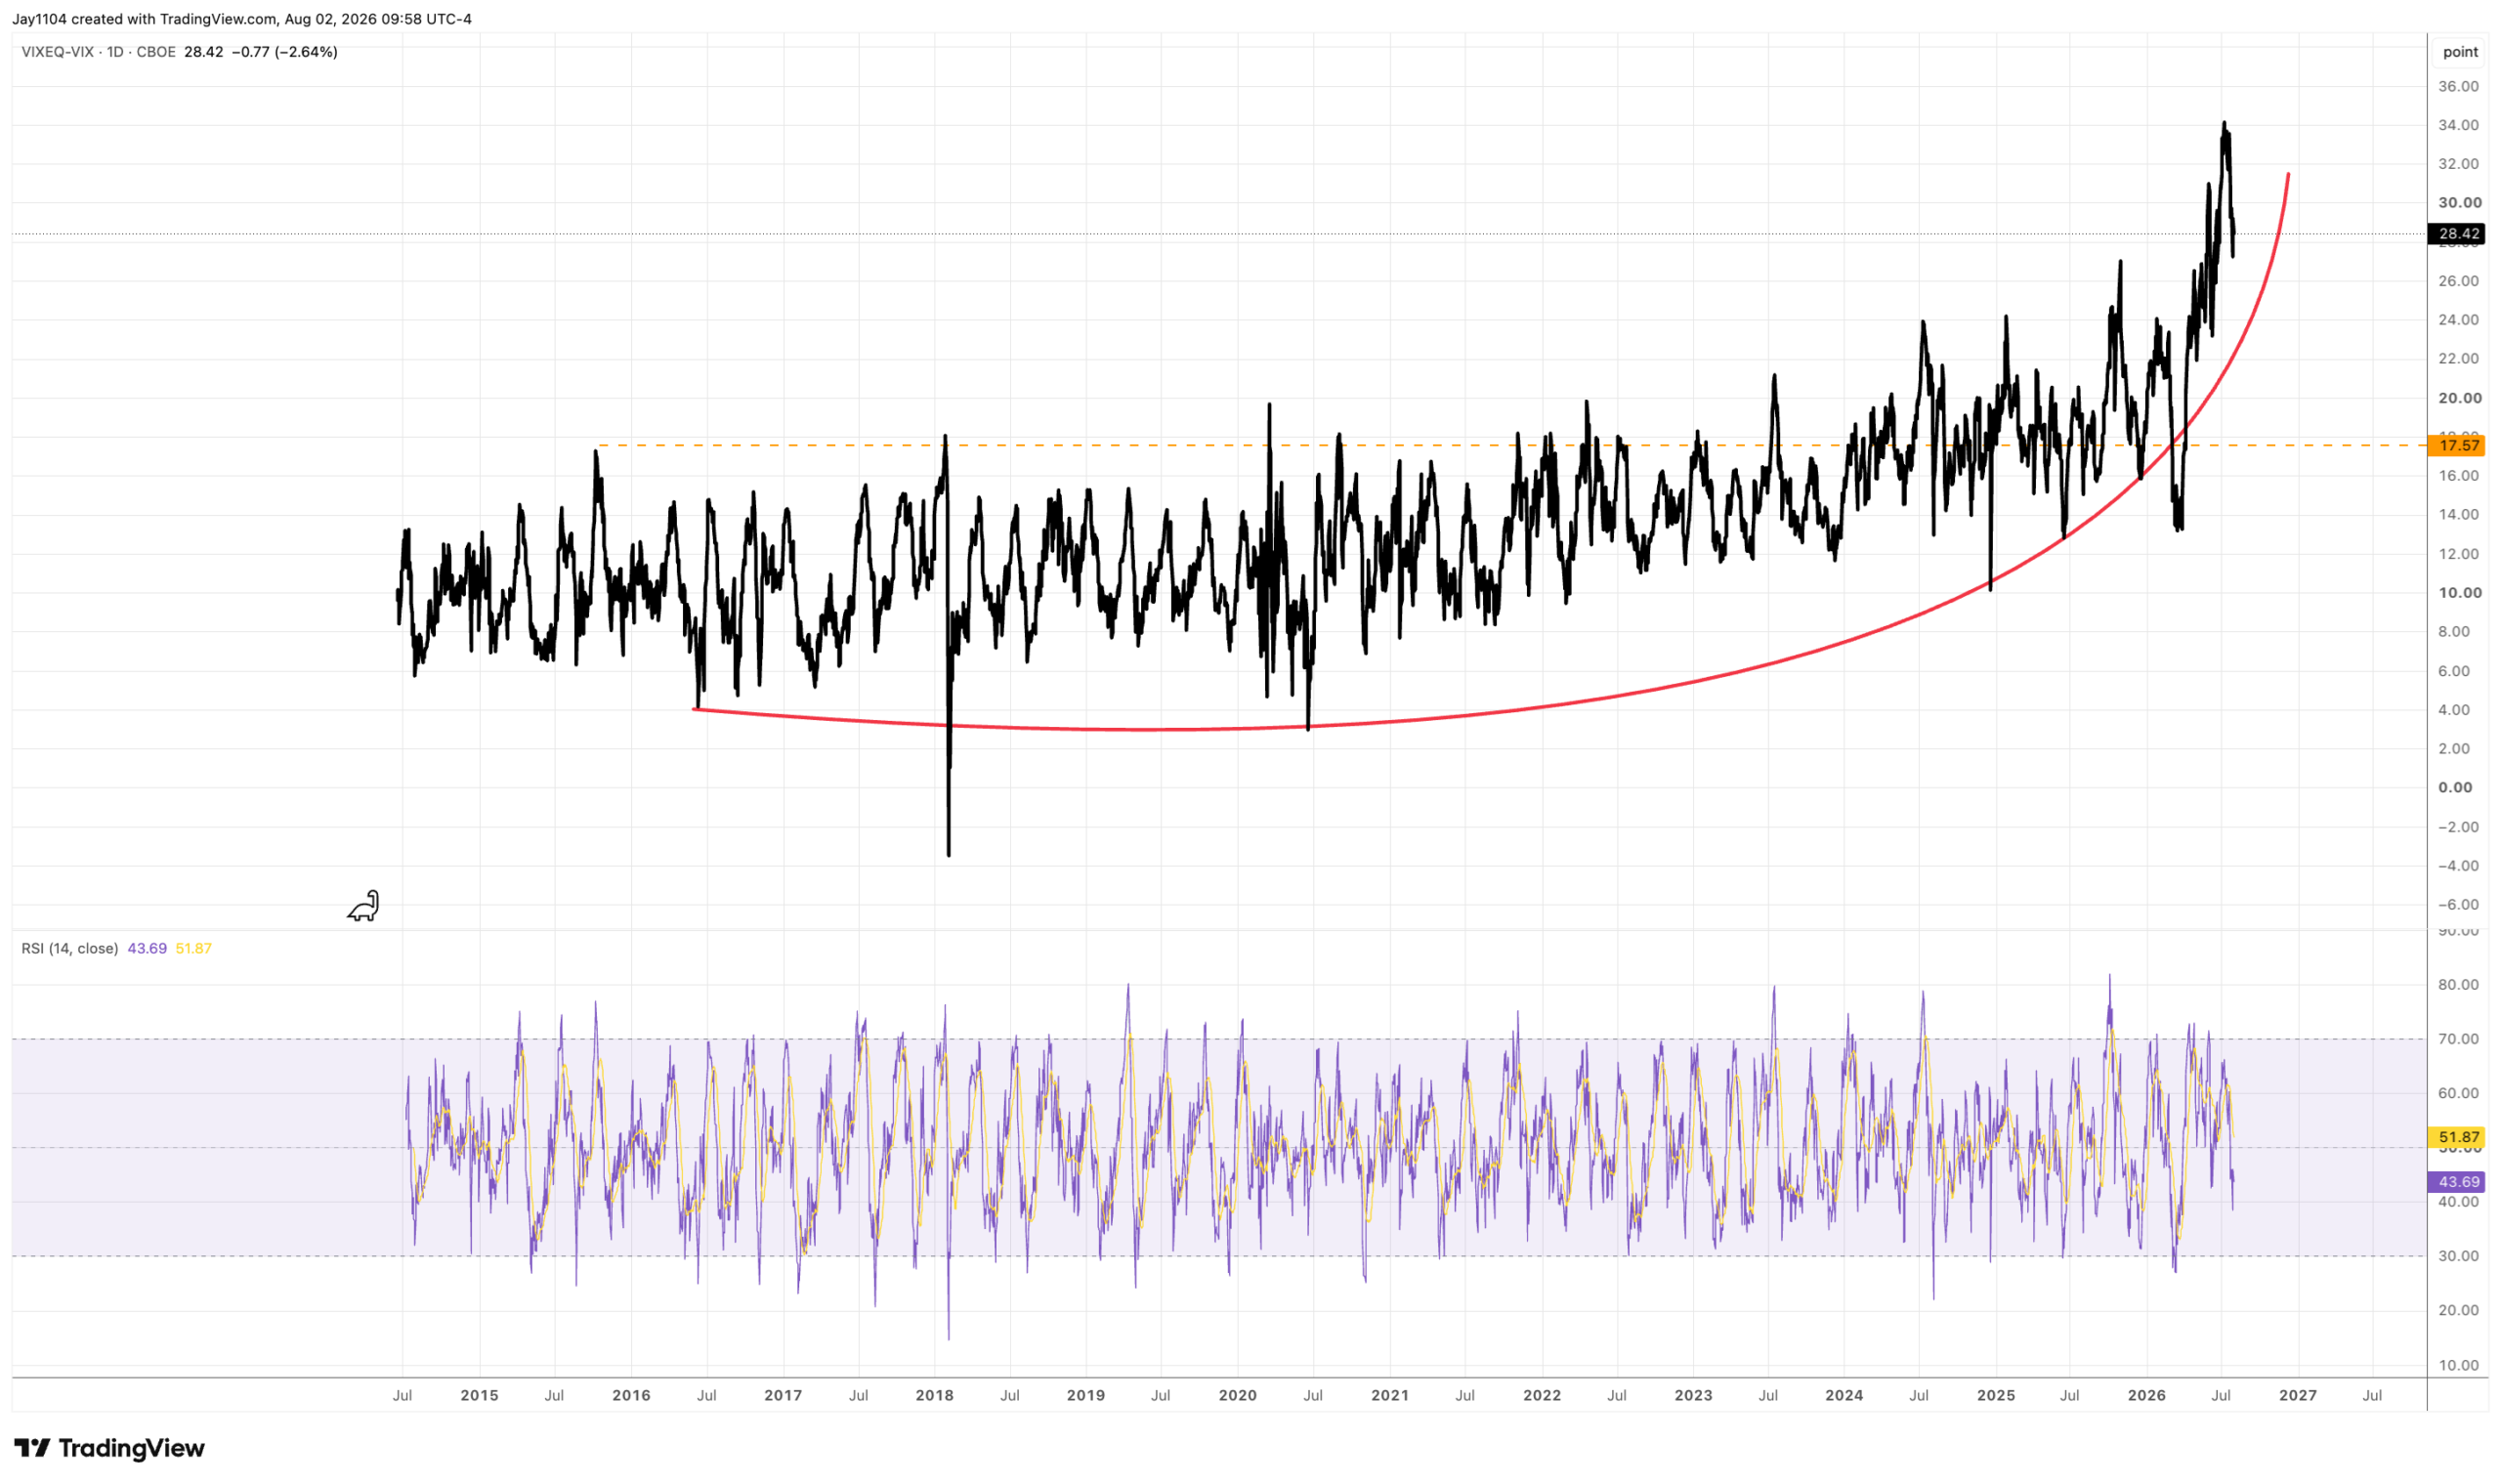
Single-stock volatility fell sharply this week and should continue to decline as earnings season progresses. Implied volatility typically rises ahead of earnings reports and falls afterward, and that should lead to a further decline in the VIXEQ.
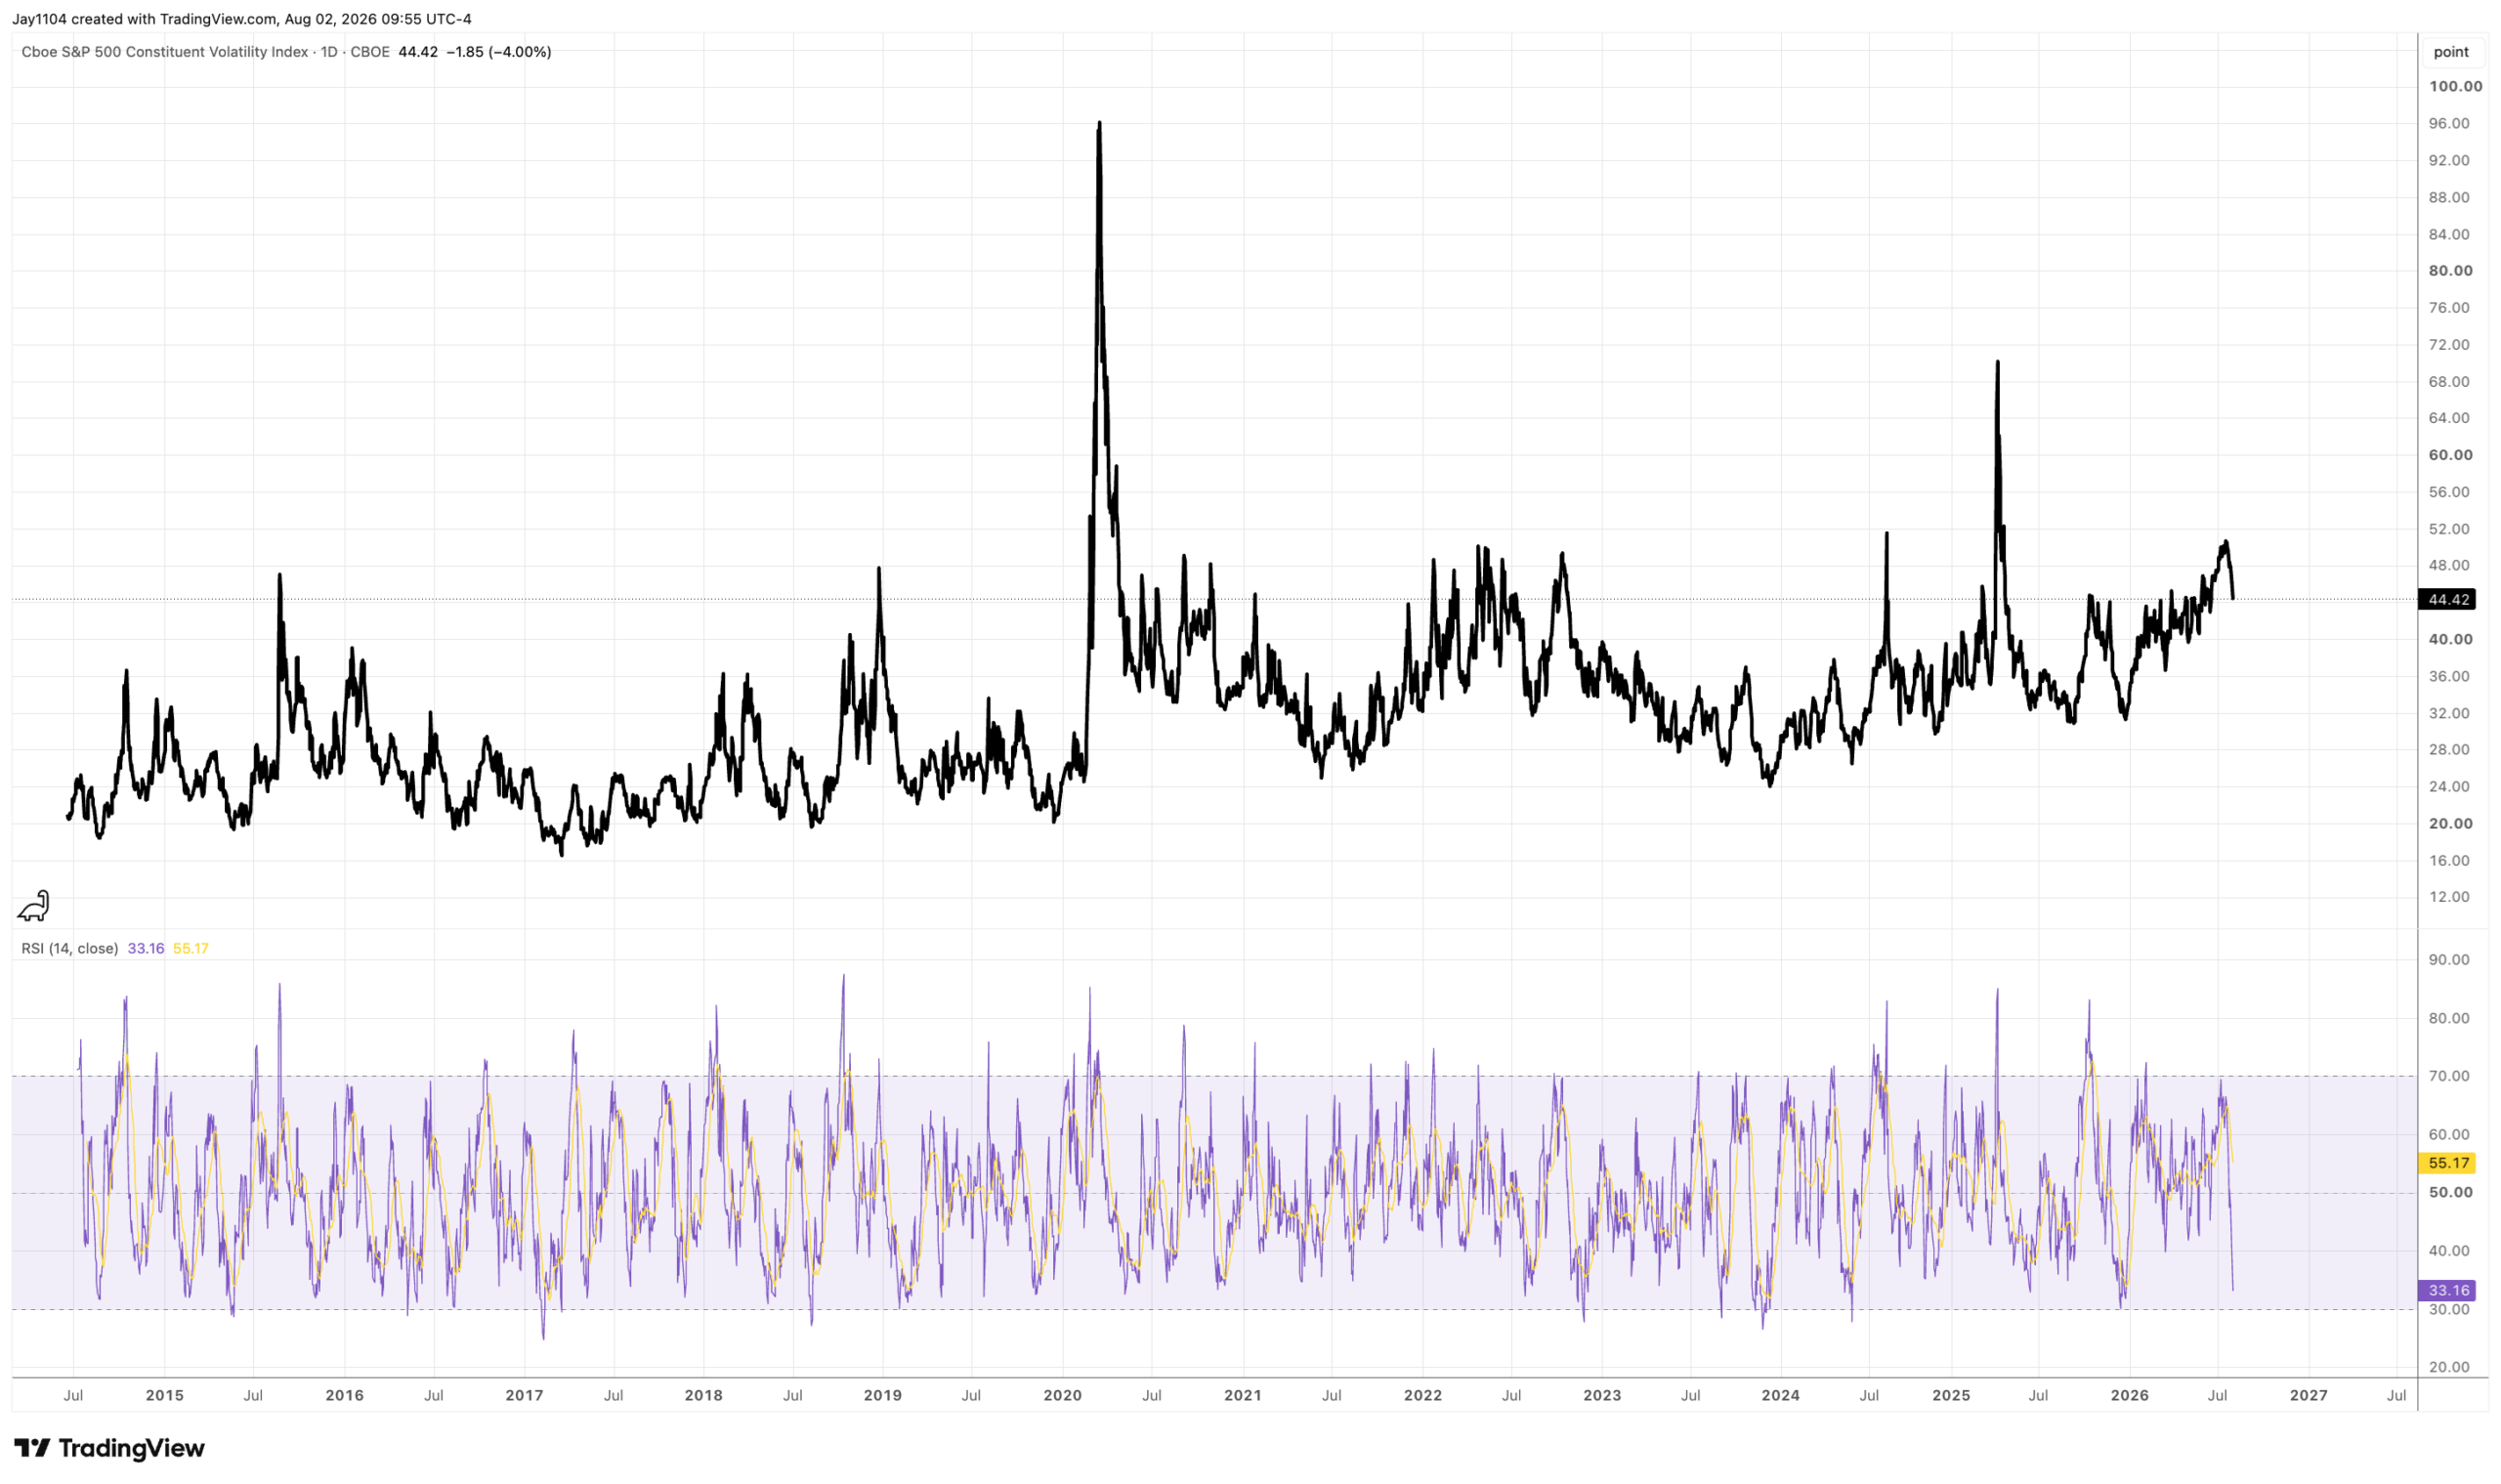
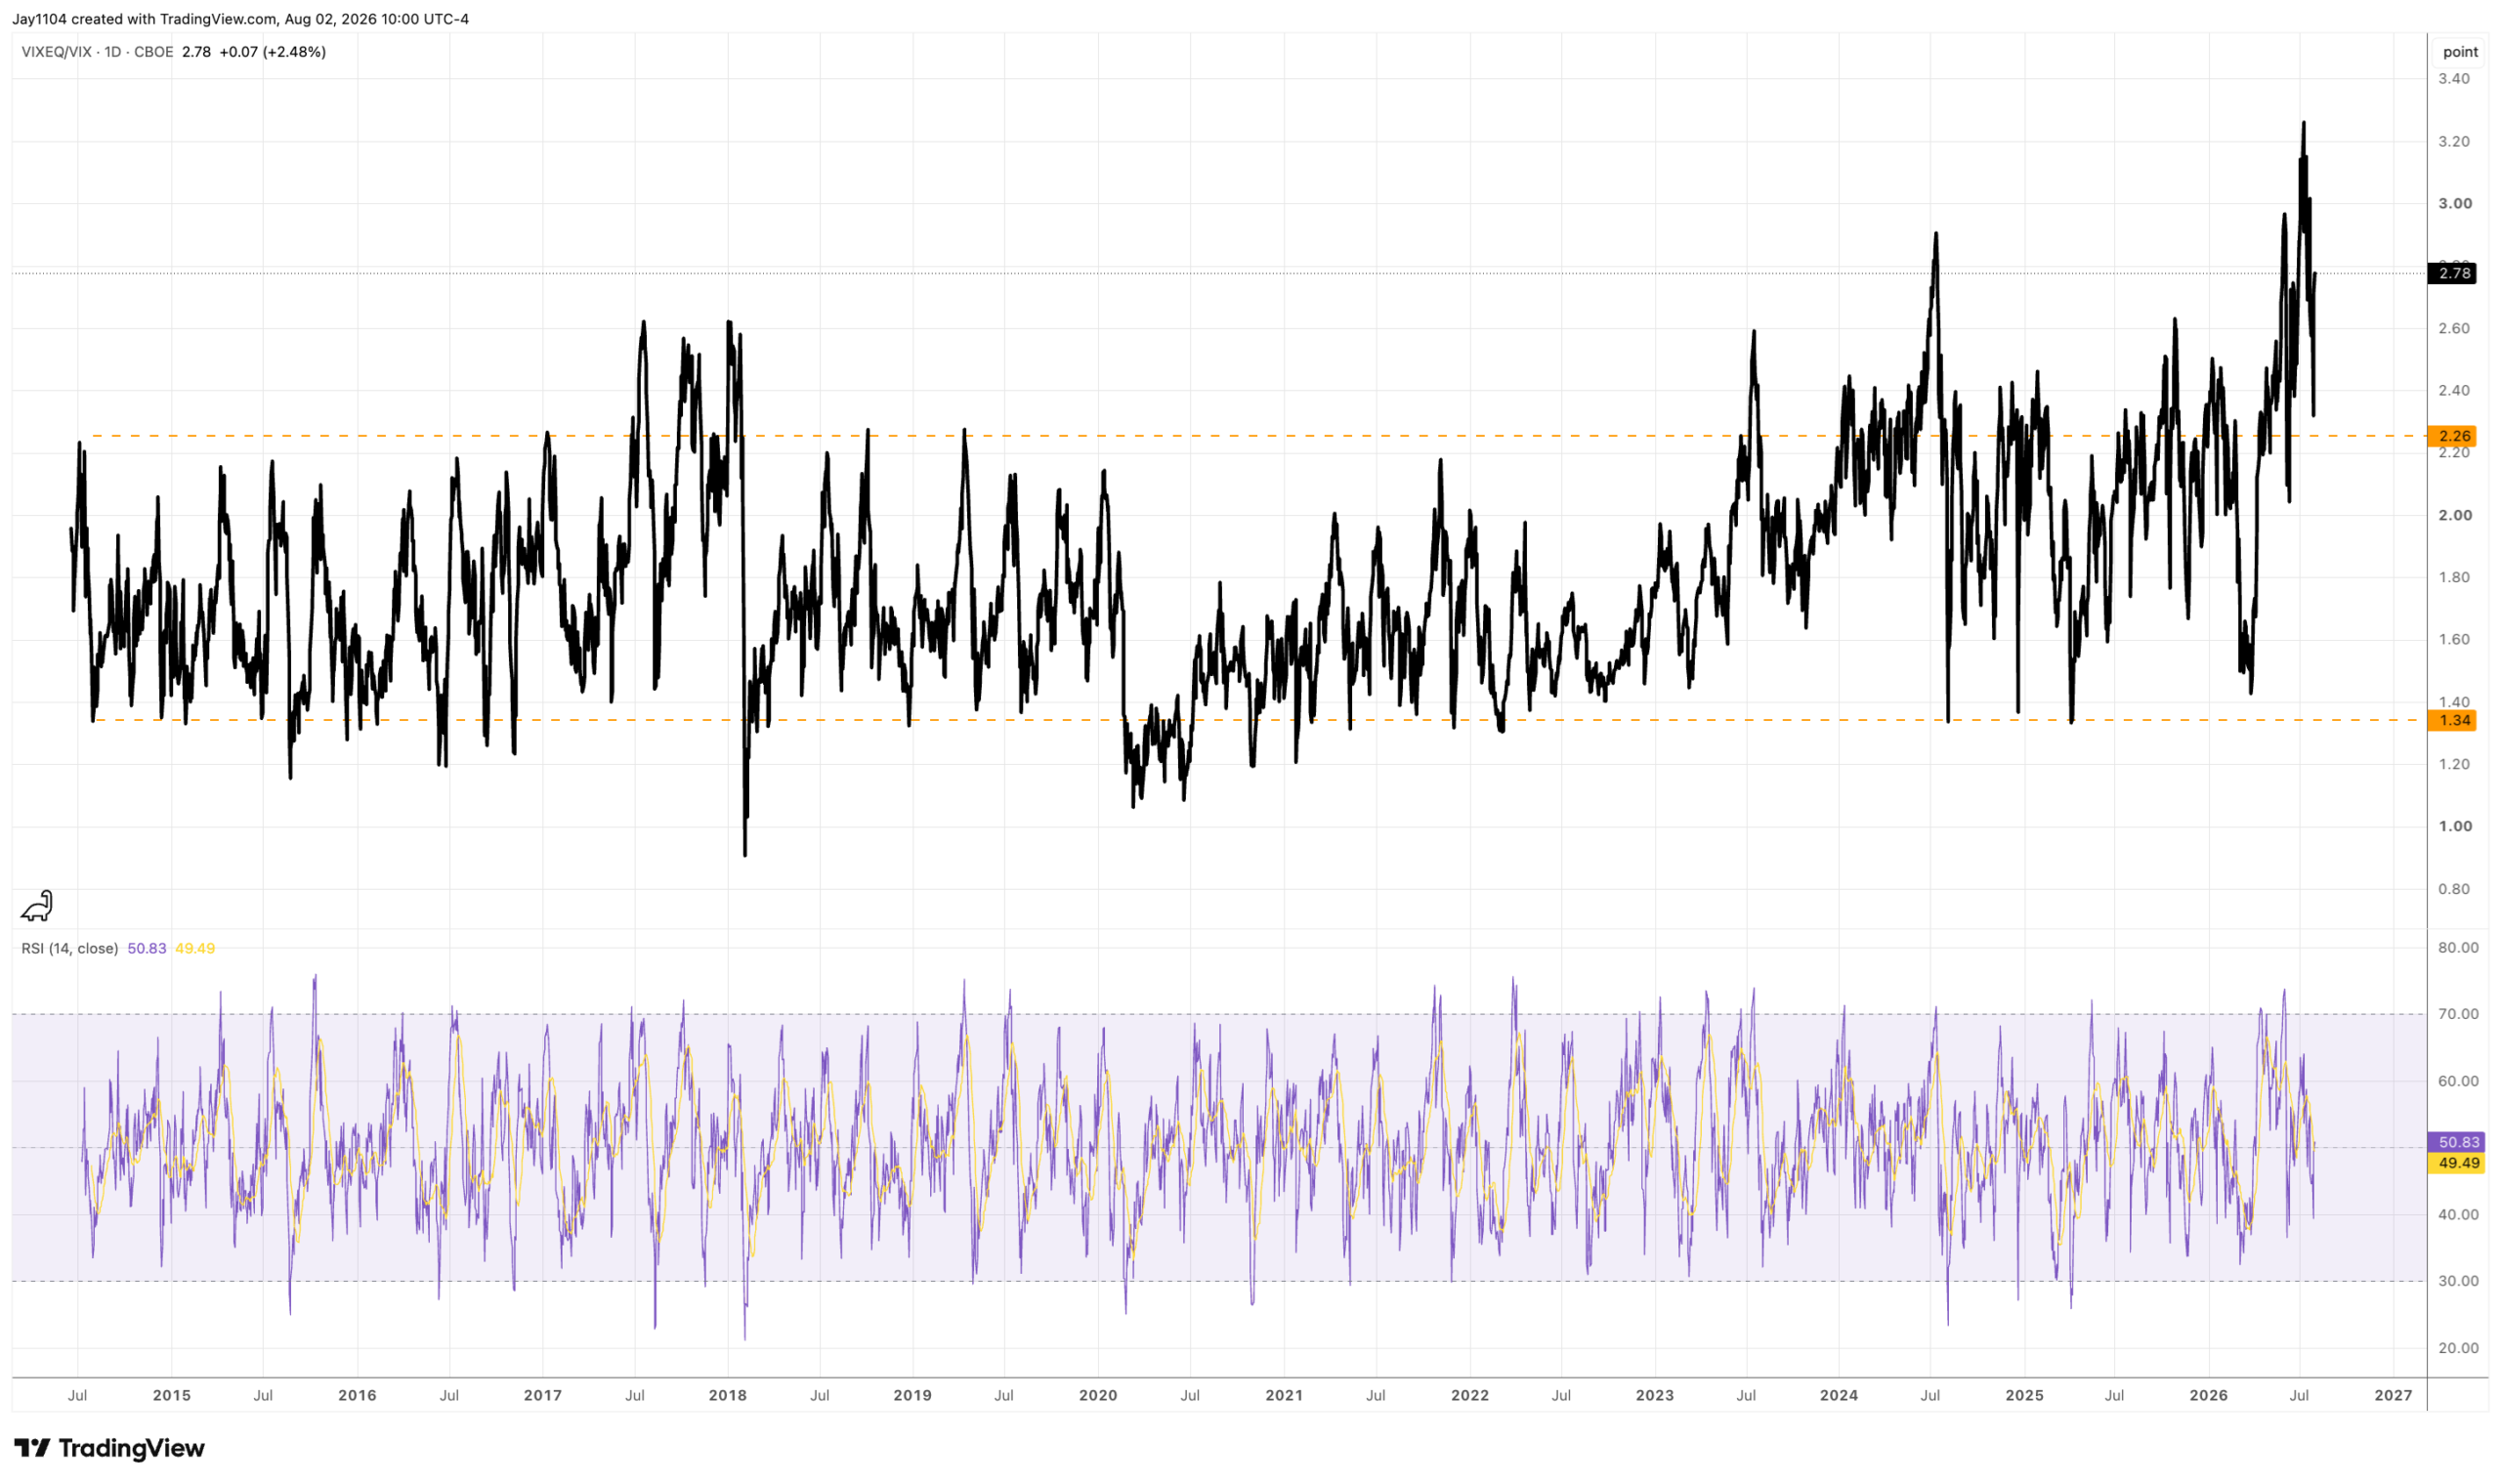
This could also result in the spread between the VIXEQ and the VIX Index narrowing, although it is unclear by how much. There used to be a well-defined range for this spread, but over the years it has widened, and its baseline has gradually moved higher. As a result, the spread may not have as much room to contract as it once did.
When viewed as a ratio, however, the distortion is not nearly as pronounced, suggesting there is still quite a bit of contraction ahead.
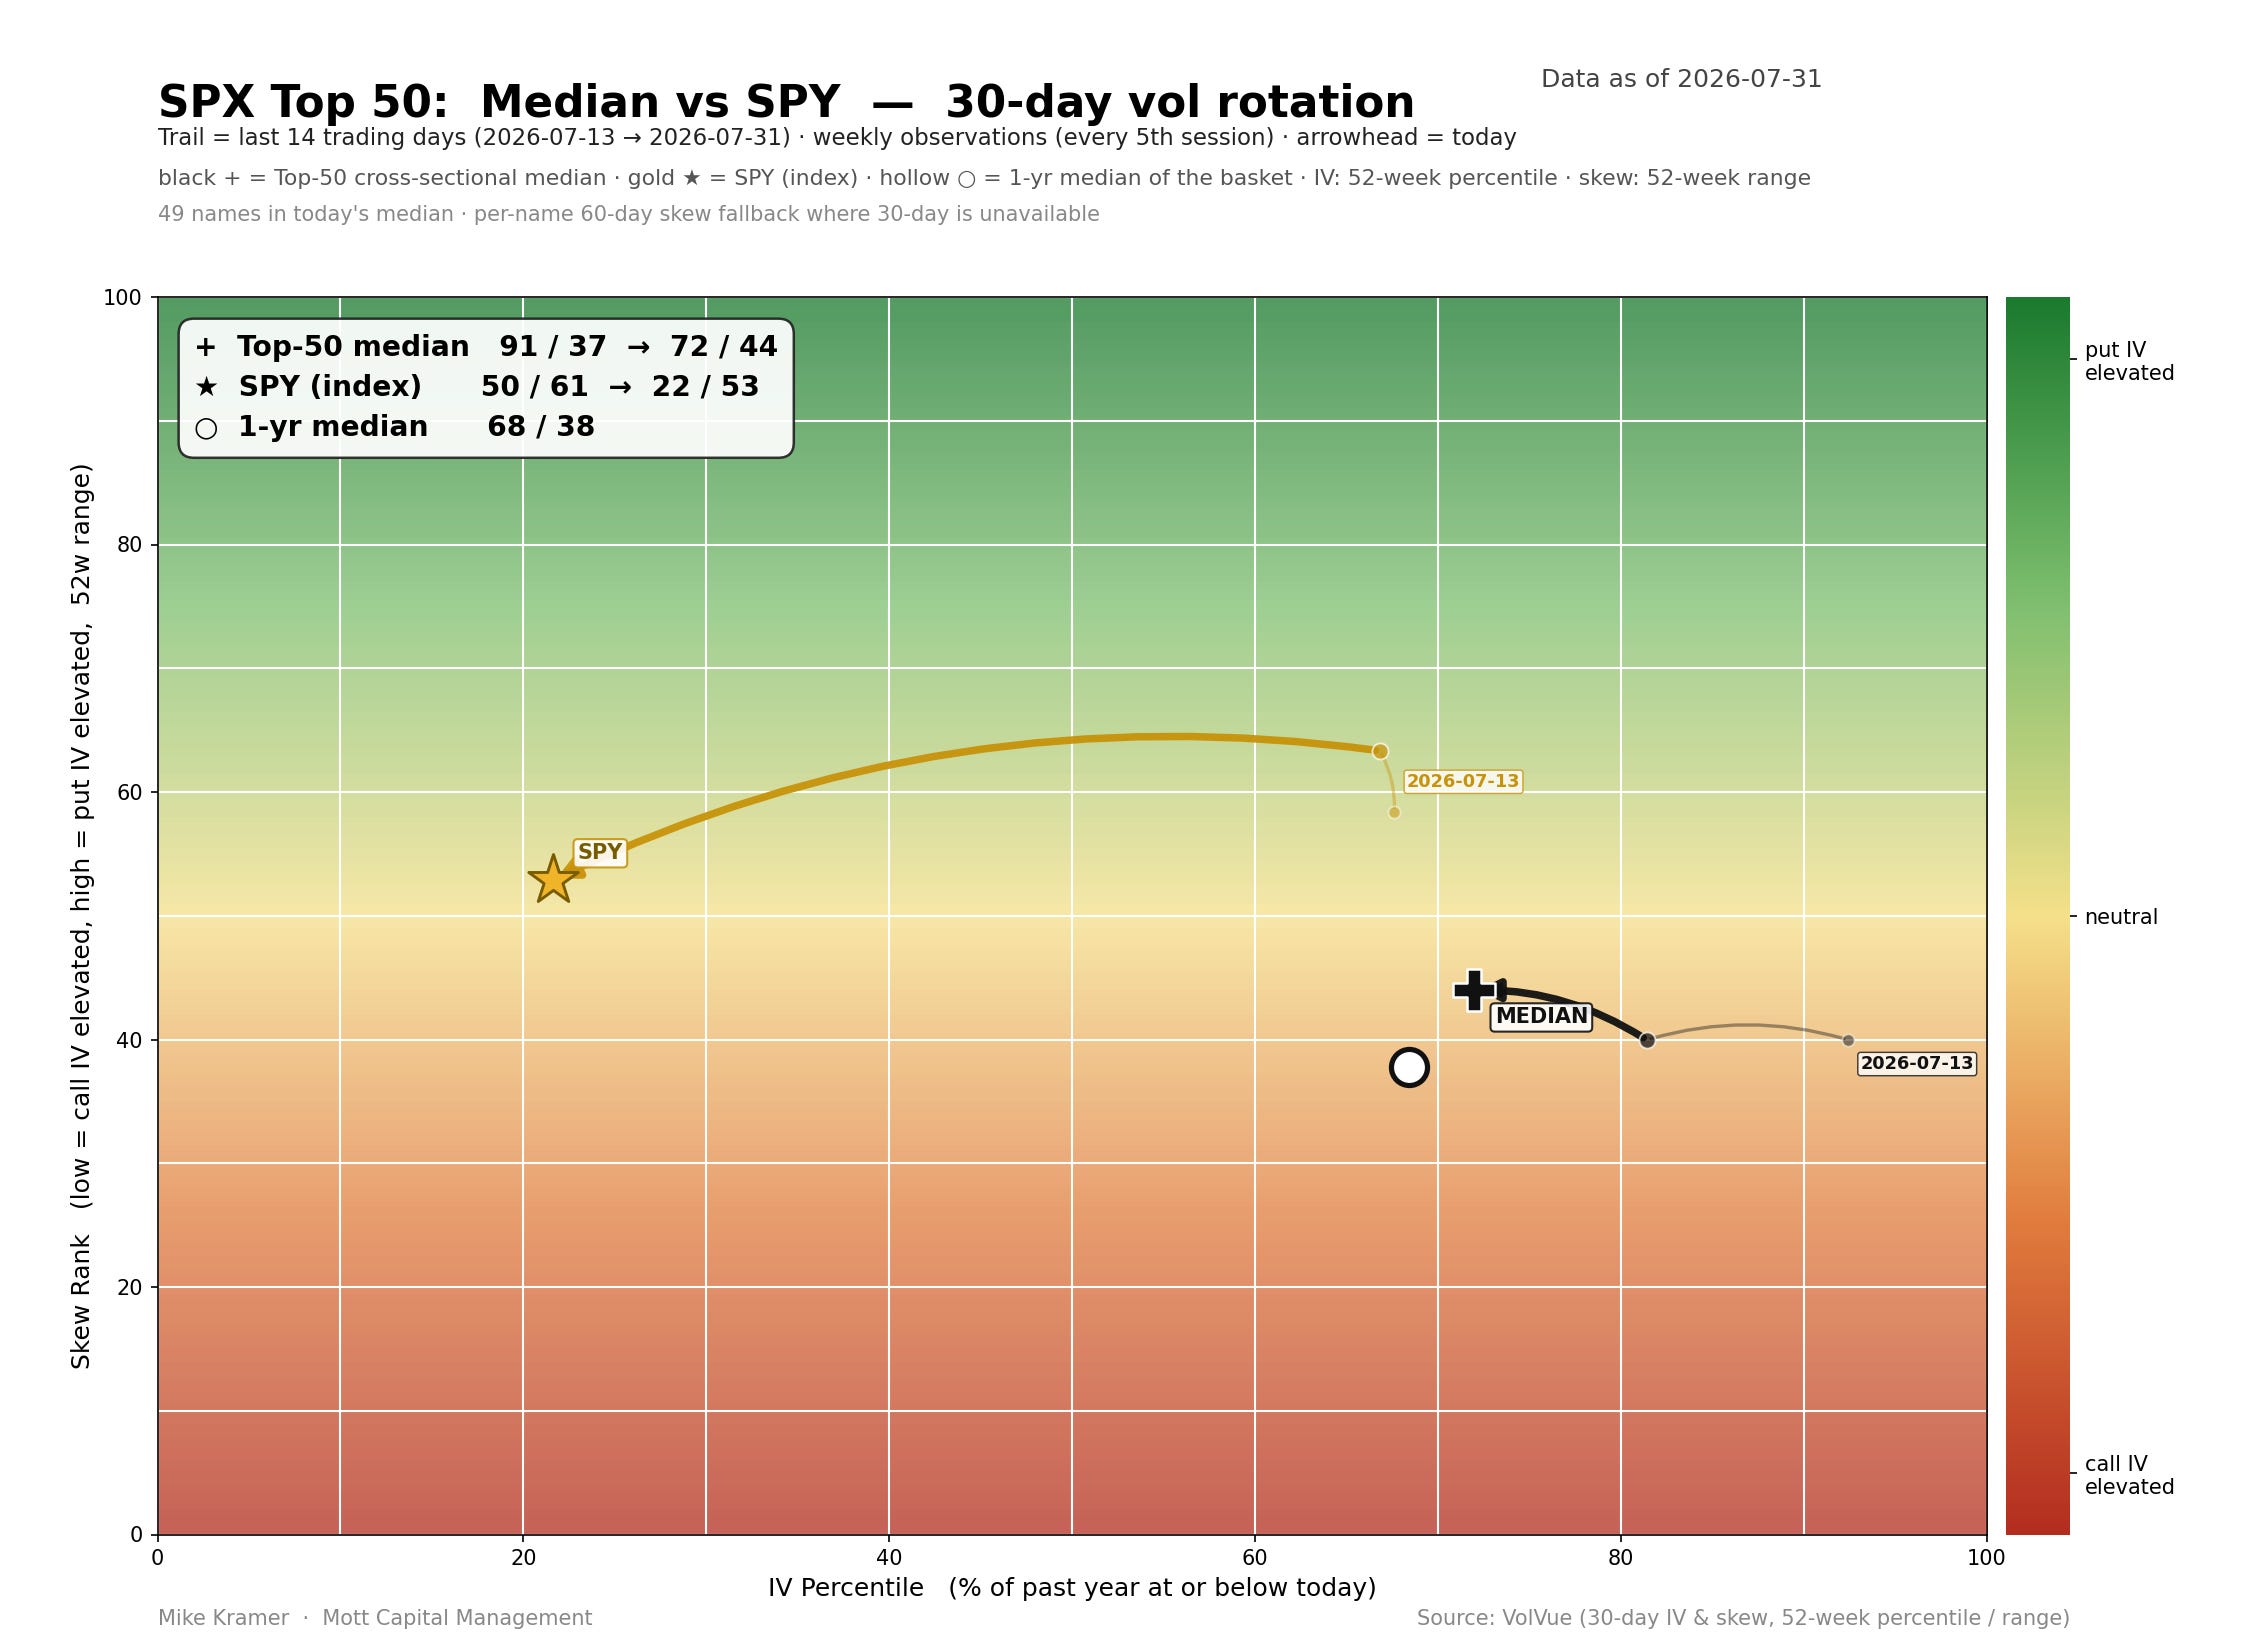
The median implied volatility and skewness for the top 50 stocks in the S&P 500 have both declined, but implied volatility for the index has fallen even more. That is likely why implied correlations have not increased.
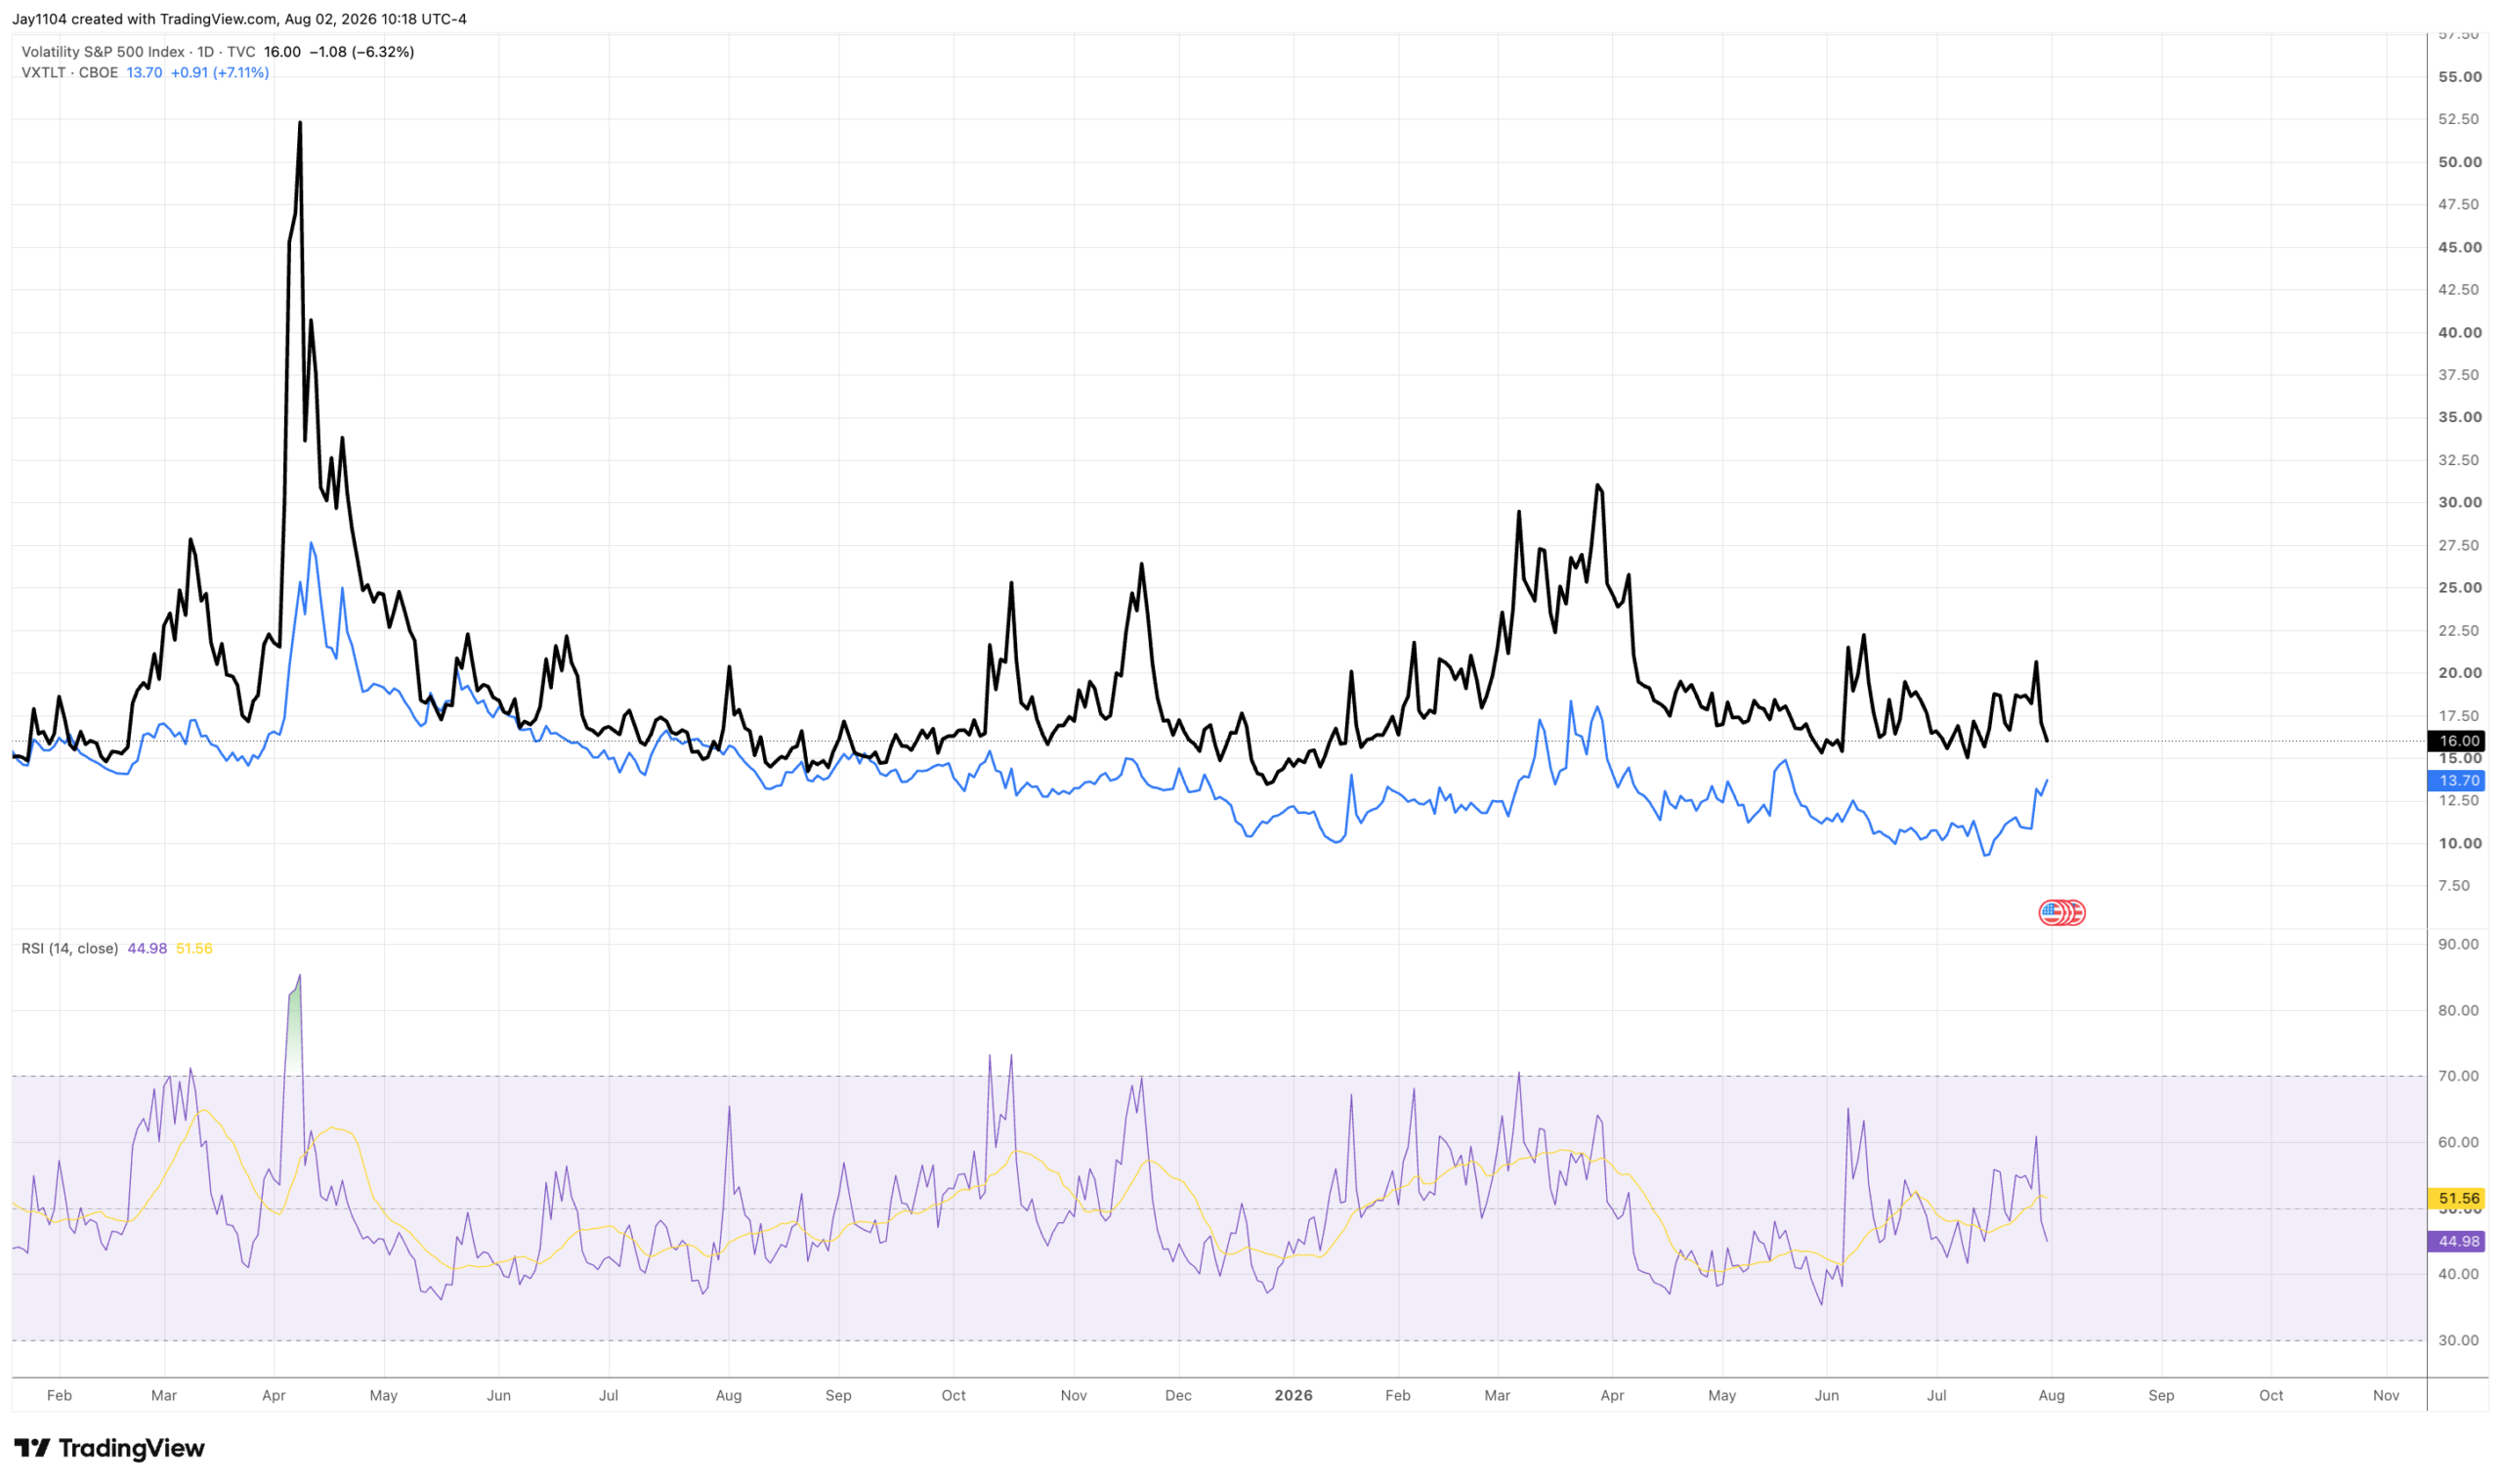
However, index volatility may have a harder time falling further, especially if volatility in the bond market continues to rise, as it has recently. Typically, when implied volatility in the bond market increases, implied volatility in the equity market rises as well.
Additionally, with this week’s calendar packed with major macroeconomic events, the VIX is likely to move higher heading into those releases. As a result, I would expect implied correlations to begin rising this week, which could keep pressure on risk assets.
-Mike
Glossary by ChatGPT
ADP Employment Report — A monthly estimate of U.S. private-sector employment published by ADP ahead of the official jobs report.
BLS (Bureau of Labor Statistics) — The U.S. government agency responsible for producing employment, inflation, and other key economic statistics.
Coupon Issuance — The sale of longer-term Treasury notes and bonds that pay periodic interest to investors.
Employment Cost Index (ECI) — A quarterly measure of changes in wages, salaries, and employer benefit costs across the U.S. economy.
Implied Correlation — A market-derived estimate of how closely the prices of individual stocks are expected to move together.
Implied Volatility — The market’s expectation of future price fluctuations as reflected in option prices.
Index Volatility — The expected future volatility of a market index derived from its option prices.
ISM Manufacturing Index — A monthly survey measuring business conditions and activity in the U.S. manufacturing sector.
ISM Services Index — A monthly survey tracking business activity in the U.S. services sector.
JOLTS (Job Openings and Labor Turnover Survey) — A monthly report measuring job openings, hiring, and separations across the U.S. labor market.
Median Implied Volatility — The midpoint implied volatility reading across a group of securities, reducing the impact of outliers.
Productivity — A measure of economic output produced per hour worked.
Quarterly Refunding Announcement (QRA) — The U.S. Treasury’s quarterly update outlining its borrowing plans and the mix of securities it expects to issue.
Revelio Labs — A labor market analytics firm that uses alternative employment data to track hiring and workforce trends.
Risk Assets — Investments such as equities, high-yield bonds, and commodities whose prices are more sensitive to economic and financial conditions.
Single-Stock Volatility — The expected price fluctuation of an individual company’s shares, typically measured using options.
Skewness — The relative difference in implied volatility across option strike prices, often reflecting demand for downside protection.
Unit Labor Costs — The average labor cost required to produce one unit of economic output.
VIX Index — The CBOE Volatility Index, commonly viewed as the market’s expectation of near-term volatility for the S&P 500.
VIXEQ — An implied volatility index based on individual S&P 500 constituent options, often used to compare single-stock volatility with index volatility.
Disclosure
This report contains independent commentary to be used for informational and educational purposes only. Michael Kramer is a member and investment adviser representative with Mott Capital Management. Mr. Kramer is not affiliated with this company and does not serve on the board of any related company that issued this stock. All opinions and analyses presented by Michael Kramer in this analysis or market report are solely Michael Kramer’s views. Readers should not treat any opinion, viewpoint, or prediction expressed by Michael Kramer as a specific solicitation or recommendation to buy or sell a particular security or follow a particular strategy. Michael Kramer’s analyses are based upon information and independent research that he considers reliable, but neither Michael Kramer nor Mott Capital Management guarantees its completeness or accuracy, and it should not be relied upon as such. Michael Kramer is not under any obligation to update or correct any information presented in his analyses. Mr. Kramer’s statements, guidance, and opinions are subject to change without notice. Past performance is not indicative of future results. Neither Michael Kramer nor Mott Capital Management guarantees any specific outcome or profit. You should be aware of the real risk of loss in following any strategy or investment commentary presented in this analysis. Strategies or investments discussed may fluctuate in price or value. Investments or strategies mentioned in this analysis may not be suitable for you. This material does not consider your particular investment objectives, financial situation, or needs and is not intended as a recommendation appropriate for you. You must make an independent decision regarding investments or strategies in this analysis. Upon request, the advisor will provide a list of all recommendations made during the past twelve months. Before acting on information in this analysis, you should consider whether it is suitable for your circumstances and strongly consider seeking advice from your own financial or investment adviser to determine the suitability of any investment.