
Three Drivers Of The Rally May Be Ready To Reverse At Once

Three Drivers Of The Rally May Be Ready To Reverse At Once
Educational market commentary. Not investment advice. Not a recommendation. Not a solicitation.
Saturday, May 16, 2026
Note: Today’s free weekend recap is presented in the same format as the daily paid member reports, offering a look at the macro framework, liquidity analysis, volatility positioning, and cross-asset themes that shape the regular member commentaries. The more granular options-positioning data, individual-name setups, tactical levels, and daily updates remain exclusive to paid subscribers.
Memorial Day Sale Starts Now
Monthly Subscription: Now $65/month, down from $85/month — save $20 per month.
Annual Subscription: Now $550/year, down from $750/year — save $200 per year.
Video
Tape Card
What’s New Today
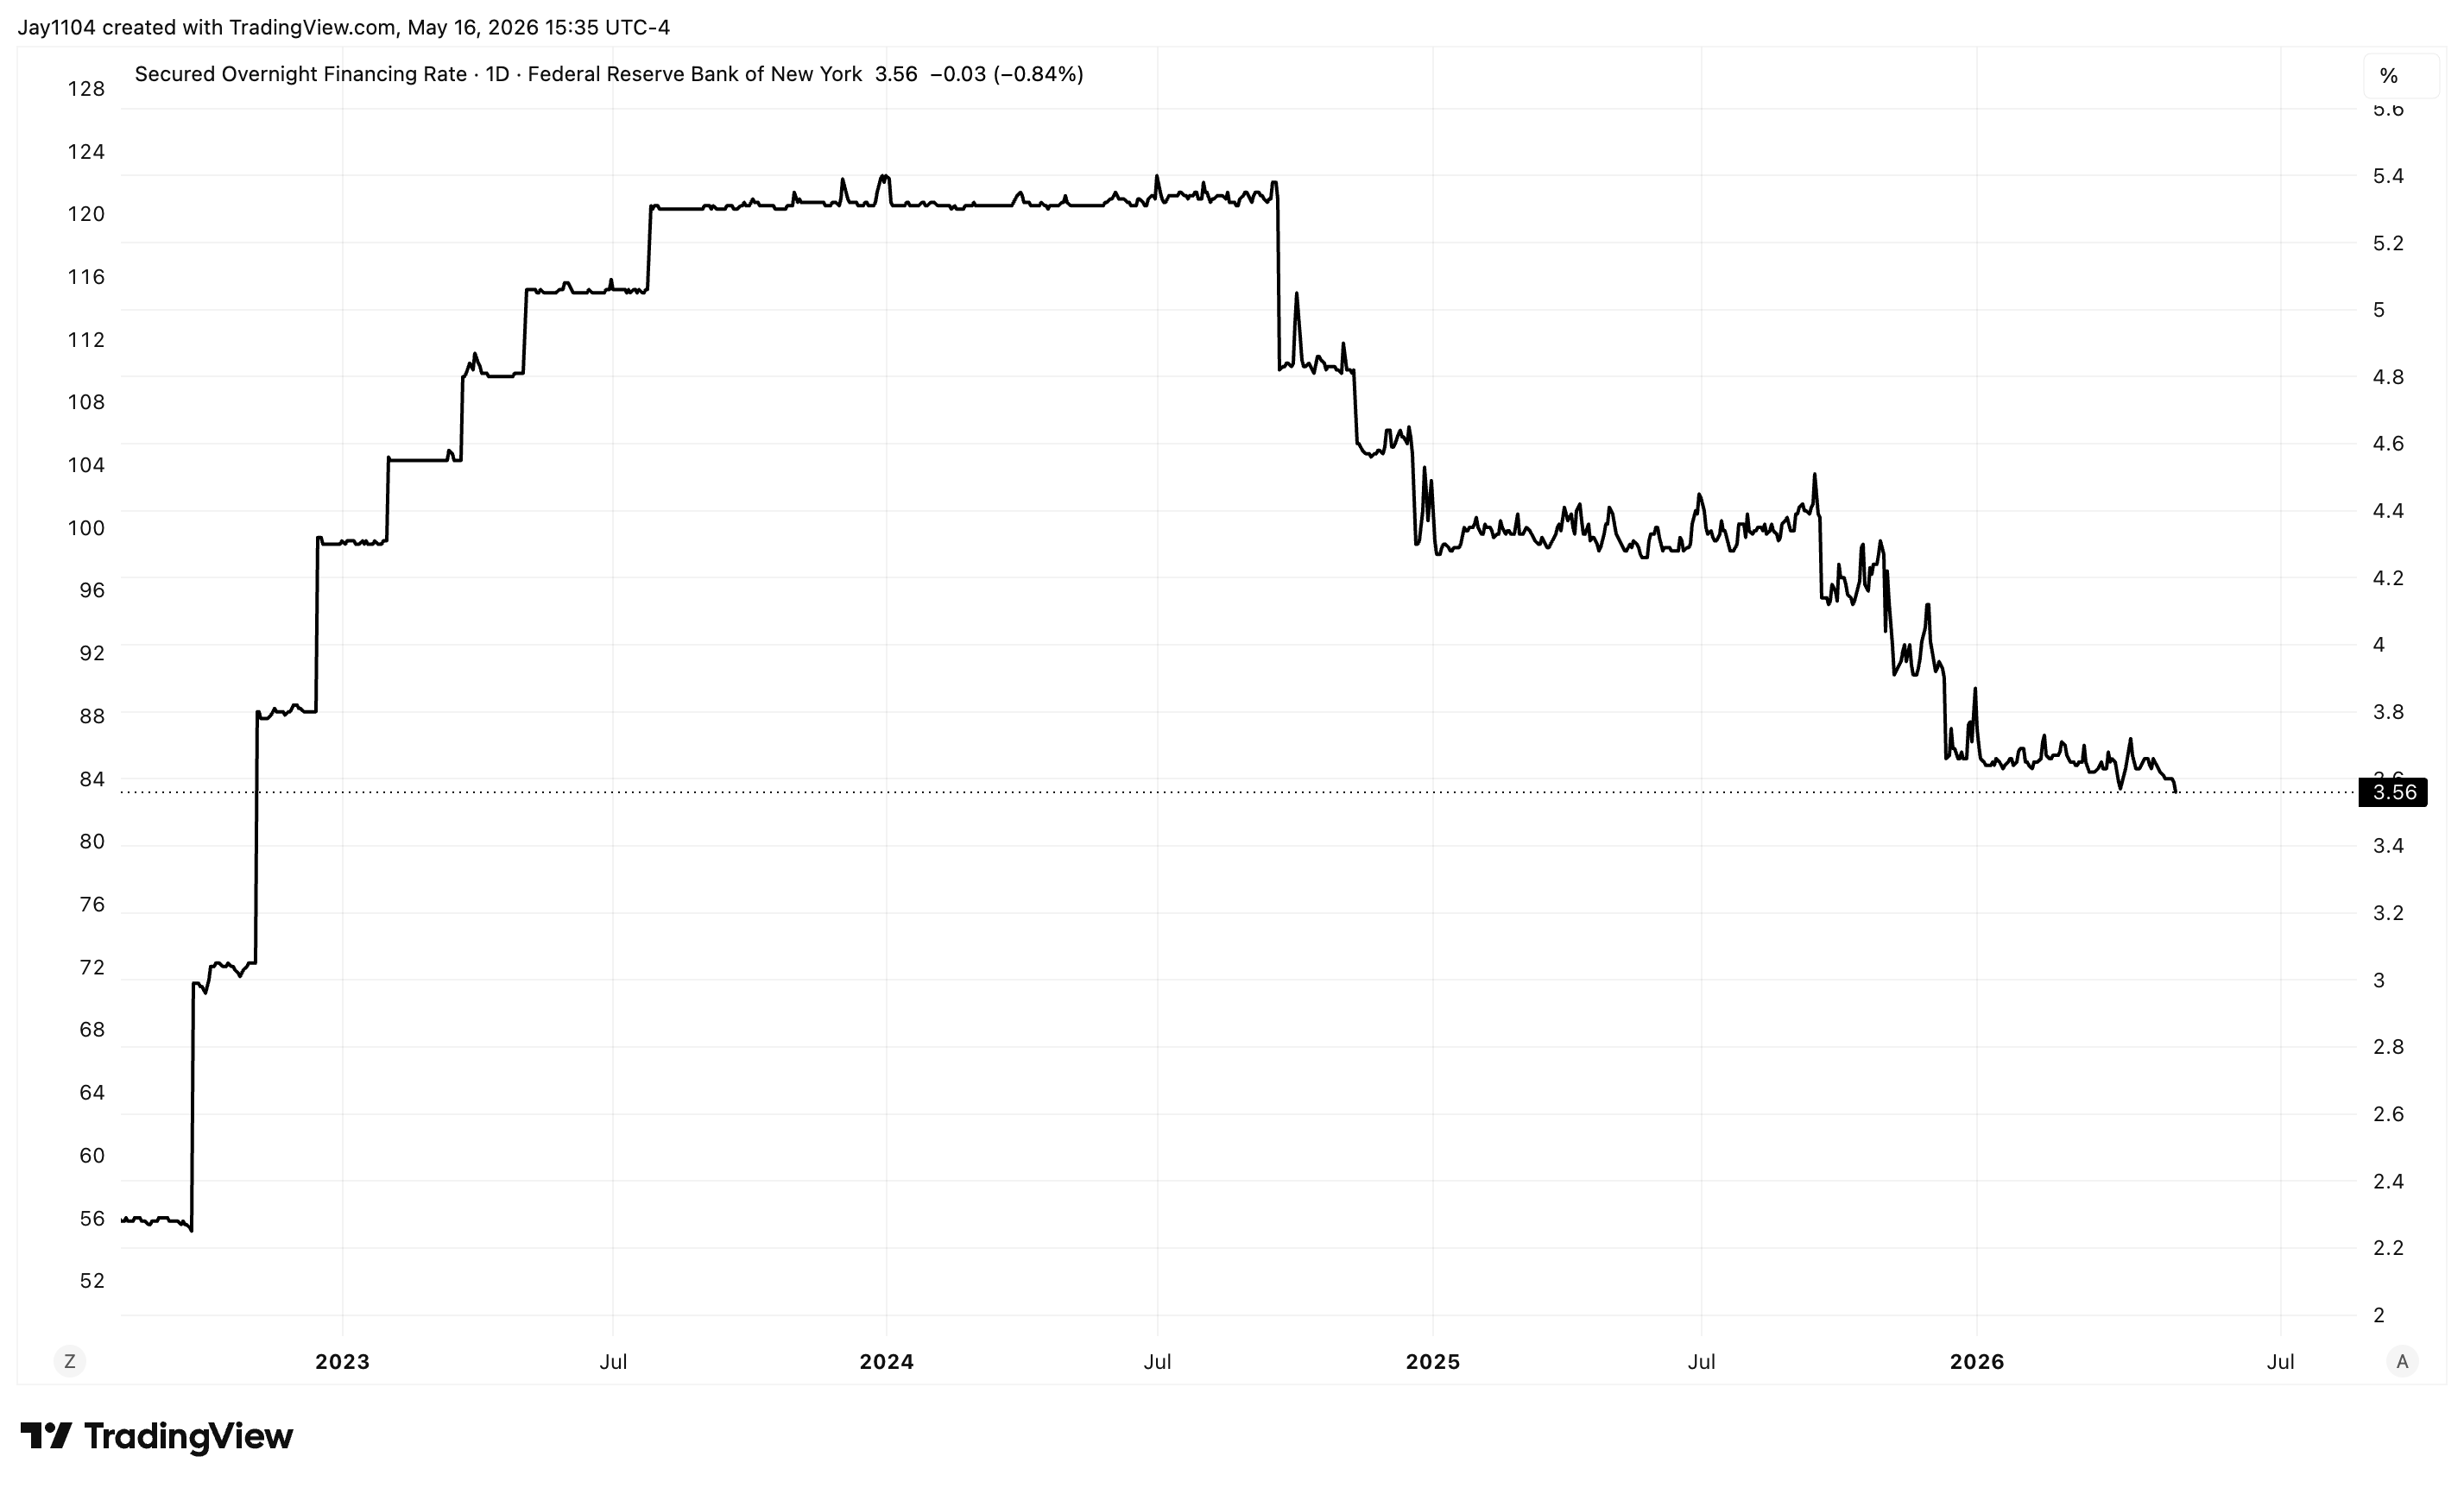
SOFR at 3.56 = excess-cash regime; the print at 8am Monday is the watch-item — SOFR came all the way down to 3.56 from Thursday’s action. “As long as this number stays low, it’s an indication that there’s ample liquidity in the market. In fact, there’s almost an imbalance between supply and demand for collateral.” The rate moving up alongside Treasury increase bill issuance is the confirming signal the liquidity regime has flipped. Levels: SOFR 3.56.
Forward pricing — the market is now pricing a 2027 Fed hike, with the inflation curve climbing — December 2027 Fed funds futures at 3.86%. The 3-month 12-month forward minus 3-month spot is around +38 basis points — “market’s kind of going through that stage of pricing in interest rate hikes.” Inflation swap curve: 5-year at ~2.70%, 10-year at ~2.50%. The path-flip thesis is oil-driven: “this is pretty much just trading with oil. What was the driving force of the disinflation we really were seeing the last few years? It’s really been oil.” Core PCE has been stuck at ~3% for years — “that was one of the fears I had going back to 2022... and that certainly has played out.” If oil is no longer the disinflationary force, inflation goes back up and the rate-cut path has to be repriced to hikes. Levels: Dec 2027 Fed funds 3.86% / 3M 12M forward +38 bps over spot / 5Y inflation swap 2.70% / 10Y inflation swap 2.50% / core PCE stuck ~3%.
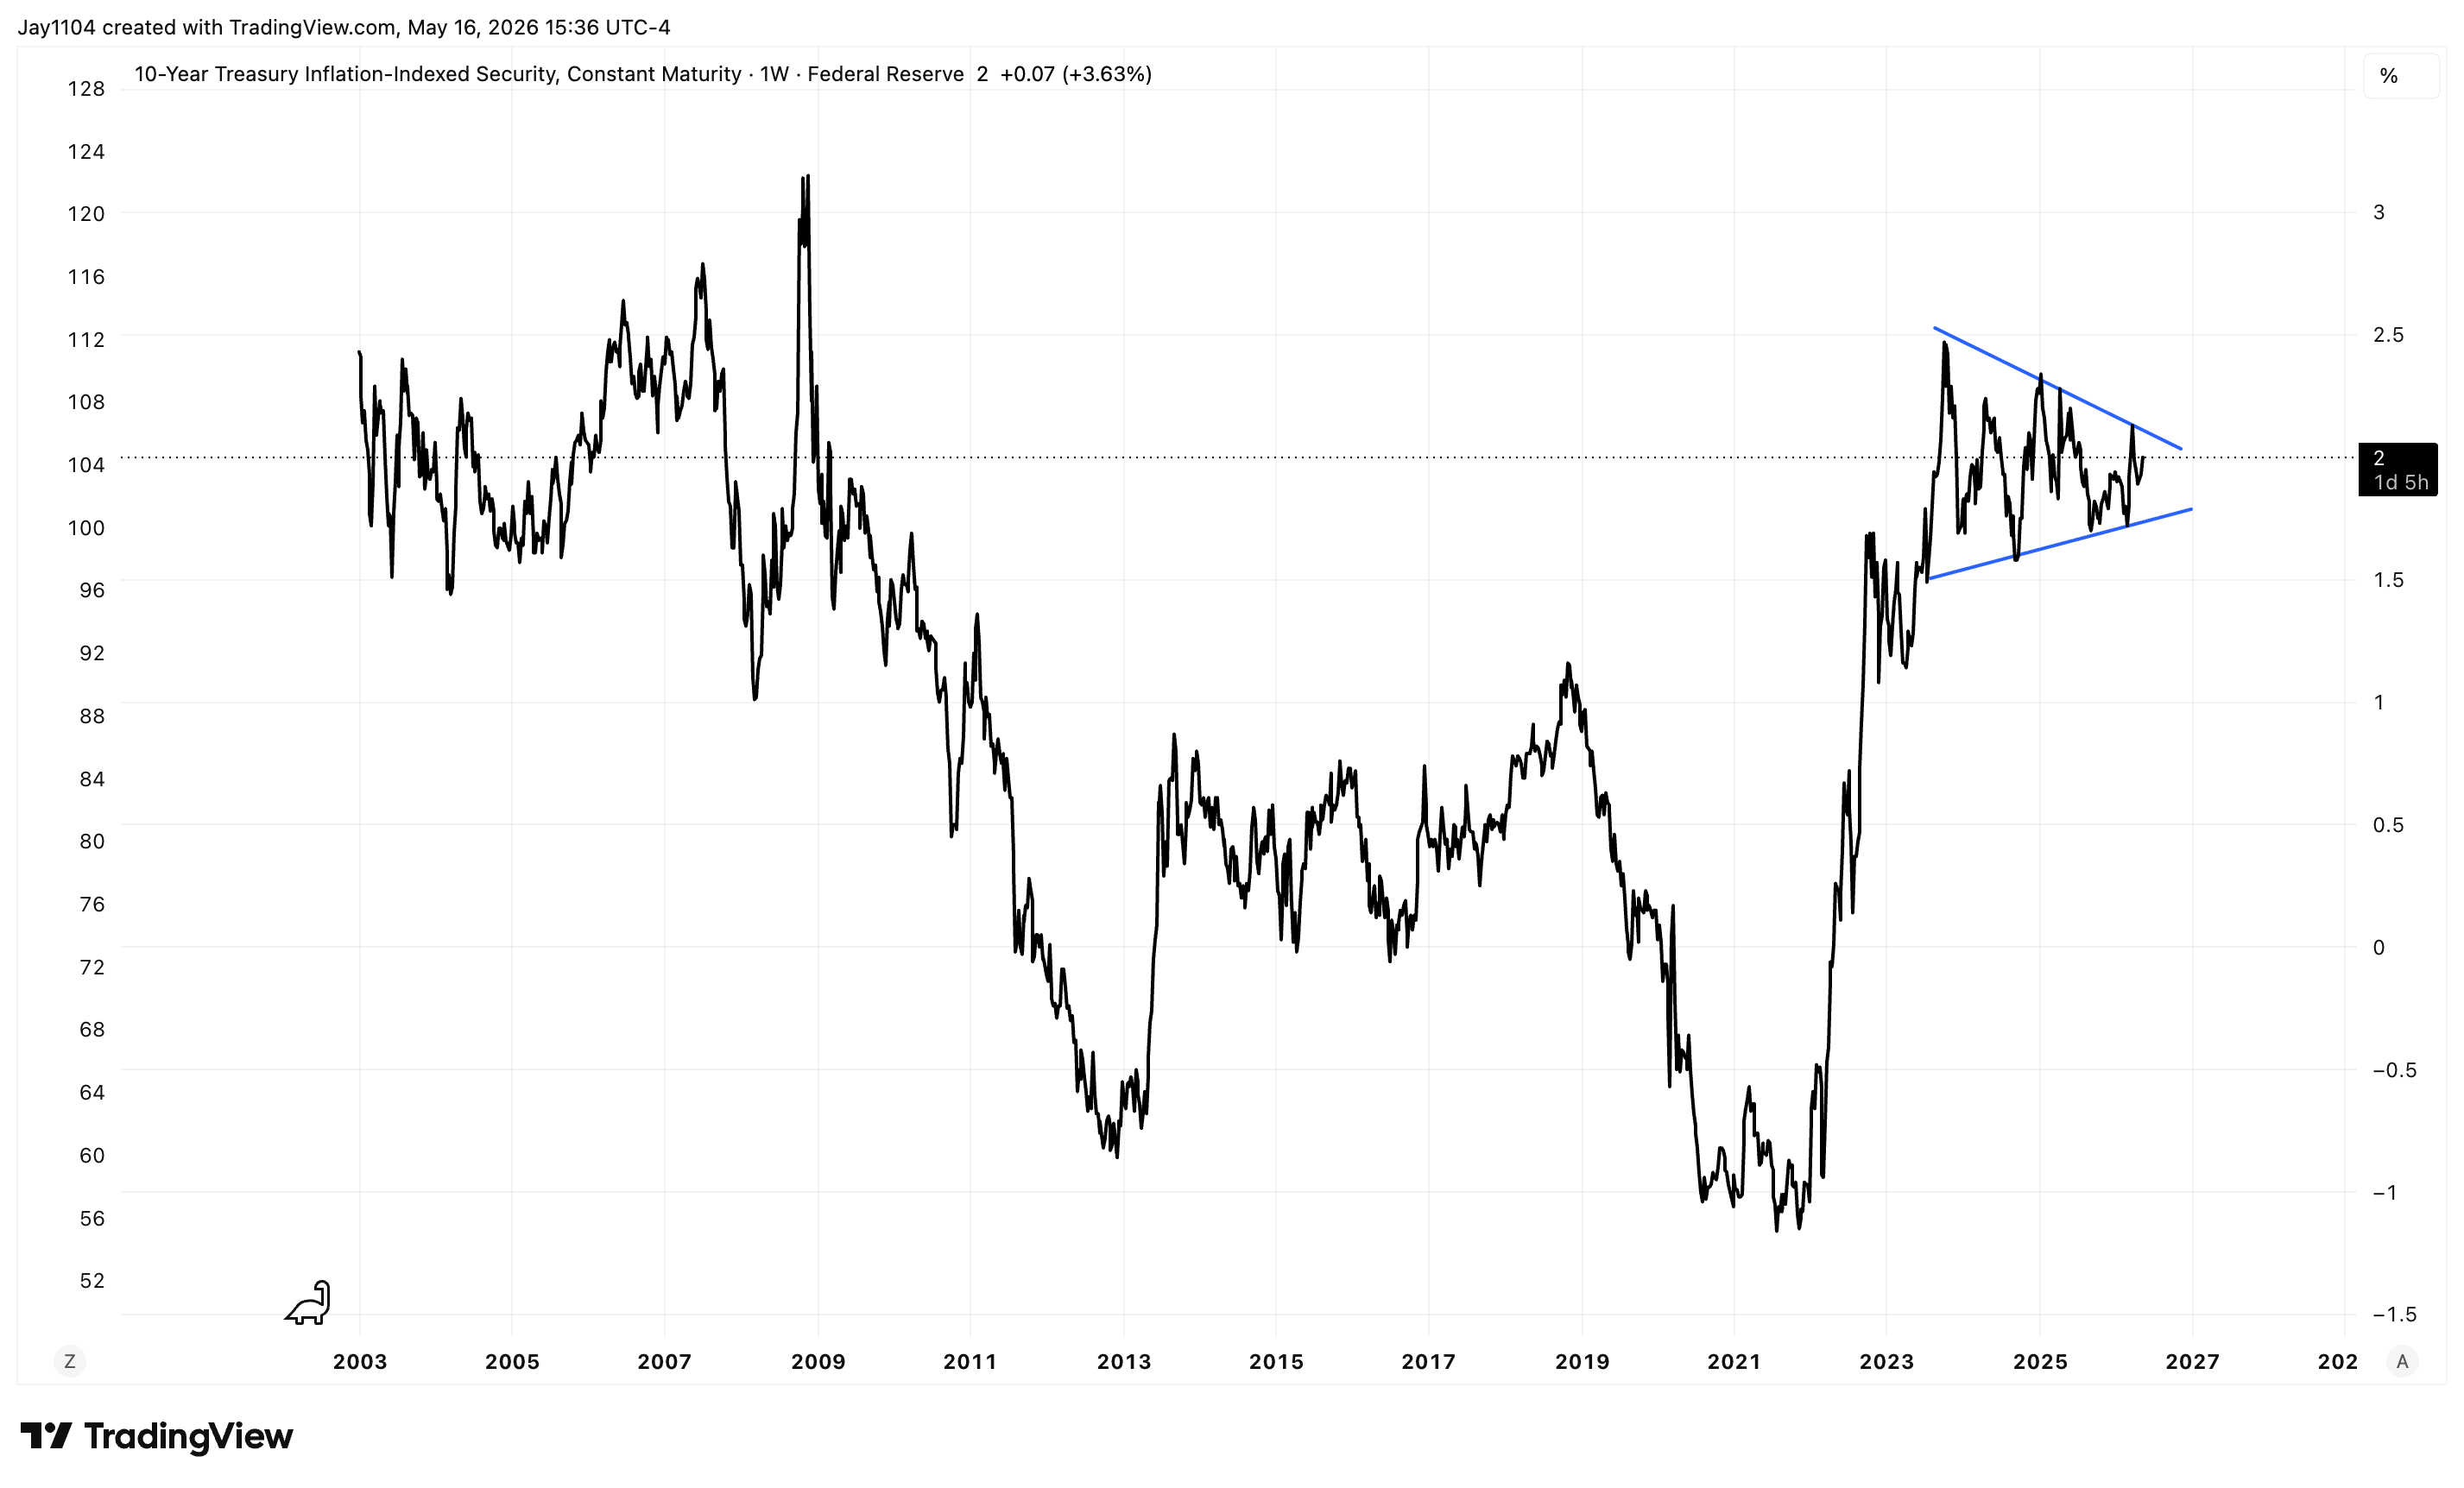
Real yields at multi-decade highs — 30Y above its May 2025 high, 10Y at 2.07% with 2.20% the next attention zone — “if you started seeing the ten year real yield moving up towards the two-twenty area, that might start catching more people’s attention.” On the 30-year: “the last time we were here was basically 2007 and 2008. For anything sustained higher than where we are right now, you have to really go back to 2003.” The 2008 print sat inside the financial-crisis meltdown — Mike treats it as possibly anomalous. The clean reference takes you to 2000–2002. “We know that wasn’t a particularly good time for the stock market.” Levels: 10Y real yield 2.07 / target 2.20 / 30Y real yield above May 2025 high / pre-anomaly reference 2003 / strange-period reference 2007–2008.
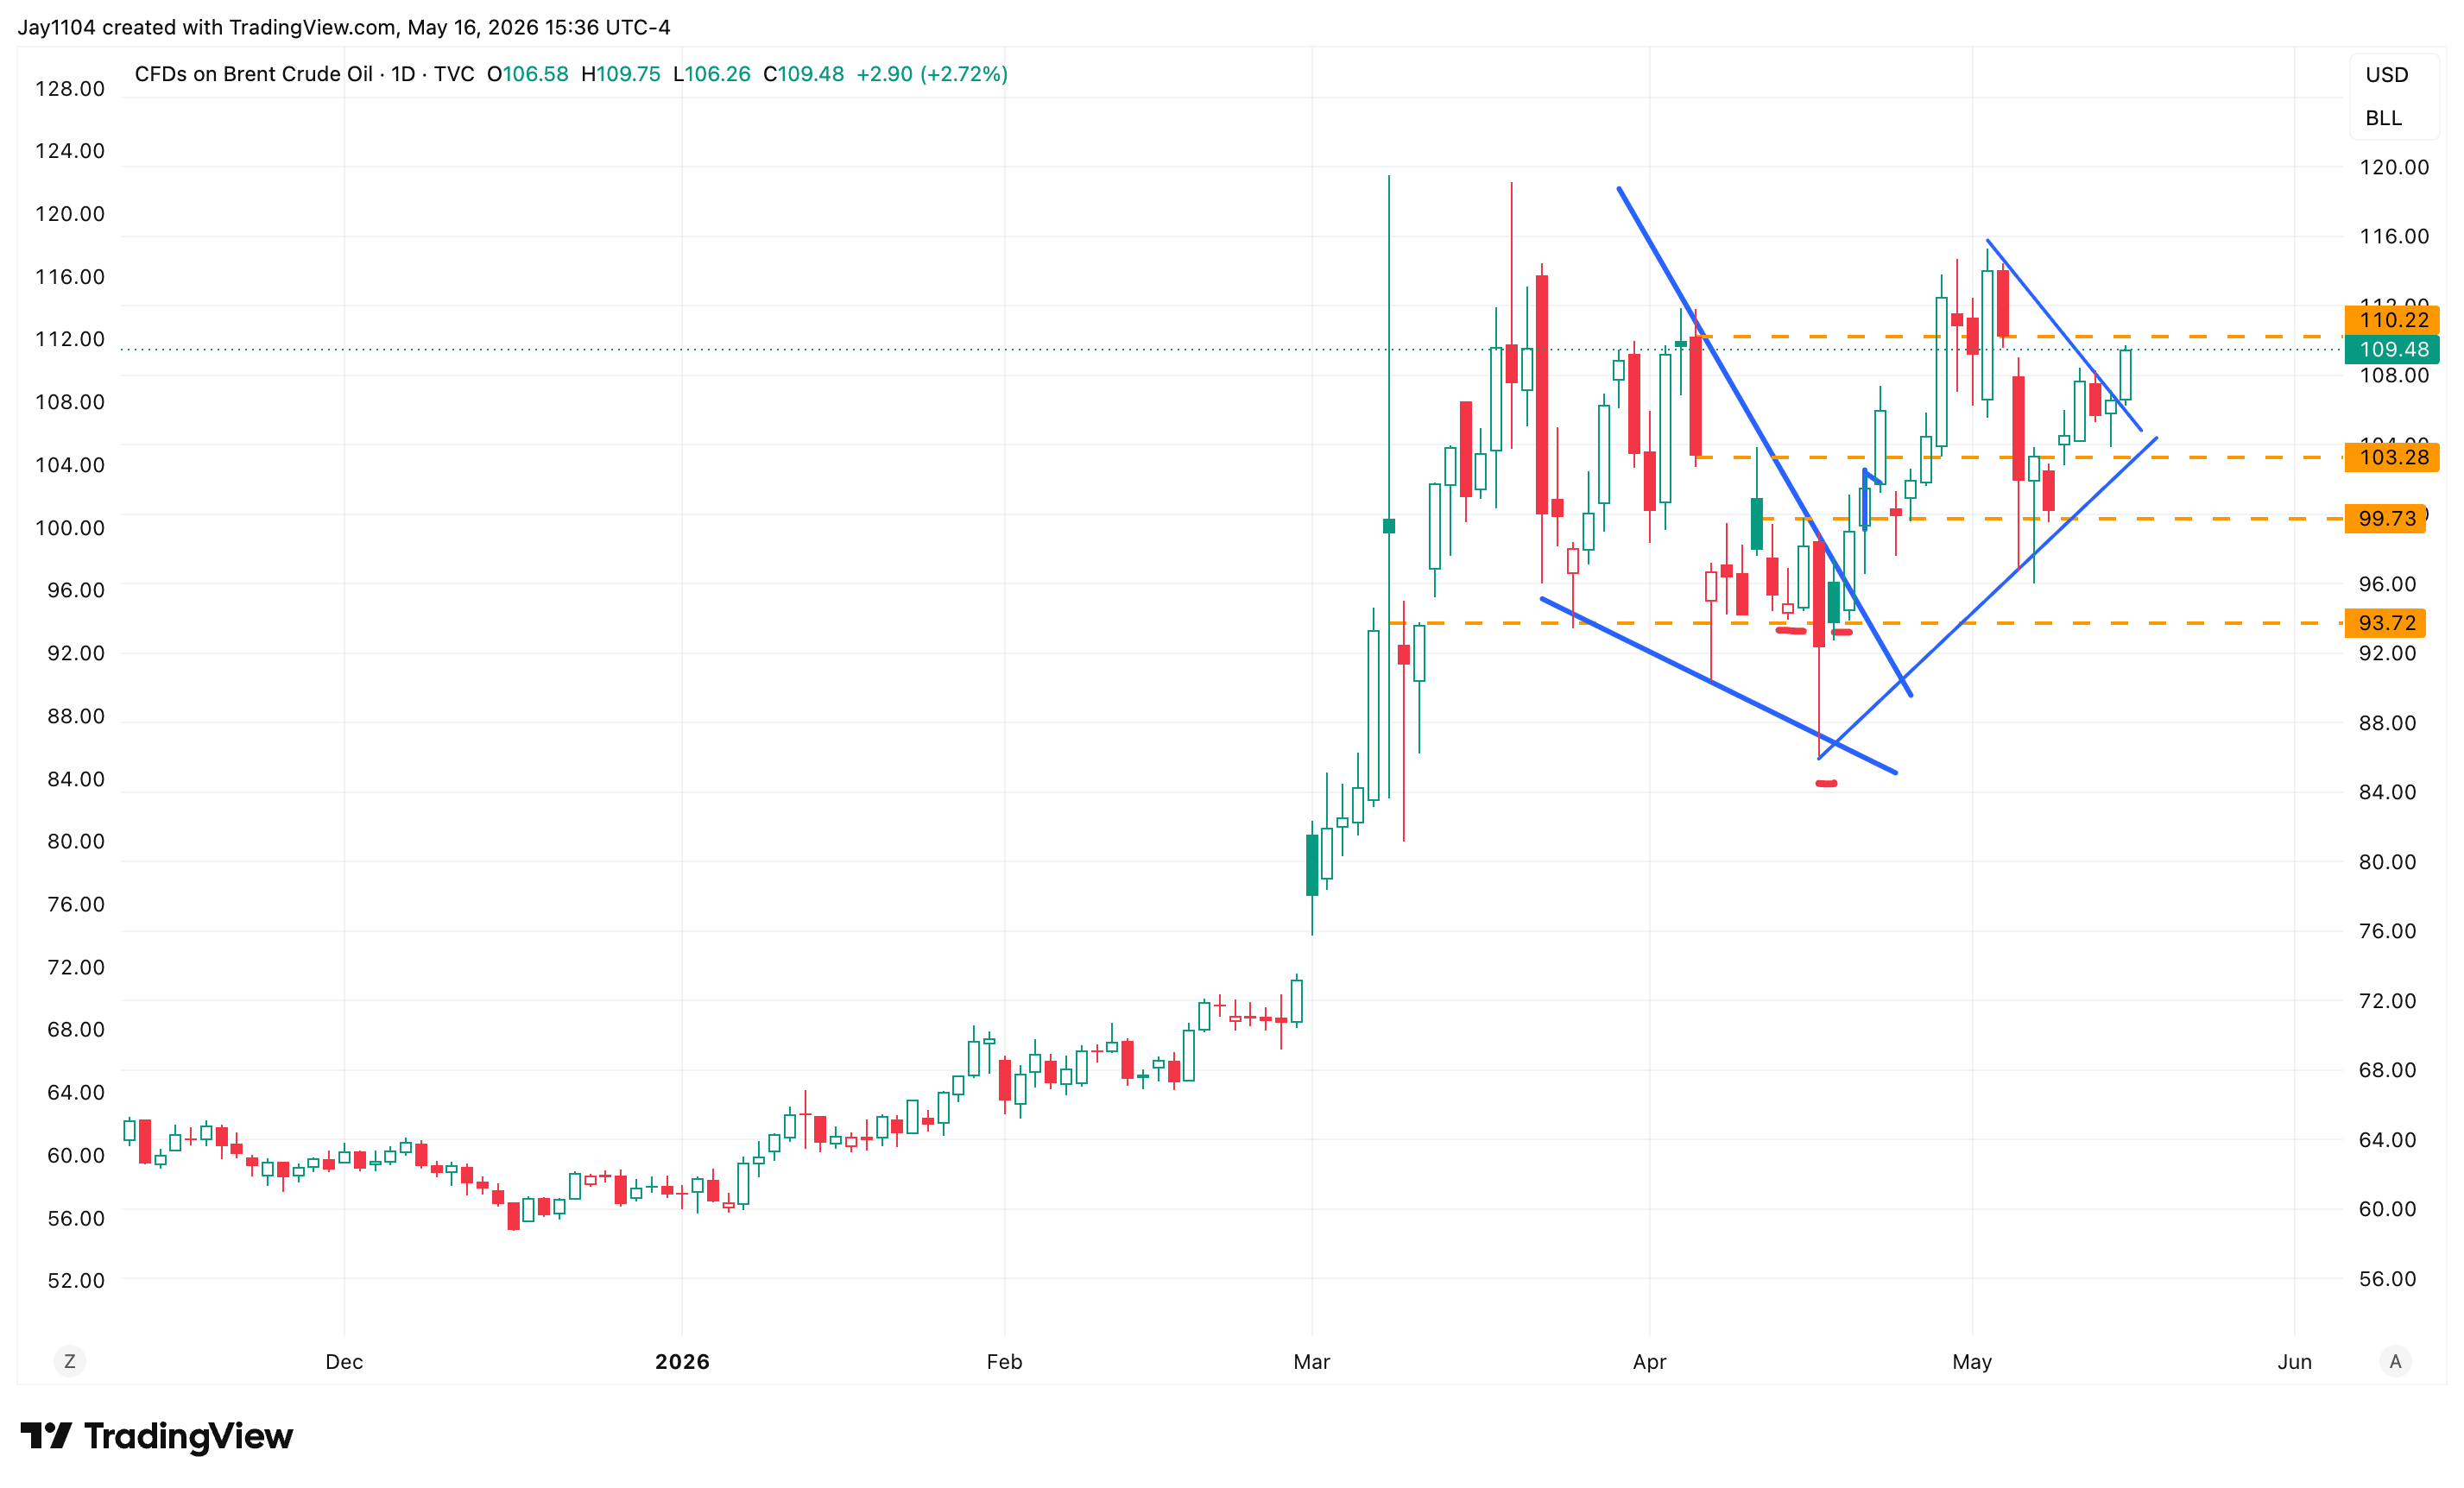
Brent oil — falling-wedge breakout has been consolidating in a symmetrical-triangle continuation; $110/$113 are the upside levels — the falling wedge broke out earlier, and the consolidation since has the shape of a symmetrical triangle that may itself be breaking out. “If we can see Brent get over the $110 area, and maybe even push above $113, we could really be off for quite a run higher.” Levels: 110 / 113.
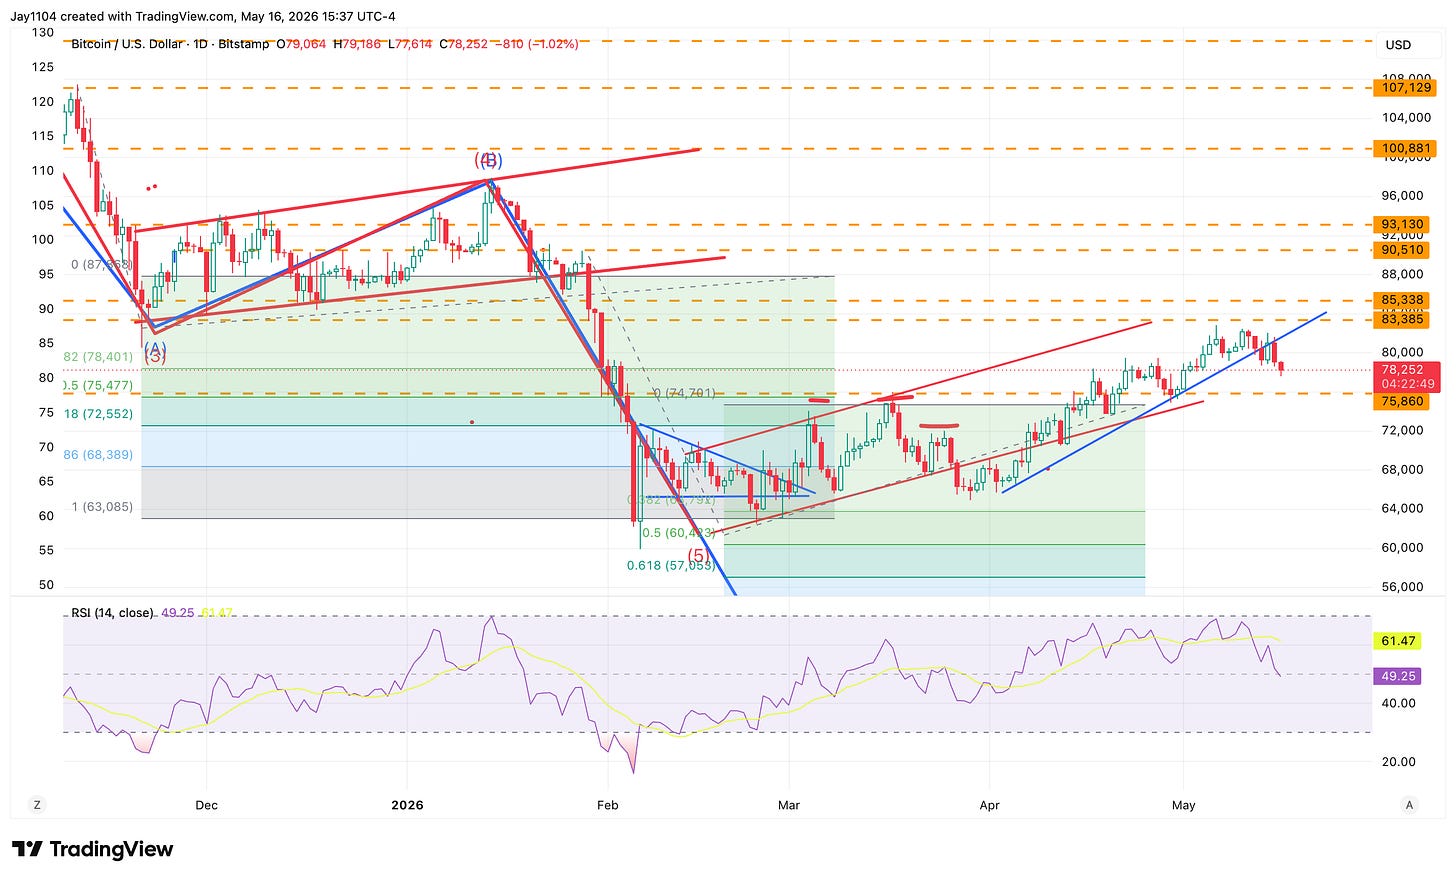
Bitcoin restated as the primary liquidity / financial-conditions gauge — “I don’t know how to value Bitcoin other than as a liquidity gauge, sort of a financial conditions gauge.” If Bitcoin continues to deteriorate, it’s “the best indication we have of the potential tightening liquidity picture and the potential for financial conditions tightening,” and that feeds into equity prices.
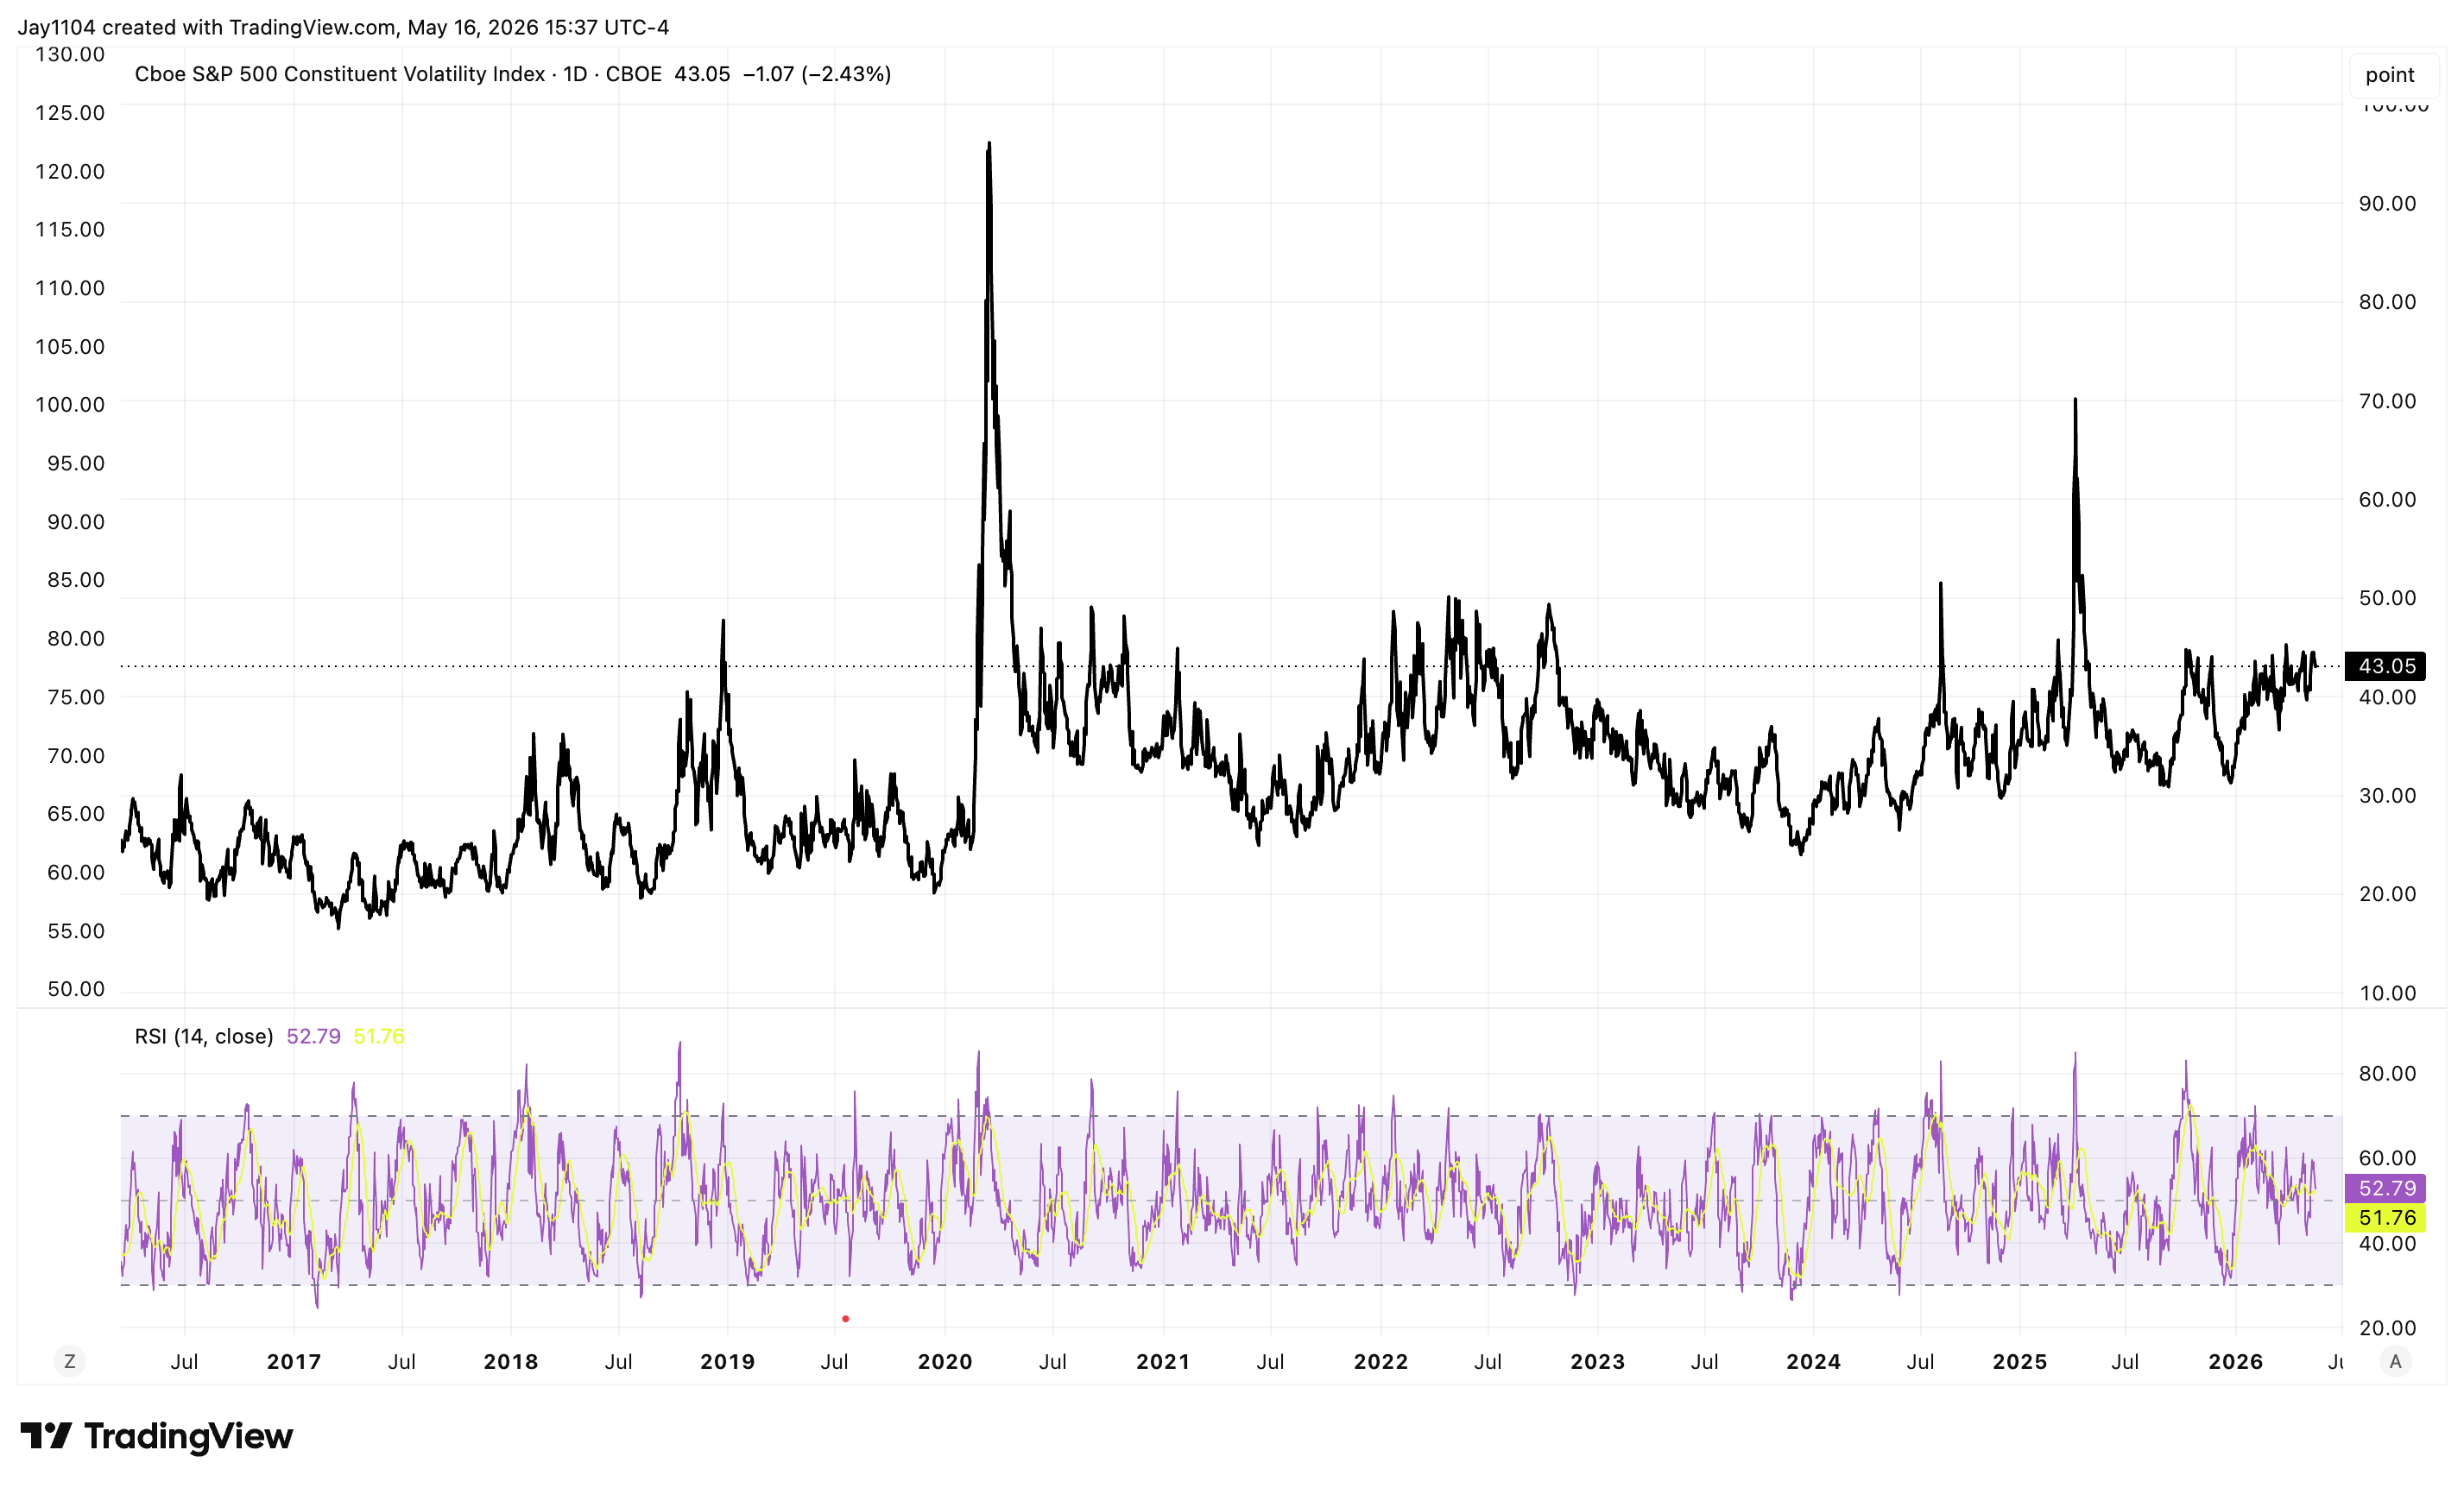
VIX ~17 flat / VIXEQ rising / DSPX still elevated — constituent vol at the upper end of historical range while the index is at all-time highs — “this isn’t COVID. The market’s not behaving like COVID. The market’s not behaving like it was during the tariff tantrum, and you’re not seeing the big drawdowns in the marketplace like you did during 2022 and parts of 2023.” And yet constituent IV is sitting at historically extreme levels. Same on dispersion. “Right now, we’re at a point where dispersion really should be unwinding” — into NVIDIA’s earnings — but the semis and NVDA’s ramp kept it bid.
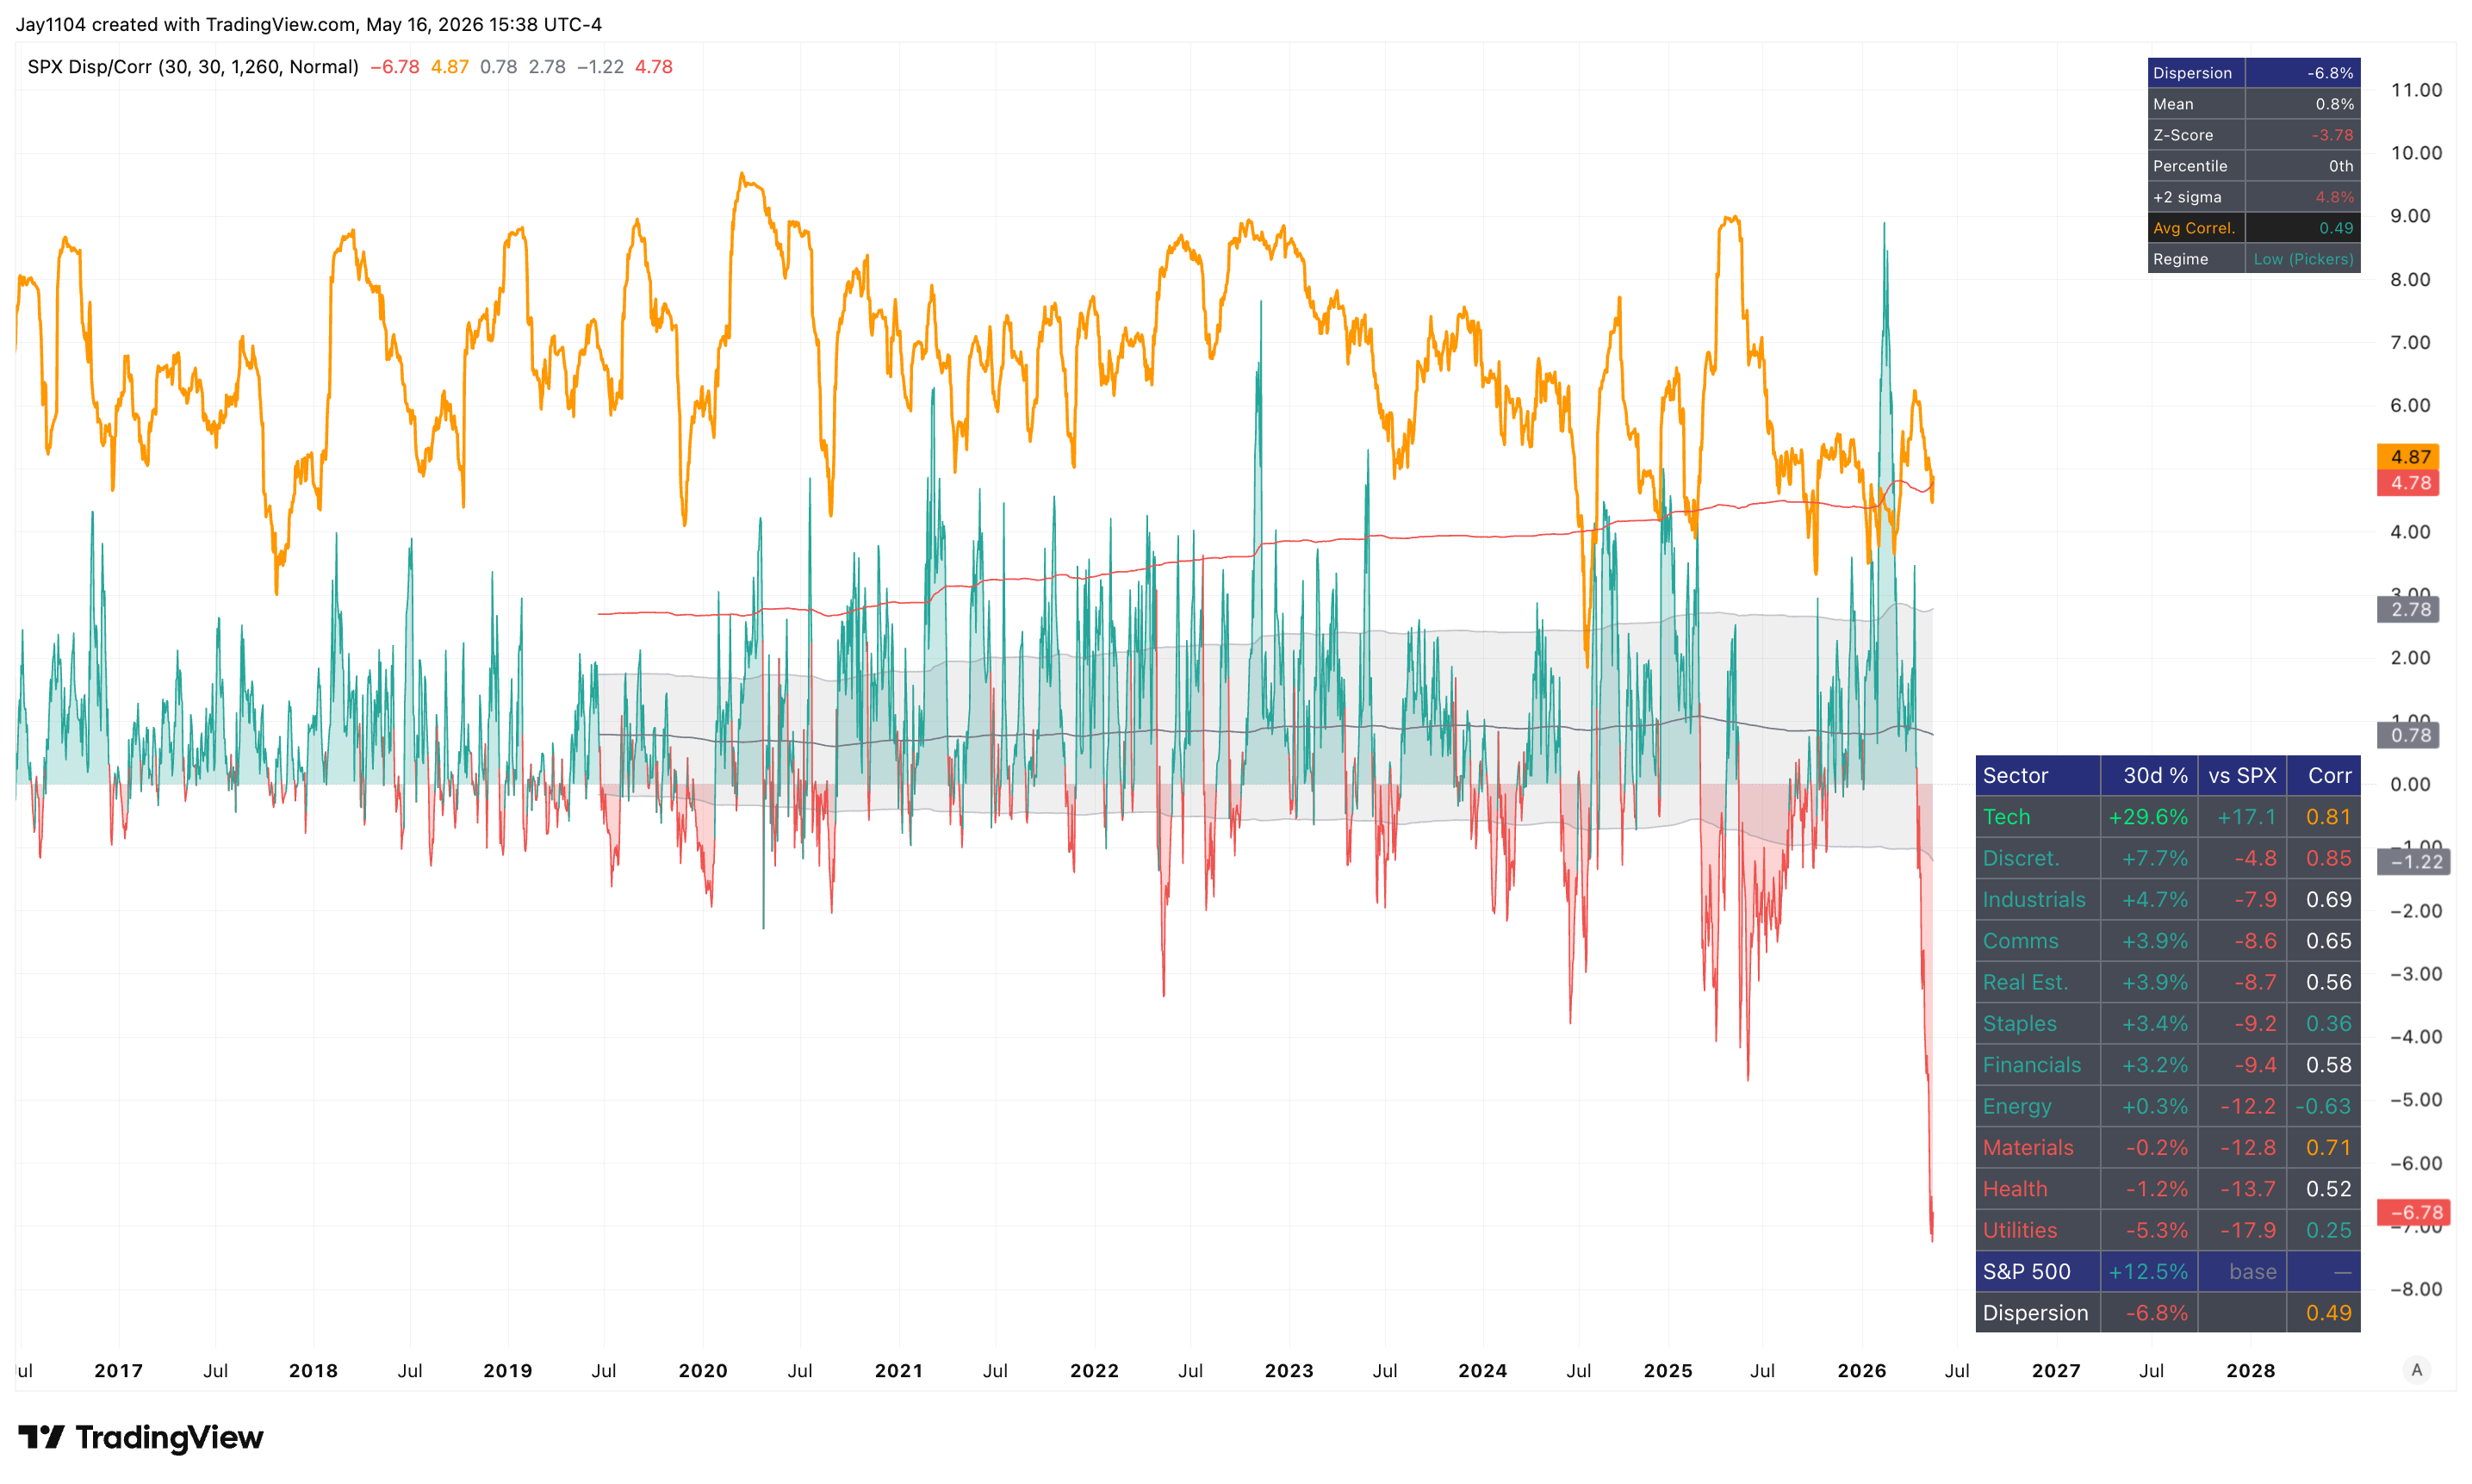
Realized dispersion at a record — “a range we’ve never been before” — Mike’s sector model (each sector vs. the S&P, plus correlation work) is reading realized dispersion at a level outside the historical sample. Tech is +29.6% over the trailing 30 days, +17 percentage points above the S&P. The next-best sector — discretionary — is up only 7.7%, and is actually underperforming the S&P by 4.8 points. “Clearly, the movement in tech has been what’s been leading this market higher.”
What Changed From Last Week
10-year cleared the 4.45% area and closed Friday at 4.60 — last weekend the 10-year was testing the multi-year downtrend at 4.45 with 5% as the upside reference. Friday’s move of +11 bps to 4.60 took out the level. Next zone the 4.80s. Levels: 4.45 cleared → 4.60 close → 4.80s.
30-year eked above the October 19, 2023 closing high — last weekend the 30-year wasn’t yet at the closing-high level. Friday’s close at 5.12% just edged above the prior closing high of 5.115%. Levels: 30Y 5.12 close above Oct 19 close 5.115.
DXY at 100/101 unresolved, but now with oil owing a catch-up move — last weekend’s framing flagged 100/101 as the dollar inflection. Still unresolved. New this week: oil has moved up faster than the dollar, so the relationship is owed a catch-up. If oil keeps moving up, the dollar moves up alongside it. Levels: 100 / 101.
The first “raise rates” Fed comment landed — Wednesday’s session brought the first governor (Collins) to say hikes may need to be on the table. Equities didn’t price it; the forward curve and December 2027 Fed funds did.
Catalysts Ahead
Tuesday May 19 — ~$39B Treasury settlement drain — the first of this coming week’s two drains.
Thursday May 21 — ~$17B bill drain — the second.
Wednesday May 20 — NVIDIA earnings — the mega-cap event-vol anchor; the option-positioning unwind likely follows the print.
Japan CPI later this week — the next of the hot-inflation prints lined up against the global rate selloff.
Views Evolved This Week

The decomposition that defined last weekend’s bet broke. Real yields had been falling and inflation expectations rising while nominal yields sat sideways — the cleanest read that the bond market was pricing the Fed to look through. By Friday, all three were moving up together. That’s a different regime.
The drain calendar’s first test transmitted unevenly. Tuesday’s drain played out cleanly into the tape; Thursday’s didn’t transmit at all. What matters forward is the next drain, not the last one.
The narrow tape held all week with no broad-market confirmation underneath. Tech leadership by a margin without historical comparison; breadth, financials, and small-caps refused to follow.
Commentary
Transcript Edited by Claude (Can Make Mistakes)
A Regime Shift Setting Up On Three Fronts
Last week, markets continued to rally — although Friday we did give some back. This week is going to be potentially pivotal because it’s setting up for a regime shift.
One of the major reasons we could see a change in trend overall has to do with the fact that you’re going to start seeing Treasury bills drained out of the marketplace again. We went through a period where the Treasury was basically injecting liquidity into the market, which had to do with the timing of tax season. The TGA ramped up following the fifteenth — going into the fifteenth, the Treasury was allowing more bills to mature than what they were issuing, and this was a pay-down adding liquidity to the market.
You can see that liquidity that came in just by watching SOFR. SOFR came all the way down to 3.56 from Thursday’s action — Friday’s print lands at 8am Monday morning. As long as this number stays low, it’s an indication of ample liquidity. There’s almost an imbalance between supply and demand for collateral — more cash than collateral. When the rate begins to go up, it means there’s not enough cash. So if SOFR moves higher alongside the Treasury re-issuing bills, that’s the sign the regime shift is happening.
This week we’re looking for about $39 billion to drain on Tuesday and about $17 billion to drain on Thursday.
Oil — Brent’s Symmetrical Triangle, And The Levels That Matter
It’s not just the liquidity picture where we’re seeing a major shift. Oil is doing it too. Using Brent: we had a falling wedge that broke out to the upside, and we’ve been consolidating in a range. It looks like we’ve formed a symmetrical triangle, and we may be breaking out of that. If Brent gets over the 110 area, and maybe even pushes above 113, we could be off for quite a run higher.
That’s going to feed through to interest rates moving up.
Rates — 10-Year At 4.60, 30-Year Eking Above October’s Close, 2-Year Through 4.07
The 10-year made a really big move on Friday, rising by 11 basis points to 4.60. This is an important level because we’ve been in a multi-year consolidation range basically going back to 2023. We broke the first trend line. We’re breaking the second trend line. We’ve broken a support/resistance level around 4.42. The next area at 4.60 is critical. After that, we’re talking about moving into the 4.80s, which could be the start of a bigger move higher.
When you look at the 30-year, that closed at 5.12. It looks like the 5.12 level may have just barely taken out the closing high on October nineteenth at 5.115. So we may have just eked above. Either way, the 30-year is moving higher.
The 2-year broke out of an important area around 4.06–4.07, and from a technical basis we could be heading all the way back up to 4.40.
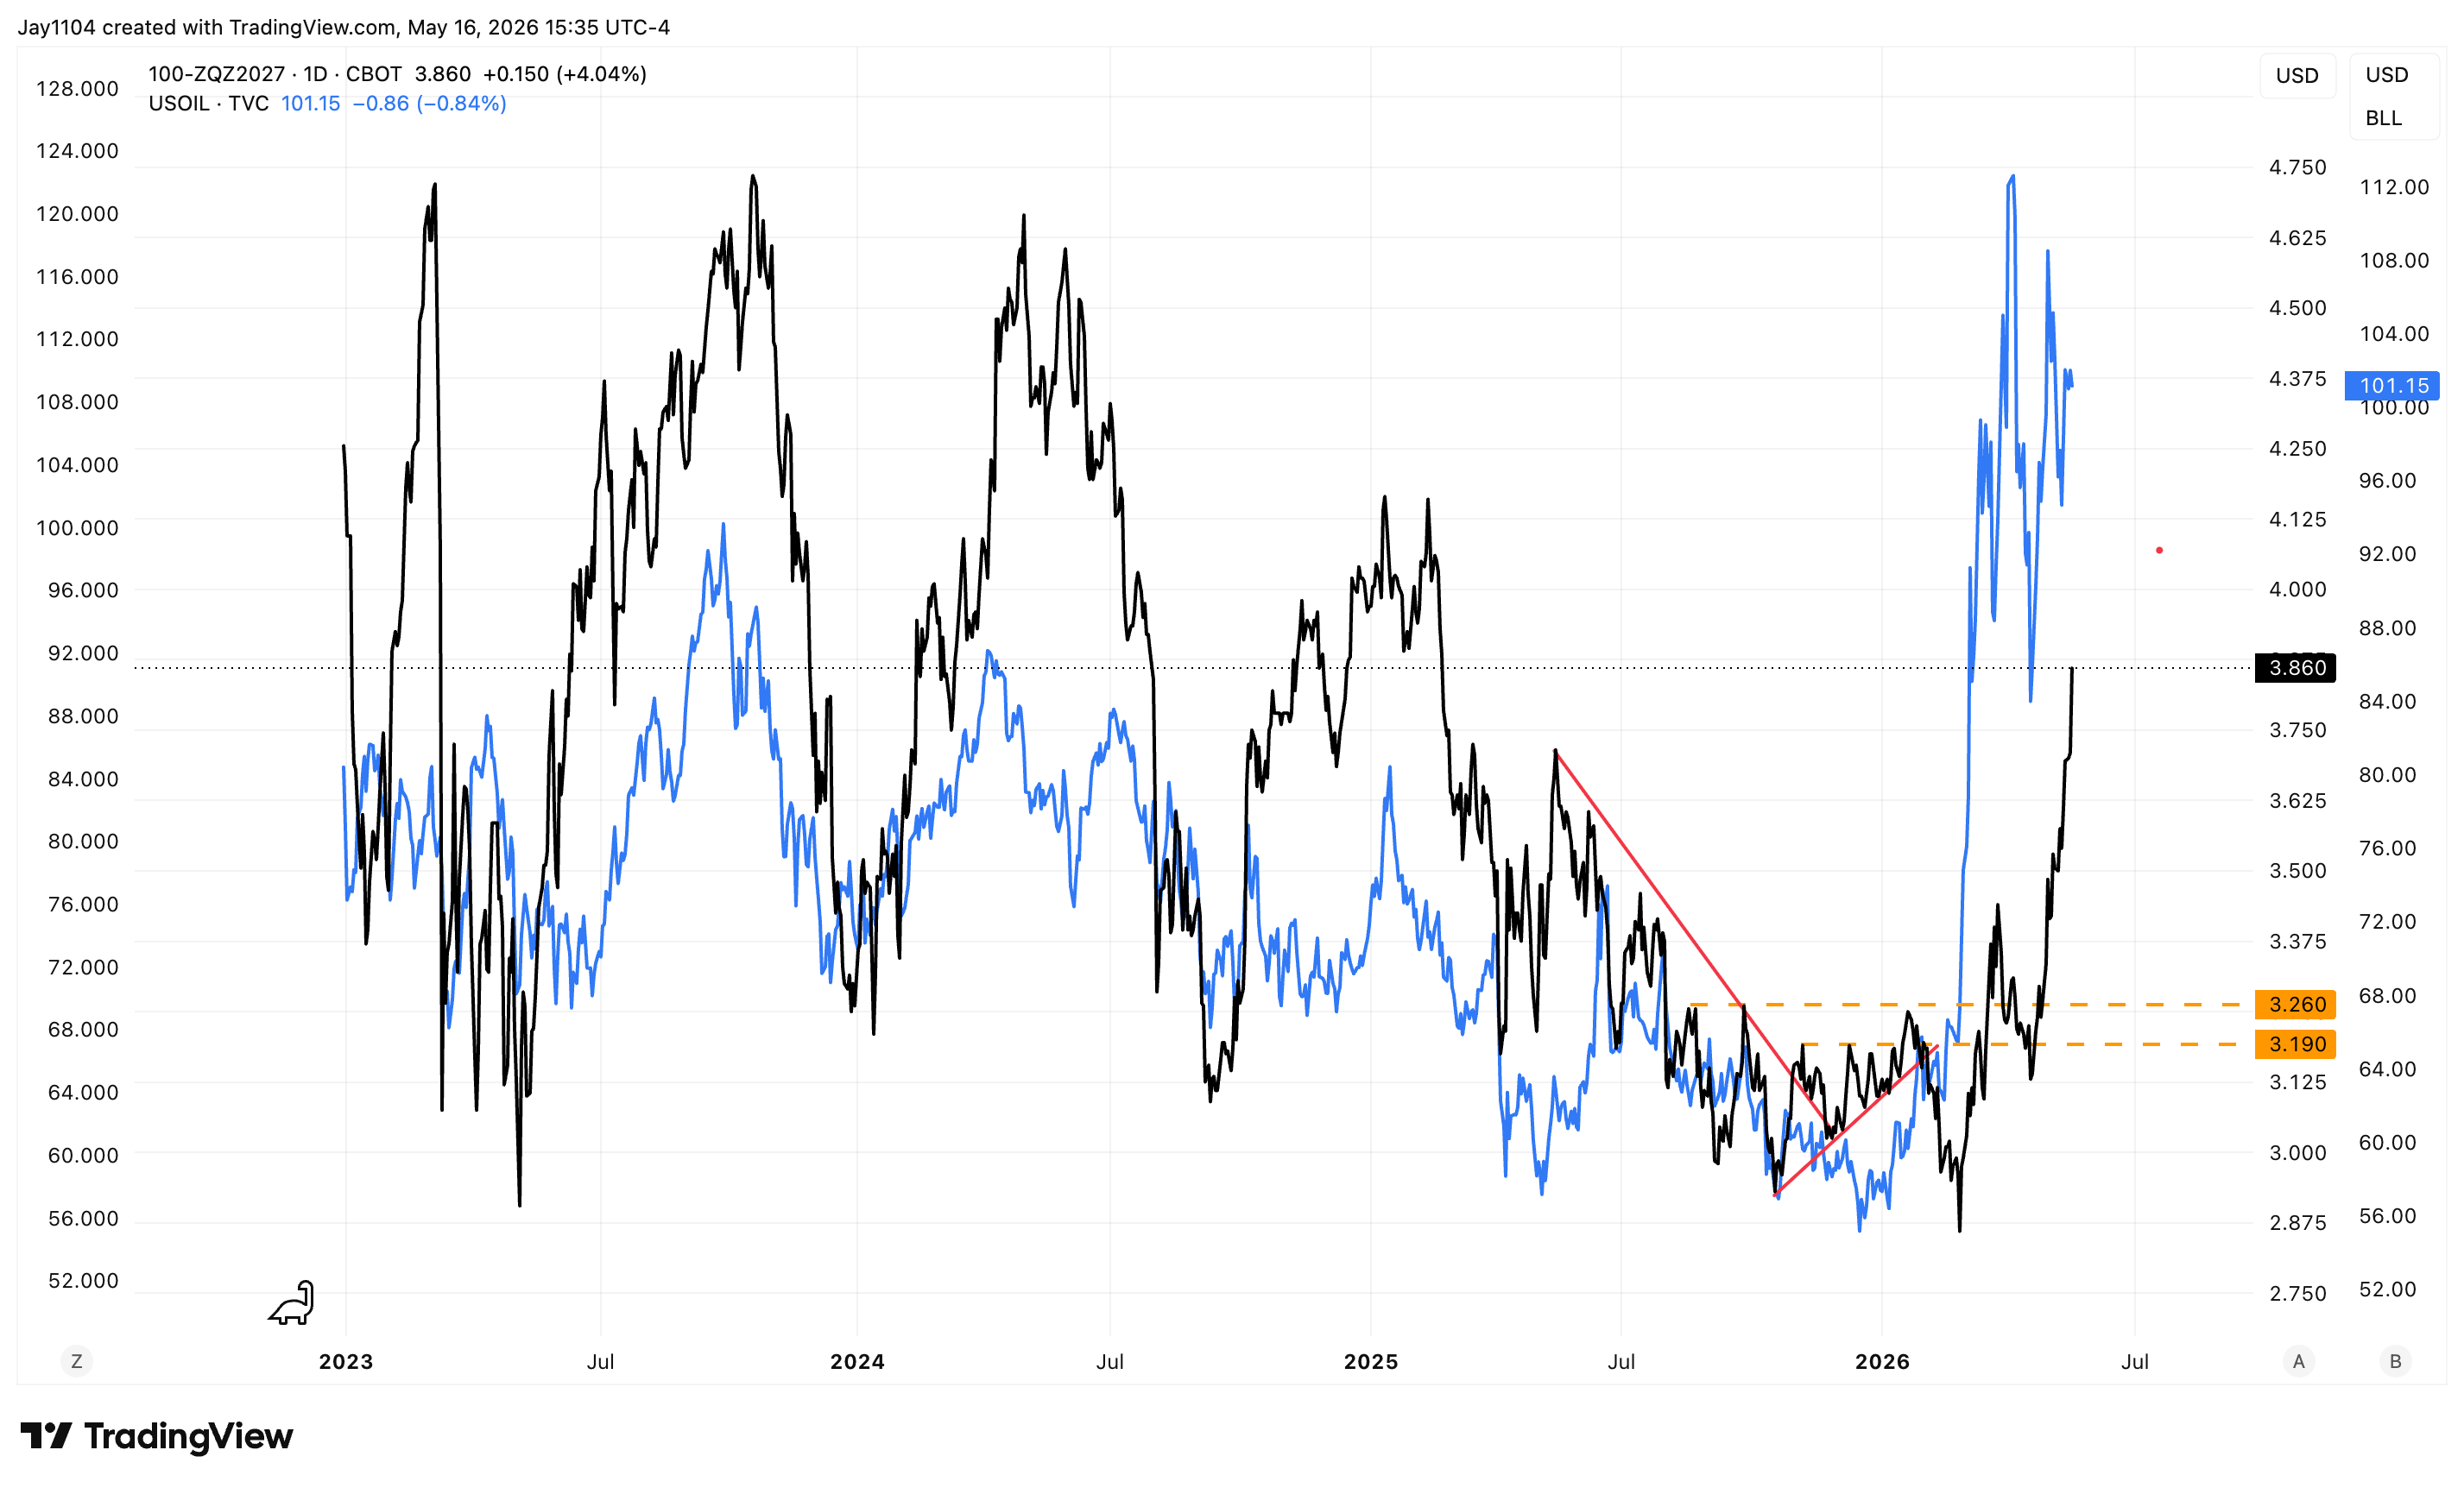
A lot of this has to do with oil. If you just put a chart of WTI over the 2-year, they’ve been following each other very closely. So as long as oil stays up and keeps moving up, you’re going to see upward pressure on interest rates continue. And that’s going to feed into the dollar, because the dollar has been trading right along with oil over the last couple of years. If oil moves up and rates move up, the dollar is going to start moving as well.
This is really important to pay attention to because for the last couple of weeks equity markets kind of got a pass — rates came in, oil came in, dollar came in, they didn’t really make a move. Now all of a sudden they’re moving again. Maybe because they’re pushing above the previous highs, that’s catching the equity markets’ attention.
Inflation Expectations And Real Yields — Multi-Decade Backdrop
We had a lot of hot inflation prints this week in the US and in Japan even. The 5-year inflation swap is trading up near 2.70. The 10-year inflation swap is around 2.50.
Because nominal rates are now rising faster than inflation rates, you’re seeing real yields move up too. The 10-year real yield is at 2.07. It hasn’t been there more recently — but if it starts moving toward the 2.20 area, that might catch more people’s attention.
The 30-year real yield already eclipsed the high established back in May of 2025. The last time we were here was basically 2007 and 2008. For anything sustained higher than where we are right now, you have to go back to 2003. The 2008 print was during the financial crisis — strange things were going on, so hard to say exactly what was driving the reading. But ex-that anomaly, this is really the last time you had a sustained real yield on the 30-year above where it is right now. We know that wasn’t a particularly good time for the stock market.
When you look at the 3-month Treasury 12-month forward minus the 3-month Treasury spot, the spread is about 38 basis points. The market’s going through the stage of pricing in interest rate hikes. And when this all comes down to it, it really has to do with oil prices.
Even when you go out and look at December 2027 Fed funds futures, we’re up to 3.86 — so the market’s now pricing in a potential rate hike in 2027. This is pretty much just trading with oil. What was the driving force of the disinflation we were seeing the last few years? It’s been oil. Core PCE has been pretty much stuck at three percent for a really long time. That was one of the fears I had going back to 2022 — that core PCE was going to get stuck in the three to three and a half percent range. That played out. If oil is no longer the disinflationary force, then inflation is going to go back up, and the market is going to have to reprice rate cuts as hikes.
Bitcoin As The Liquidity Gauge
I like to use Bitcoin as a proxy for what’s happening in liquidity — it ties everything together. At the end of the day, I don’t know how to value Bitcoin other than as a liquidity gauge, a financial-conditions gauge. If you continue to see Bitcoin decline, that’s the best indication we have of the potential tightening liquidity picture and financial conditions tightening. If the move in Bitcoin continues to deteriorate, I think that feeds into equity prices.
Volume And The Option-Positioning Squeeze
The volume in SPY has just about vanished over the last couple of weeks. Friday was probably the strongest volume day we’ve had in quite a while. A lot of what we’ve been seeing in the marketplace has to do with option positioning. The VIX has flattened out around 17. When you compare it to VIXEQ — the constituent volatility index — that has tended to move higher.
What does that tell us? Index-level vol has come down, but average single-stock implied vol has not. We’ve actually seen it go back up. That’s a unique dynamic. On the surface, you still have dispersion going on. You can see it in the DSPX — as of Wednesday, that was still trading at a high. With NVIDIA’s results coming, this trade really should be unwinding. It unwound a little bit, but then the semis got hot and NVIDIA started to ramp up, and dispersion went right back in.
Right now we’re at a point where dispersion really should be unwinding and constituent IV should be coming down. Implied vol on the constituent level is extremely high right now by historical standards, especially when you consider that this isn’t COVID. The market’s not behaving like COVID. The market’s not behaving like the tariff tantrum. You’re not seeing the big drawdowns we saw in 2022 and parts of 2023. Right now the market is basically at an all-time high, and you have implied vol on the constituent level trading near the upper end of a historical range. Dispersion is also trading really up at the historical end of the range.
Realized Dispersion — A Range We’ve Never Been Before
I built a little model that tracks the sectors in the S&P 500 — performance of each sector against the index, then running correlations. It’s basically a measure of realized dispersion. What we can see is that we’re in a range we’ve never really been before.
Tech has outperformed the S&P 500 by 17 percentage points over the last 30 days. It’s up 29.6%. The next sector that’s up anywhere close is discretionary, and it’s only up 7.7% — and discretionary is actually underperforming the S&P by 4.8%. There’s a high level of correlation between tech and the other sectors, but clearly the movement in tech has been what’s been leading this market higher.
Three Drivers — And They’re All Set To Reverse
Three things have really been the driver here:
You’ve had excess liquidity in the market due to Treasury bill pay-downs — which should be reversing.
We’ve seen oil prices stay pretty contained, which has allowed rates to stay contained and the dollar to stay contained. That started to show signs of really cracking on Friday, especially following the hot reports here in the US — the hot PPI report. Japan has a CPI report coming up later this week, which will also be important.
And you’ve had basically a giant squeeze in option positioning in the market — evident in volatility metrics and in the dispersion between technology and everything else.
Those three things are largely due to reverse with Treasury bill issuance kicking back up, inflation reports confirming what the markets feared at the beginning, and NVIDIA’s earnings likely to result in the unwinding of a lot of the squeeze we’ve seen in technology names — especially semiconductors — since March thirtieth.
Hope you found this helpful. We’ll see you next week.
Defined Terms
TGA (Treasury General Account) — The Treasury’s operating cash account at the Federal Reserve. When the TGA falls, cash is added to the financial system; when it rises, cash is drained.
SOFR (Secured Overnight Financing Rate) — A broad measure of the cost of borrowing cash overnight collateralized by Treasury securities. The dominant USD funding benchmark. A low SOFR reads as excess cash in the system; a rising SOFR reads as tightening conditions.
Net Treasury Settlement / Drain / Pay-down — On settlement days, new bills issued in excess of bills paid down remove cash from the system (a “drain”). On pay-down days, the reverse — bills maturing in excess of new issuance add cash.
Falling Wedge / Symmetrical Triangle — Technical chart patterns. A falling wedge is a downward-sloping consolidation that typically resolves higher; a symmetrical triangle is a contraction with both an upper and lower trend line that can resolve in either direction.
TIPS / Real Yield — Treasury Inflation-Protected Securities. The TIPS yield is the “real” yield — the nominal yield minus expected inflation. A rising real yield means nominal yields are outpacing inflation expectations.
Inflation Swap (5Y / 10Y) — A derivative that fixes a market-implied inflation rate for a given horizon. Tracks expectations for CPI over that tenor.
3-Month Treasury 12-Month Forward — The market-implied yield on a 3-month Treasury bill 12 months from now. When it trades above the 3-month spot, the market is pricing higher policy rates ahead.
Fed Funds Futures — Listed futures that price the expected level of the federal funds rate at specific future dates. The market uses them to gauge the implied path of Fed policy.
Core PCE (Personal Consumption Expenditures, ex food & energy) — The Fed’s preferred inflation gauge. The BEA’s monthly measure stripping out the most volatile components.
DSPX / VIX EQ — DSPX is the CBOE S&P 500 Dispersion Index — a measure of expected dispersion across S&P 500 constituents. VIXEQ is the constituent-volatility index — average implied volatility across single-name S&P 500 components. Index vol falling while constituent vol rises is a classic dispersion-up signal.
Realized Dispersion — The actually-observed (rather than implied) dispersion of returns across S&P 500 sectors or constituents; measured by sector-vs-index performance and pairwise correlation.
Disclaimer
This report contains independent commentary to be used for informational and educational purposes only. Michael Kramer is a member and investment adviser representative with Mott Capital Management. Mr. Kramer is not affiliated with this company and does not serve on the board of any related company that issued this stock. All opinions and analyses presented by Michael Kramer in this analysis or market report are solely Michael Kramer’s views. Readers should not treat any opinion, viewpoint, or prediction expressed by Michael Kramer as a specific solicitation or recommendation to buy or sell a particular security or follow a particular strategy. Michael Kramer’s analyses are based upon information and independent research that he considers reliable, but neither Michael Kramer nor Mott Capital Management guarantees its completeness or accuracy, and it should not be relied upon as such. Michael Kramer is not under any obligation to update or correct any information presented in his analyses. Mr. Kramer’s statements, guidance, and opinions are subject to change without notice. Past performance is not indicative of future results. Neither Michael Kramer nor Mott Capital Management guarantees any specific outcome or profit. You should be aware of the real risk of loss in following any strategy or investment commentary presented in this analysis. Strategies or investments discussed may fluctuate in price or value. Investments or strategies mentioned in this analysis may not be suitable for you. This material does not consider your particular investment objectives, financial situation, or needs and is not intended as a recommendation appropriate for you. You must make an independent decision regarding investments or strategies in this analysis. Upon request, the advisor will provide a list of all recommendations made during the past twelve months. Before acting on information in this analysis, you should consider whether it is suitable for your circumstances and strongly consider seeking advice from your own financial or investment adviser to determine the suitability of any investment.