
The Market’s Crashing Up While Correlations Hit Their Lowest Since 2024

Educational market commentary. Not investment advice. Not a recommendation. Not a solicitation.
By Michael Kramer, Mott Capital Management
Today’s tape:
Dispersion · Implied correlations · VIXEQ · VXSMH · Micron · Semiconductors · Broadcom · Call-skew froth · 2024 analog
Today’s pivot:
Does Broadcom’s report this week keep semiconductor vol bid — or does it become the catalyst that finally lets the call-froth and the dispersion it’s driving start to unwind?
The big picture:
“The market’s not crashing down. The market’s crashing up.”
Where we are:
All week, we’ve tracked the dispersion-correlations spread refusing to roll over even as the liquidity drain runs underneath. This weekend, the vol structure reached a genuine extreme — three-month correlations at their lowest reading since 2024. What sharpens the arc is the source: it’s now clearly a semiconductor call-froth squeeze, and Broadcom’s report this week is the first real test of whether it holds.
Video
Setup of the Day
With correlations at a multi-decade low and dispersion at crisis-only extremes, the historical pattern is index volatility expanding sharply to catch up to elevated single-stock vol — the move that drags the index lower.
Tape Card
The Read
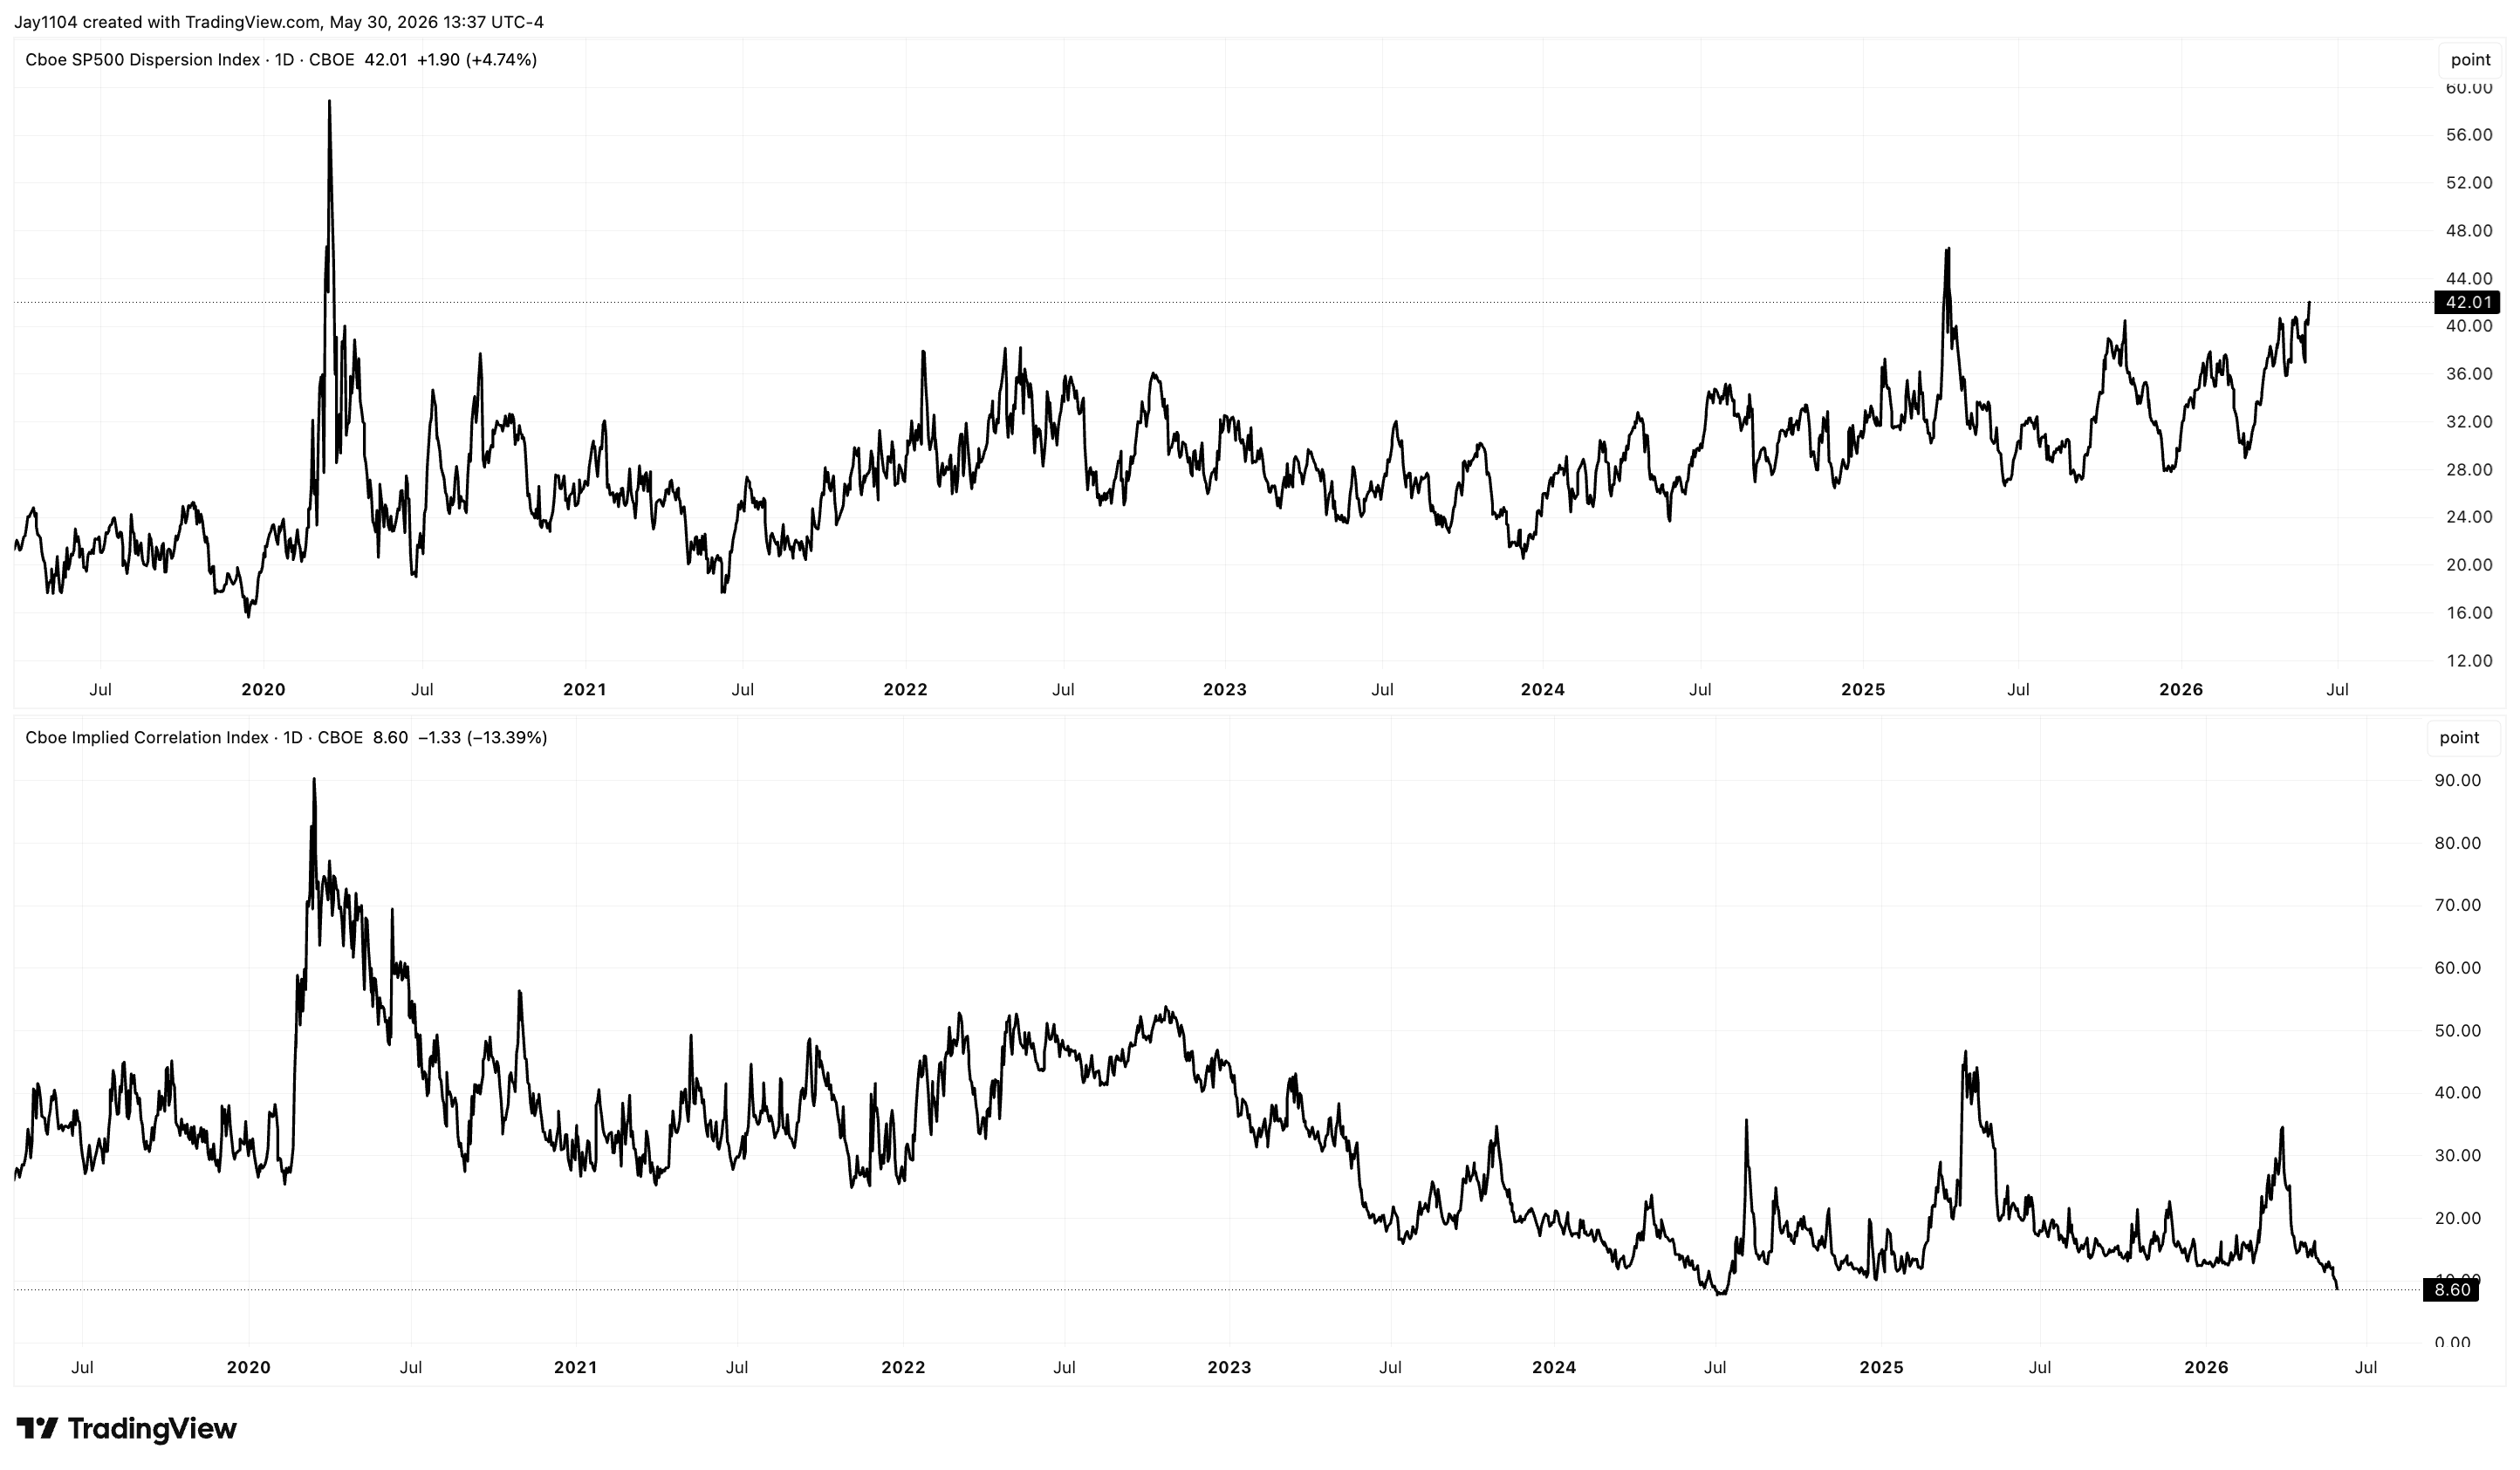
Implied correlations collapsed to 8.6 — the lowest since 2024 — as dispersion surged to crisis-only extremes. Single-stock implied vol is rising while index vol falls; that gap (dispersion) is the mirror image of the correlation drop, and the only other times it’s been this stretched were April 2025 and March 2020. (Dispersion = the gap between single-stock and index-level implied vol; wide dispersion means names trade on their own stories, not together.) Levels: 3M implied correlation 8.6 — lowest since July 2024, none lower since 2024; dispersion prior instances April 2025 / March 2020.
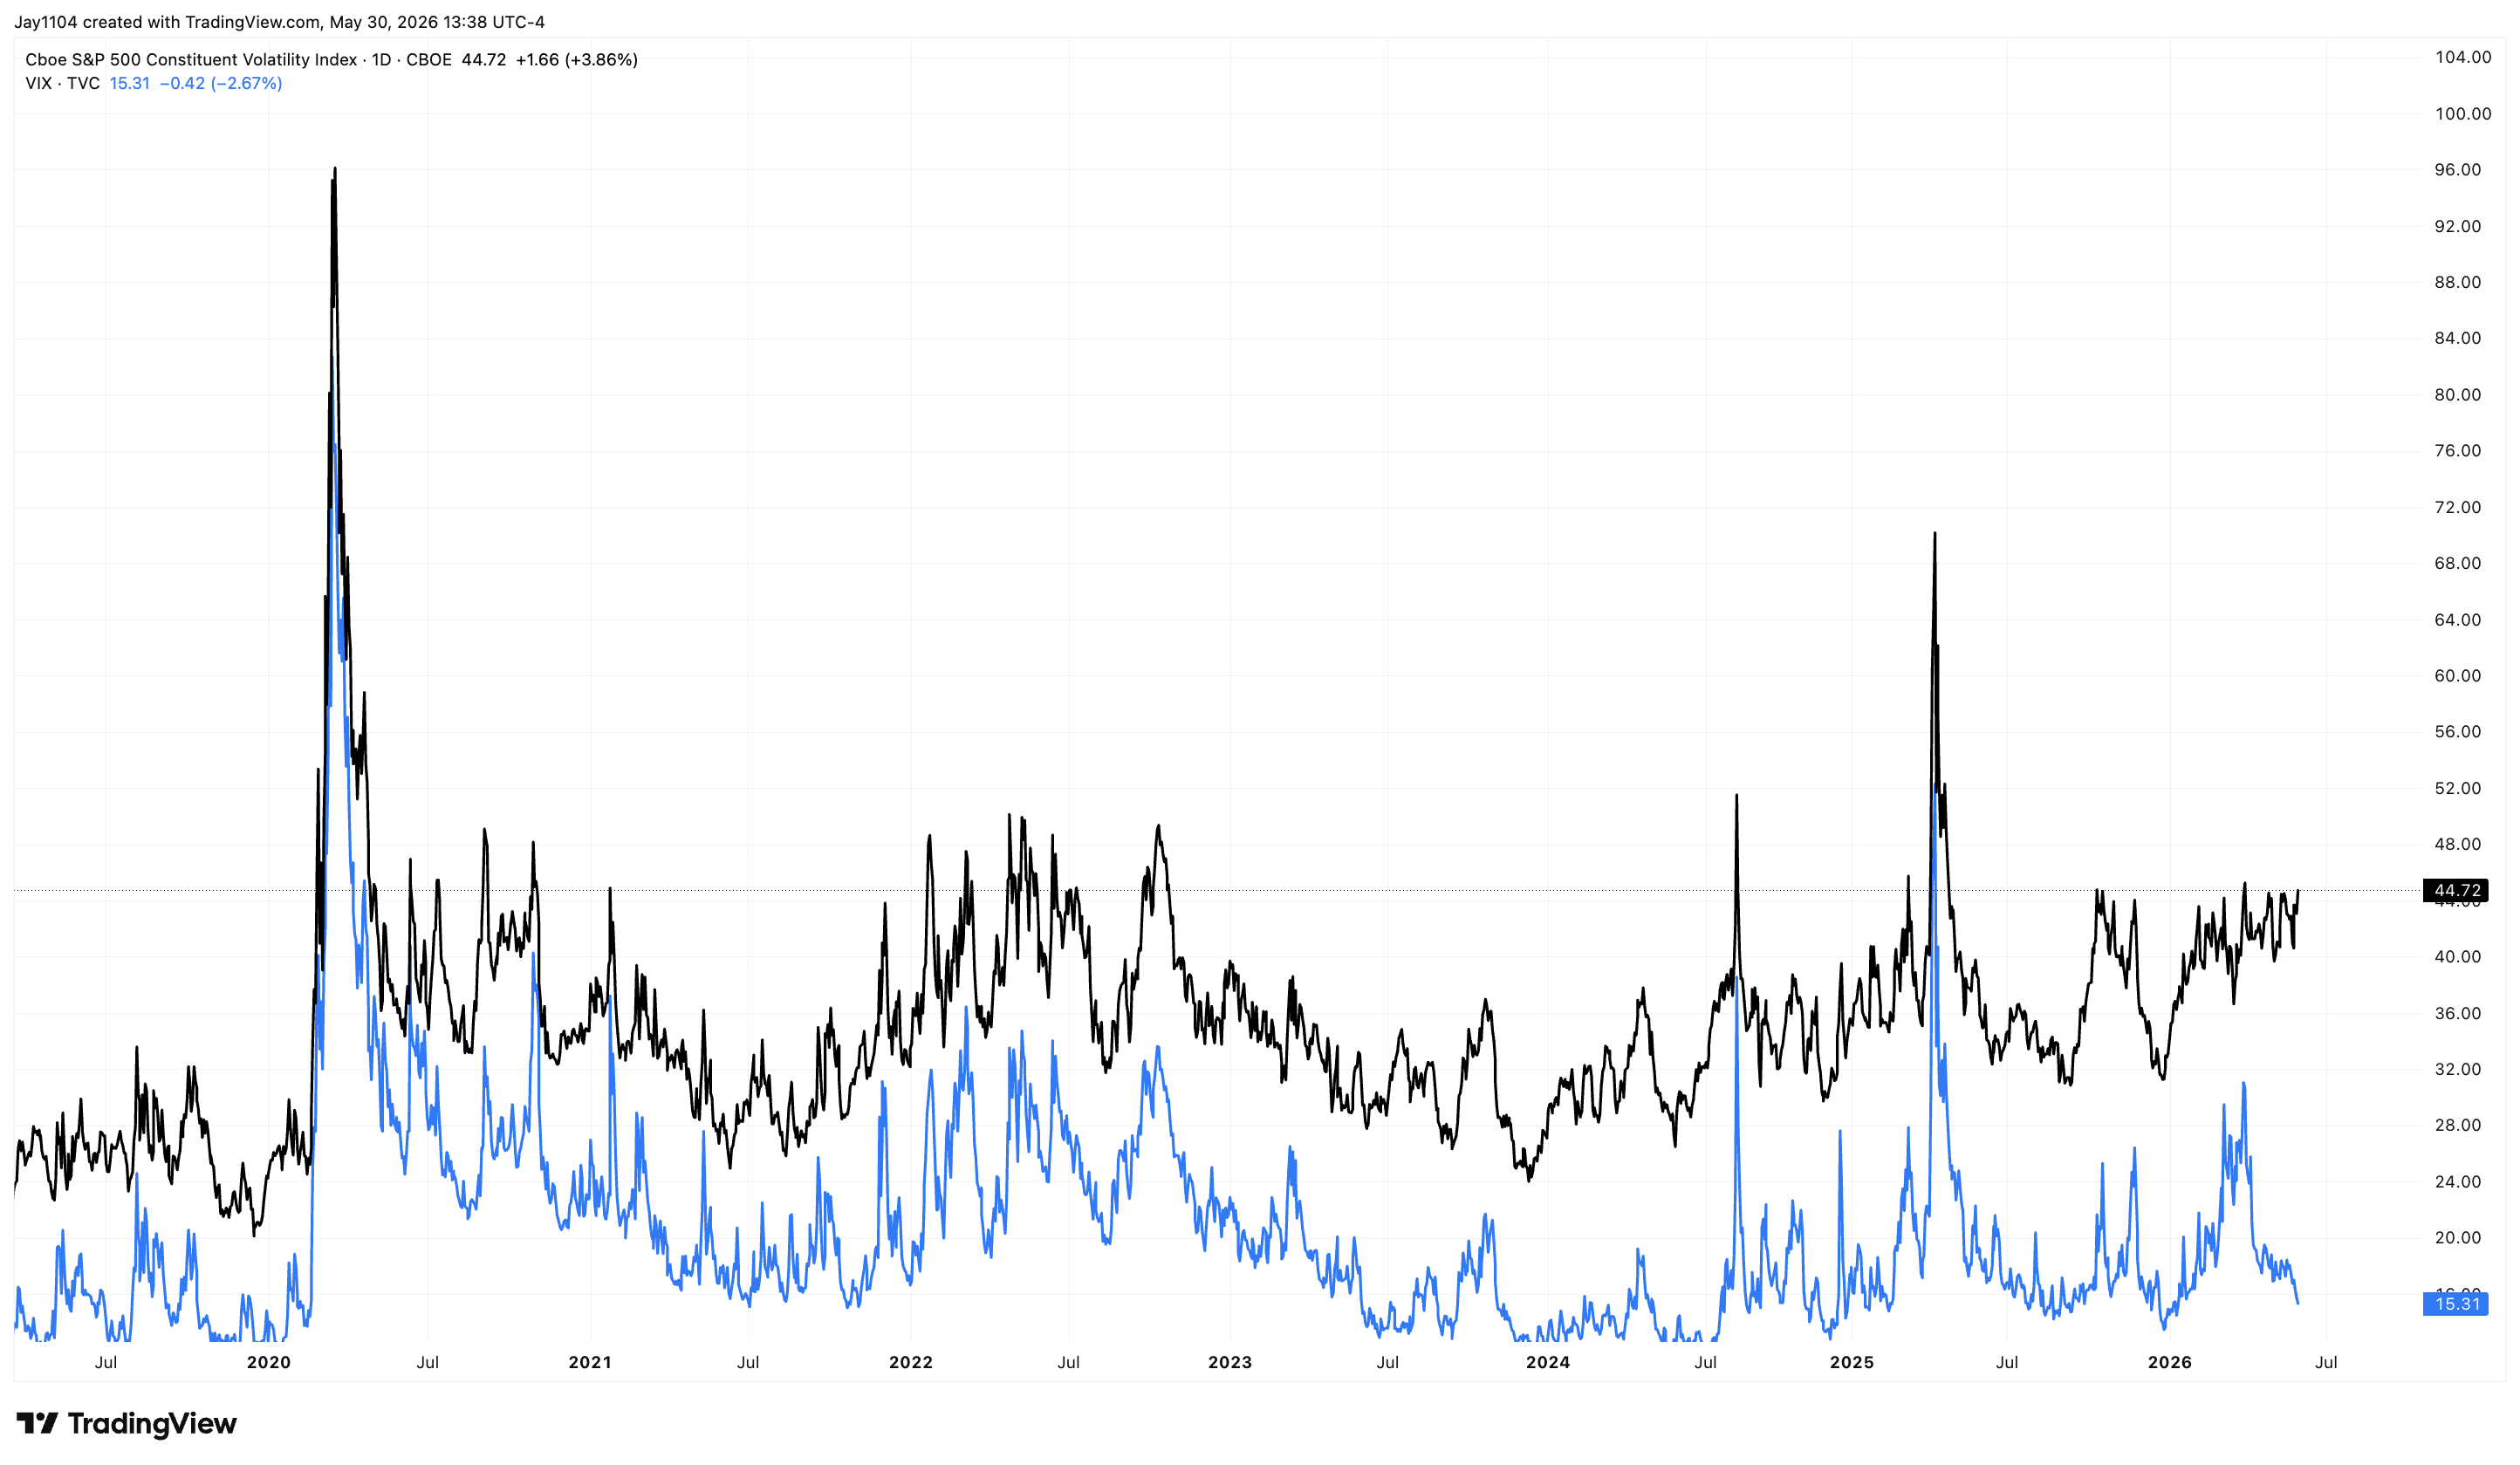
Constituent vol (VIXEQ) ~44.7 while index vol keeps falling — put on the same scale, they diverge, and that divergence is the engine.
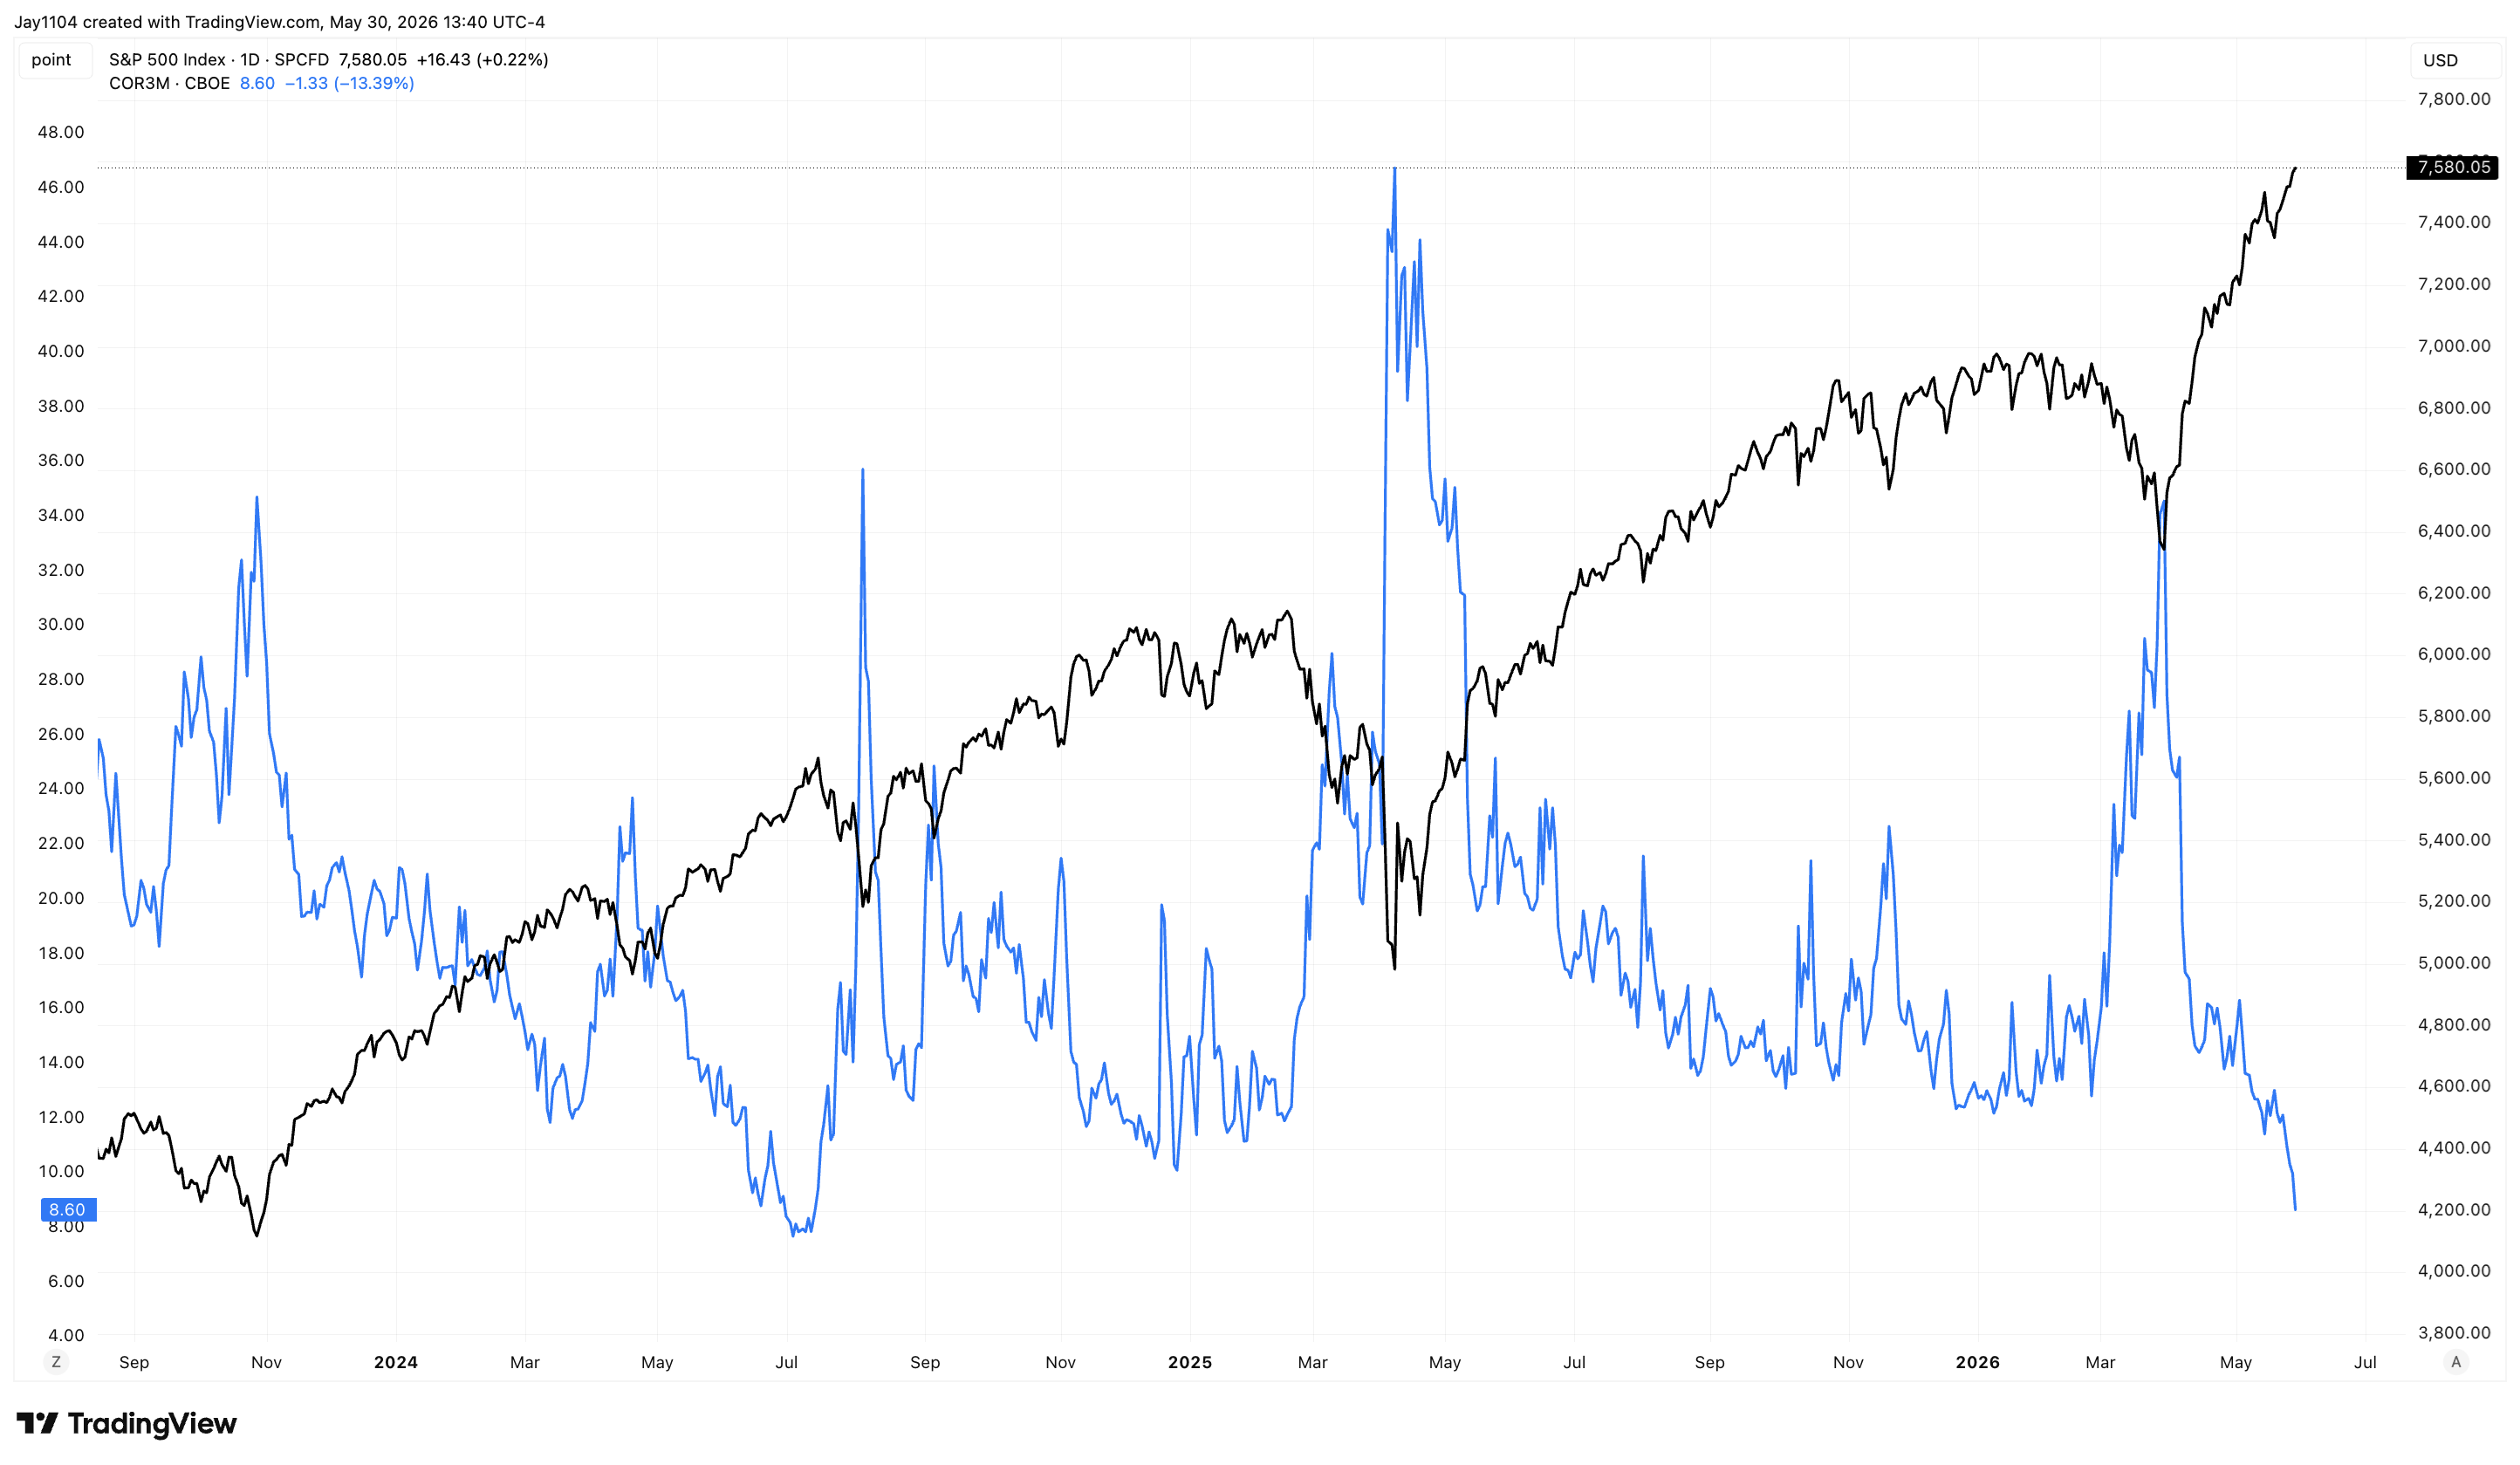
The July 2024 analog and the downside math — last time correlations were this low (July 2024), the S&P fell ~10% / Nasdaq ~16% intraday (Jul 15–Aug 5); two March 2024 compressions preceded 6% and 10.6% declines. Levels: Nasdaq −15% ≈ 25,000; S&P −10% ≈ 6,805.
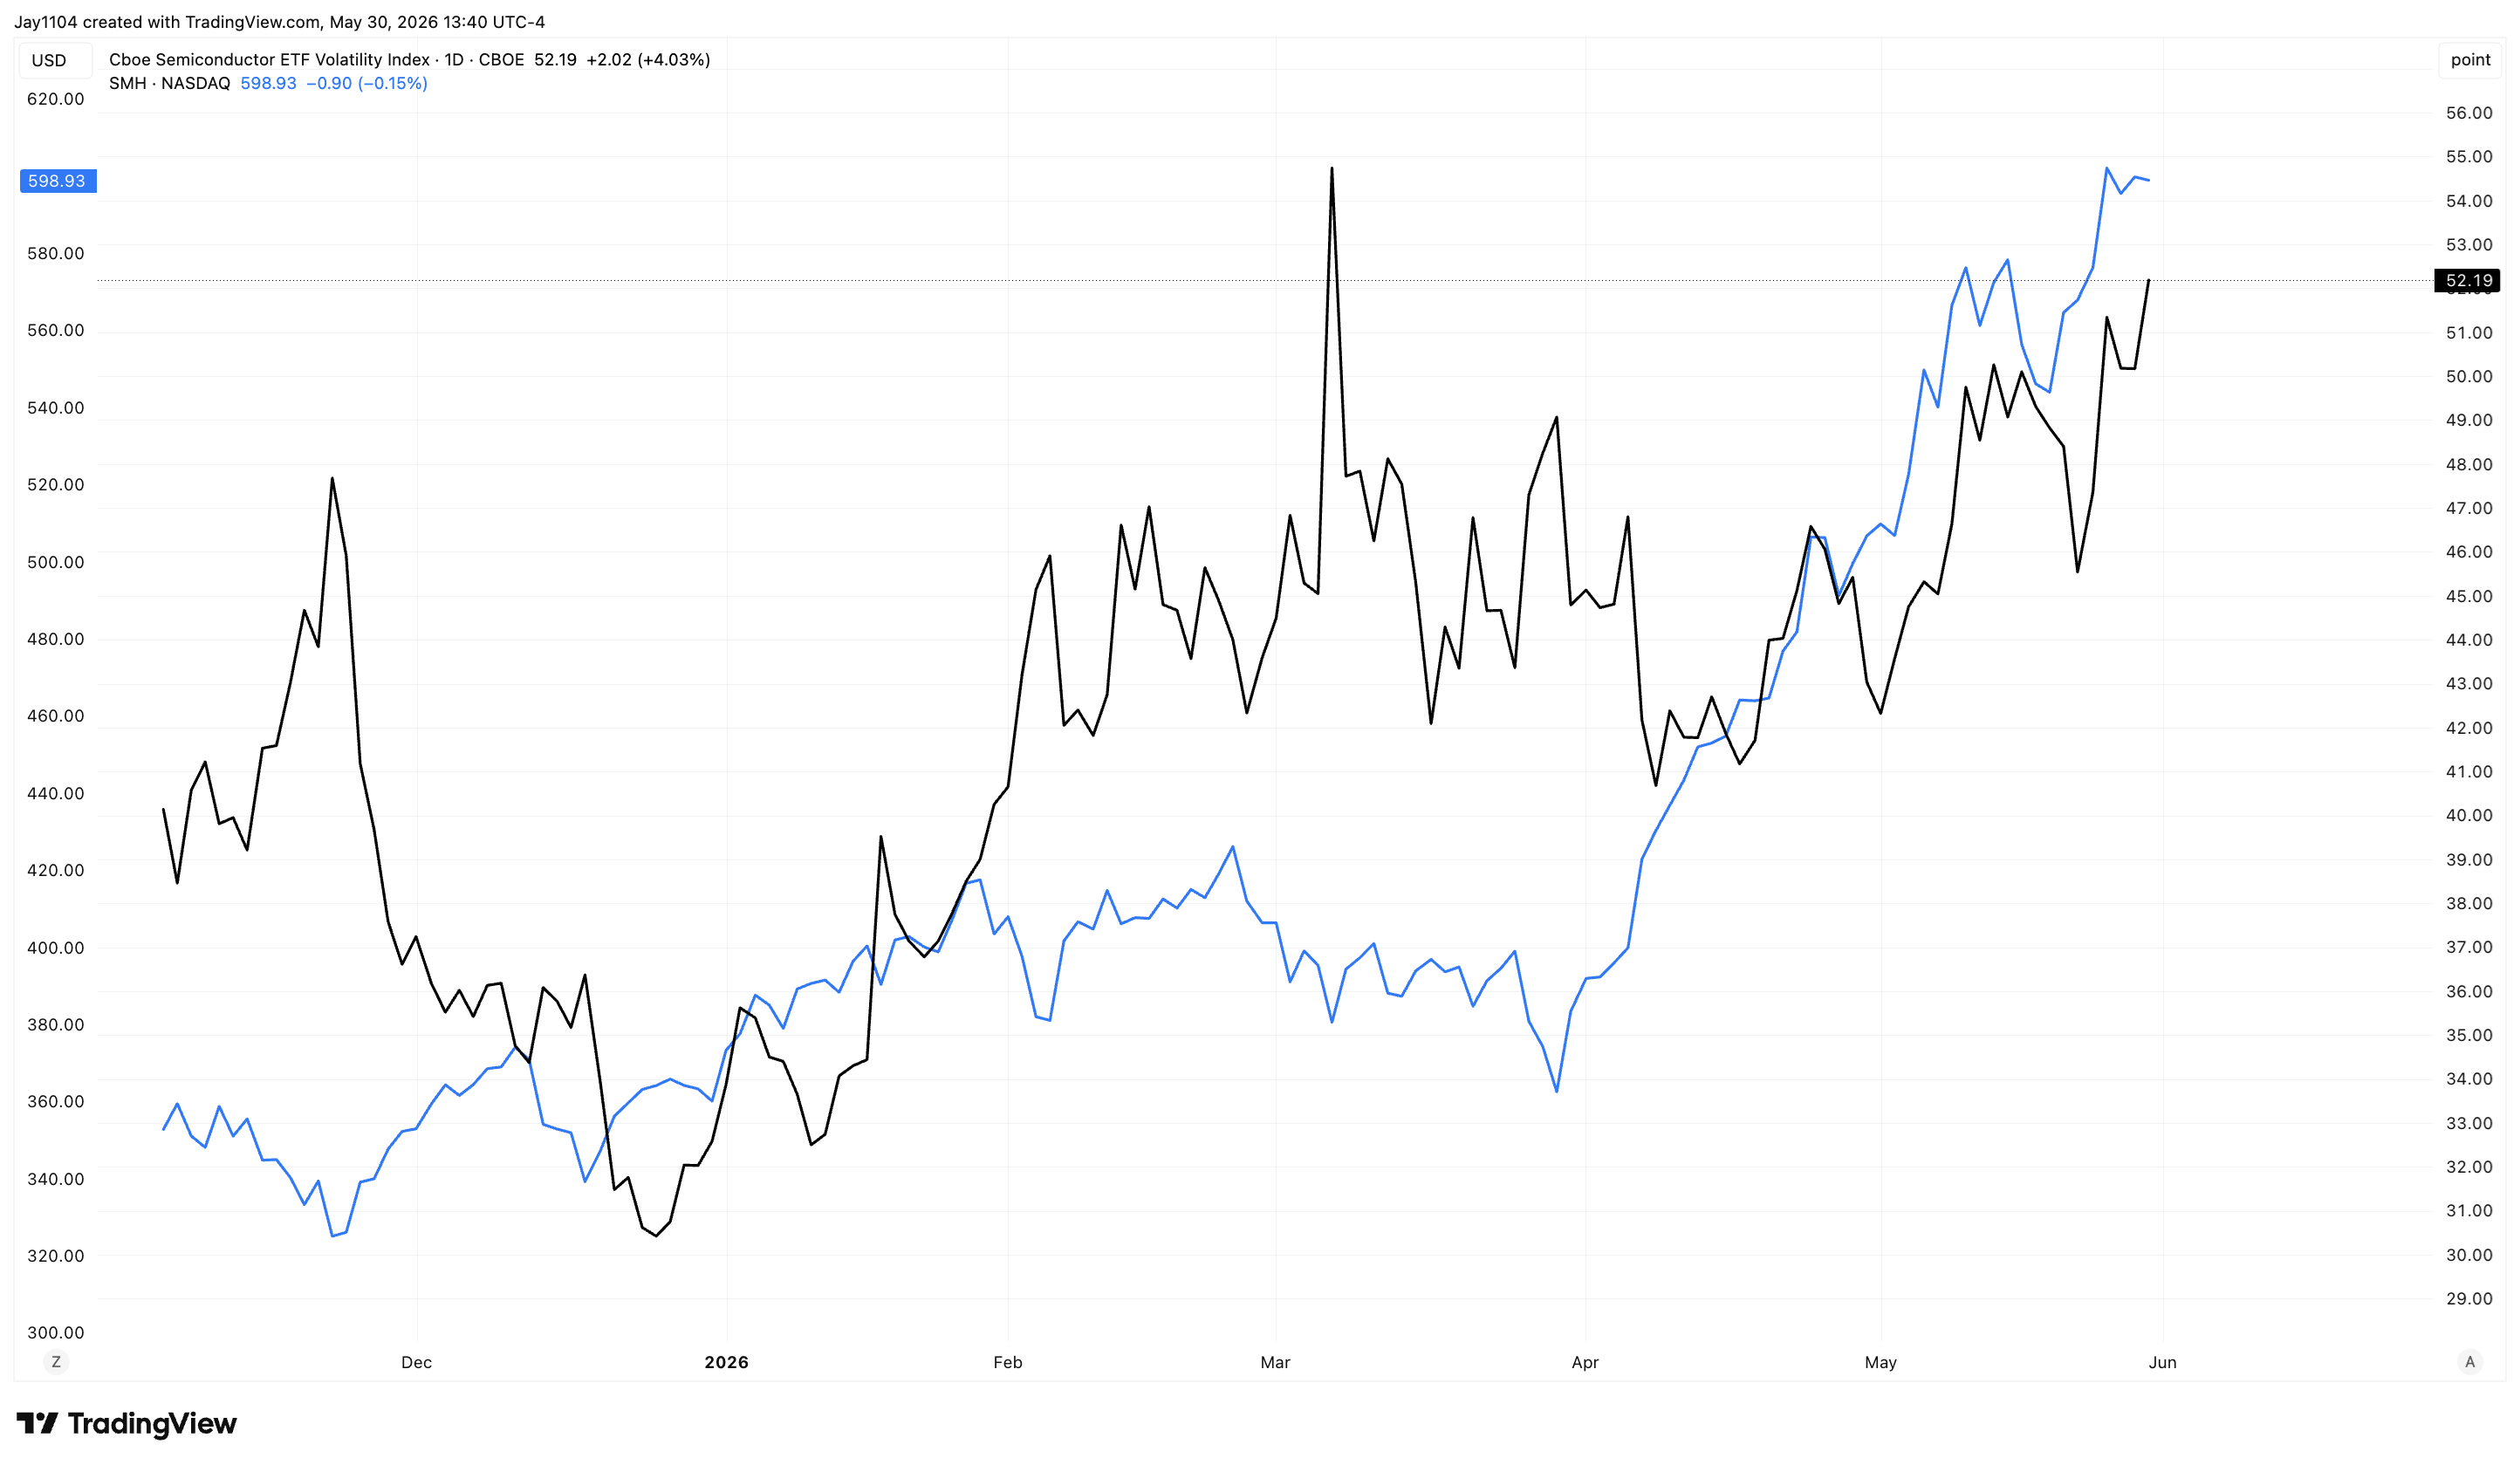
The engine is the semis — VXSMH ~52, rising with implied vol — Micron, AMD, IBM, Qualcomm and Marvell all rising on heavy call volumes, vol climbing alongside price. Ranked by IV and skew, they cluster call-side: calls richer than puts, froth, IV extremely high. Levels: VXSMH ~52 vs. March high ~55.
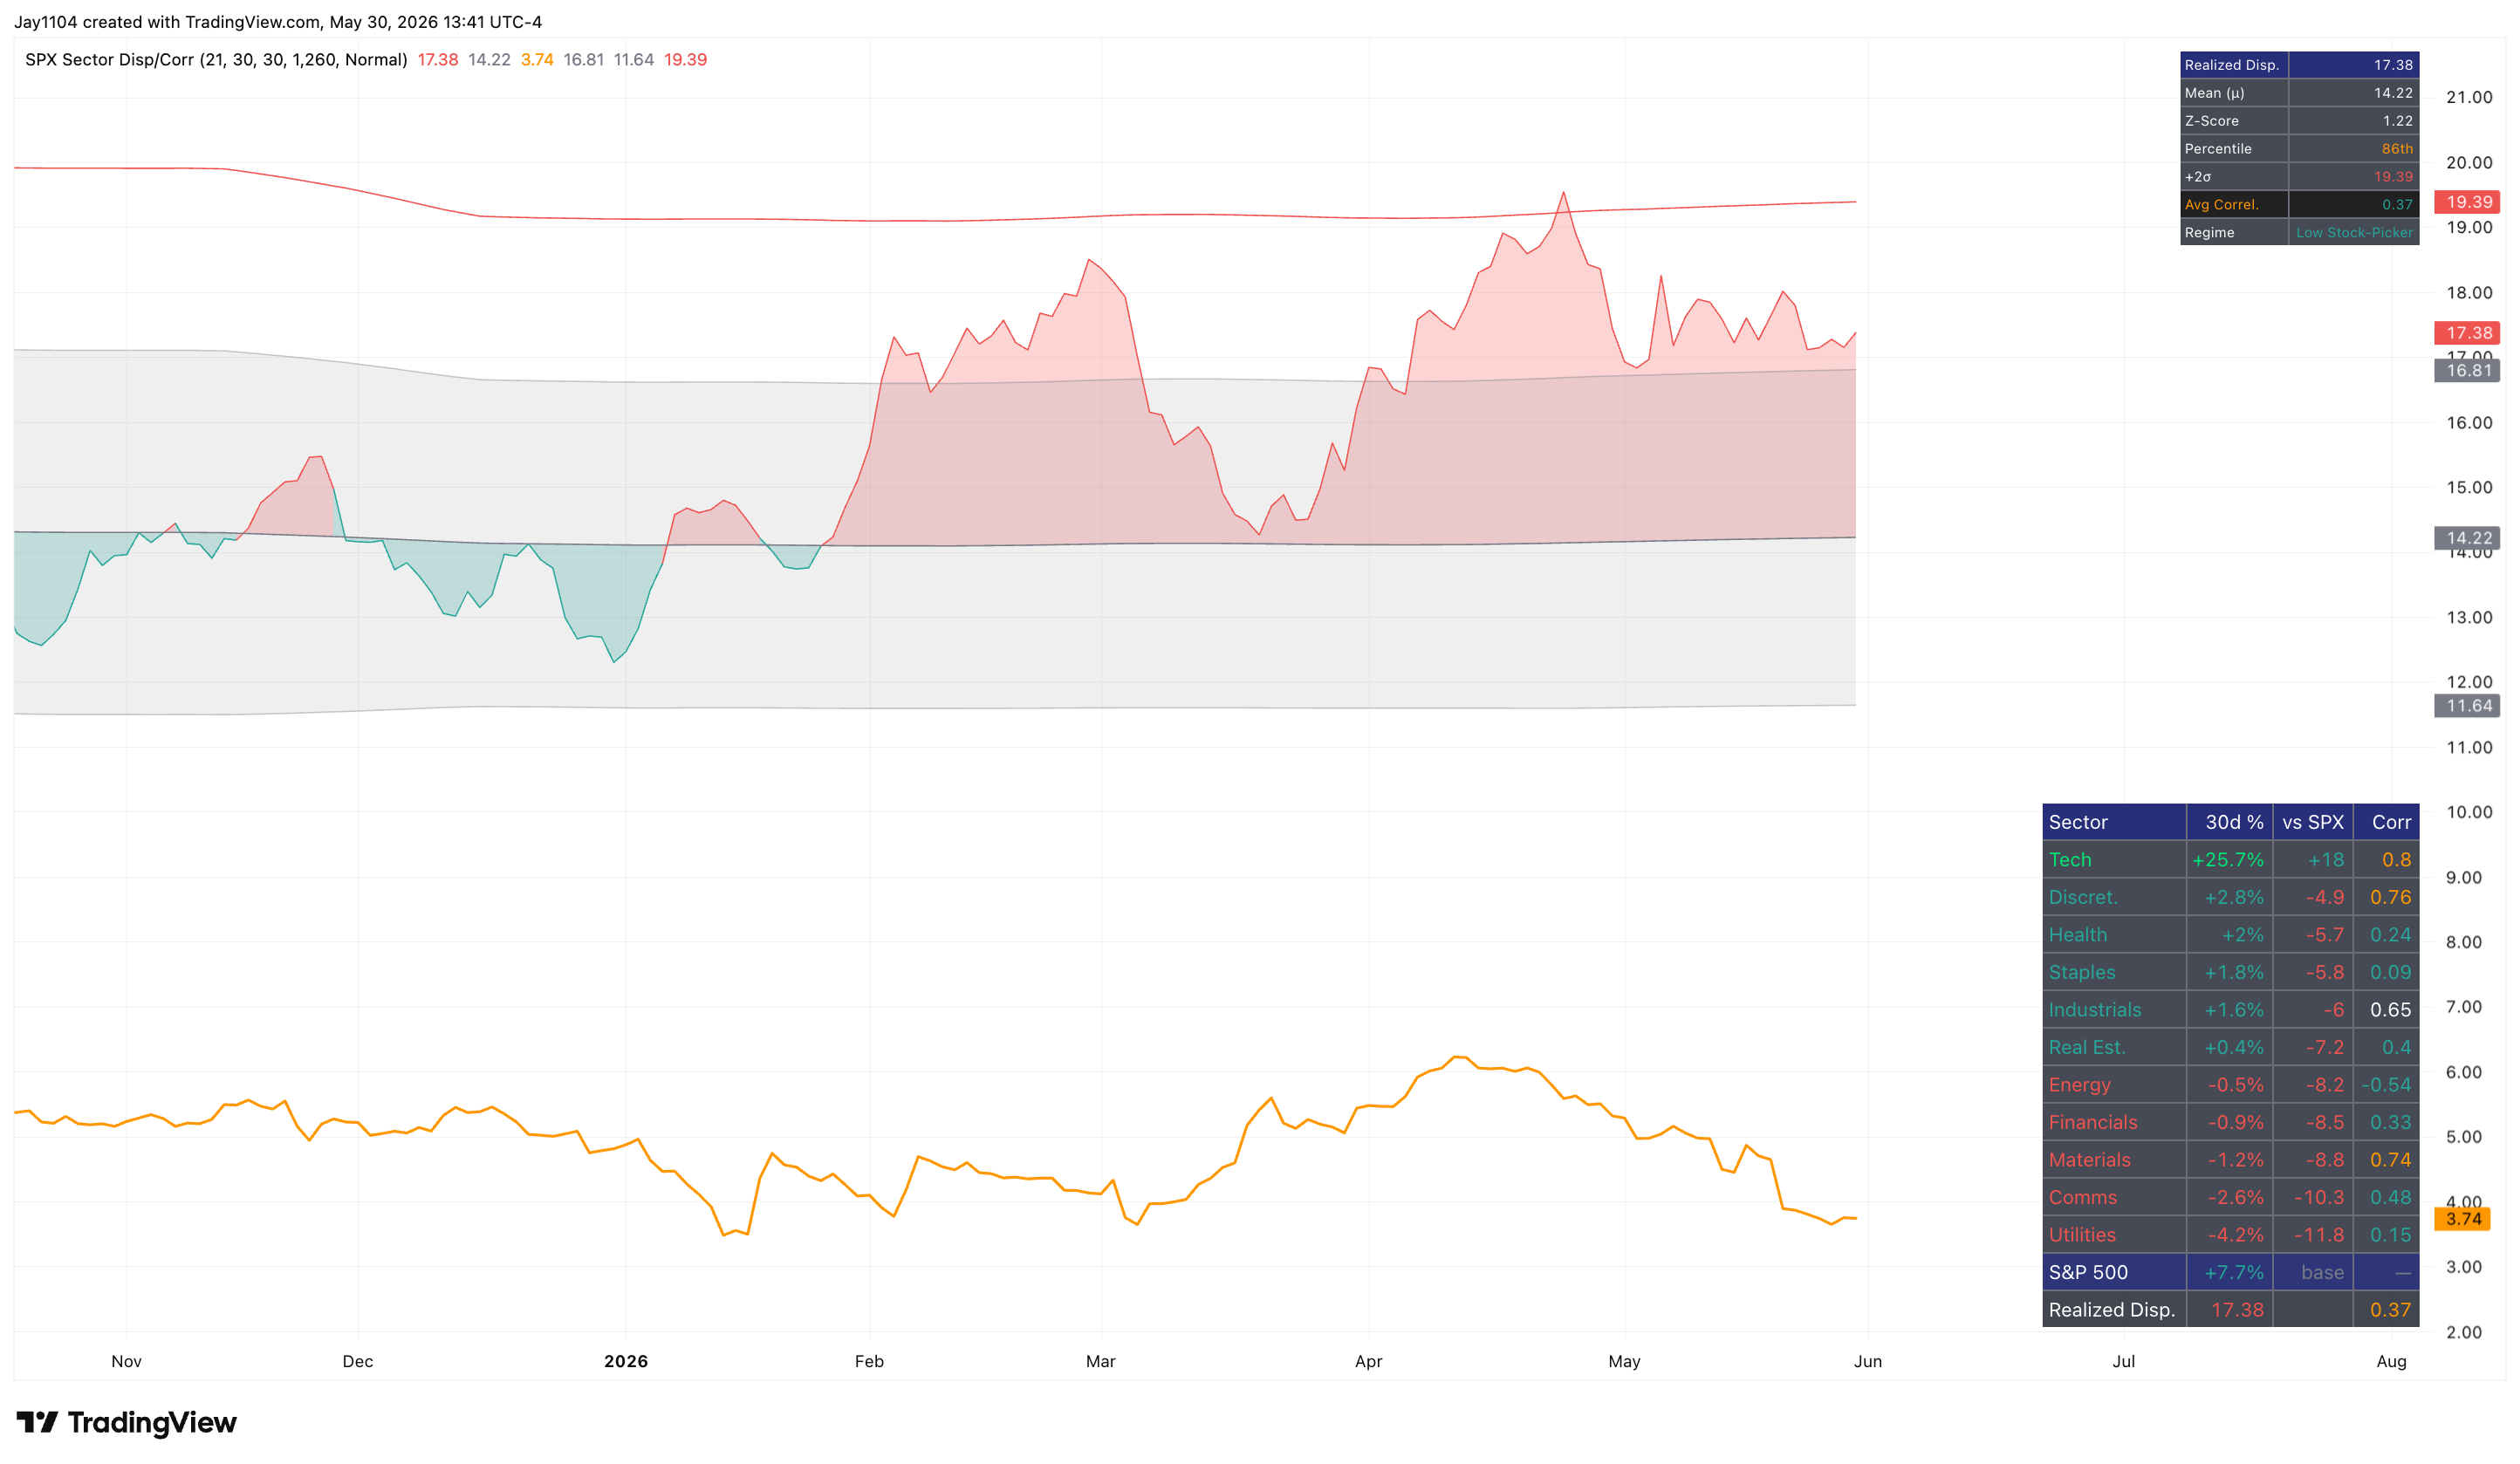
Realized dispersion confirms the narrowness — over 30 days, technology has outperformed the S&P by ~18 percentage points, while discretionary has lagged by ~5, and essentially every other sector has trailed. The tech ETF is now largely semis — Micron and Broadcom carry real weight. Levels: tech +18 pts / discretionary −5 pts vs. S&P (30d).
On Deck
This week — Broadcom (AVGO) earnings. Now nearly as important as NVIDIA for the sector’s tone, the key test is whether the semi-led tape keeps running.
The unwind window. Once the semiconductor names hit a wall — which, given positioning, may not be far off — the unwind can come quickly: a fast, compressed drawdown like 2024, or something like the inverse of 2018 (when the VIX spiked dramatically).
Commentary
Transcript Edited by Claude (Can Make Mistakes)
The Surge In Dispersion
This week markets generally continued to move higher, but there’s still a lot going on beneath the surface worth reviewing. One of the bigger developments was a very big move in dispersion.
Think about what dispersion really is. You have single-stock volatility — think Micron, for example — and you have index-level volatility — think the S&P 500. When Micron’s implied volatility is rising while S&P 500 volatility is falling, you’re getting implied dispersion: the implied vol of the single stock isn’t doing what the volatility of the index is doing, and so correlations are falling. They’re not moving together. Now imagine that happening across multiple stocks at once, and what you get is an implied dispersion index — a measure of single-stock vol versus index-level vol across a basket.
That dispersion index has risen to some pretty historic levels. You really only see dispersion where single-stock implied vol is going in a different direction than the index during periods of real market stress — back in April of 2025 and in March of 2020. You don’t typically see dispersion at this level unless you’re in some sort of market turmoil.
Correlations At Their Lowest Since 2007
The other side of the same coin is correlation — implied volatility for stocks moving in opposite directions of the index, no longer really correlated. On the three-month measure, correlations fell to about 8.6, which puts us back to a level we haven’t seen since July of 2024 — also a historically low level. In fact, you won’t find a level lower than 8.6, and that goes all the way back to 2007.
What’s this telling you? When you look at single-stock volatility — the constituent-level vol, the VIXEQ — you can see it’s pretty high, up around 44.7. And when you put index-level volatility on the same scale, the two are literally going in opposite directions. That’s what’s driving the dispersion.
You can look at it more closely name by name. The VIX on Amazon is kind of going down — although it’s not really going lower the way index-level vol is, and it’s not really going up either. But a stock like IBM is clearly divergent from what’s happening on the VIX index. That’s an example of dispersion going up and correlations going down.
A Normal Period — Not A Crisis
Dispersion and correlations can only go so far. It’s not to say dispersion can’t go higher from here — it could always go a little higher — but historically it doesn’t usually get much more extreme than this.
And I’d say we’re sort of in a normal period of time, relatively speaking. We’re not in a moment where the market is in crisis, or where there’s some big geopolitical event reshaping everything. Yes, we kind of had that with everything happening in oil and in Iran — but the market’s not crashing down. The market’s crashing up. That’s a different environment than COVID or the tariff tantrum. So to me, this is an indication that something in the marketplace is very, very stretched.
The July 2024 Analog And The Downside Math
Why does this matter? The last time implied correlations were this low was July of 2024 — and the market had a very sharp decline of about 10% from peak to trough. That move started on July 15 and concluded by August 5: over a little more than two weeks, the S&P fell by about 10%, and the Nasdaq fell by nearly 16% on an intraday basis.
So with correlation this low and dispersion this high, you set up a situation where index-level volatility could expand in a really big way, catching up to what you’re seeing in single-stock implied volatility, and ultimately dragging the S&P 500 or the Nasdaq lower.
A 15% decline doesn’t sound like much given how far we’ve rallied — but it would take the Nasdaq back to somewhere around 25,000, and a 10% decline in the S&P would take us back to roughly 6,805. Essentially, that would erase all of the gains we’ve seen, if we saw an event similar to 2024.
It’s also worth noting that every time implied correlations have come down to this kind of level, some sort of pullback has tended to follow. In March of 2024, correlations came down sharply and you got about a 6% decline. Another sharp drop took correlations to around 16, which marked a regional low, and you saw another decline of about 10.6%. So what this is setting up for, in a way, is a potential pullback of some scale once whatever is driving the single-stock movement begins to unwind.
It’s The Semiconductors
What’s generally driving this right now is what you’re seeing in semiconductors. There’s a newer way to track implied vol for the SMH — you can type in the VXSMH — and it’s risen to around 52. The high in March was around 55. The difference now is that the SMH is rising with implied volatility.
When you start looking at single stocks, you see the same thing. Micron has been rising with implied volatility, on really big call volumes. AMD has been rising on big implied vol with big call volumes. IBM, too — the stock rising with implied vol, a surge in call volumes. Qualcomm, the same — rising with implied vol and big call volumes. And Marvell: a big rise in the stock, a big rise in implied vol, and surging call volumes.
Ranking The Semis By Vol And Skew
I also took the semiconductors and ranked them by implied volatility and skew. When they sit down in the lower-right corner, it tells us that most of these stocks have skew to the call side — meaning calls are trading more expensive, with a lot of froth, relative to puts — and implied volatility is extremely high.
That’s what’s driving single-stock implied vol sharply higher, which is causing dispersion to reach new levels, which is ultimately causing implied correlations to melt down. And because the weightings of these semiconductor stocks keep getting bigger within the index, they’re having a bigger and bigger impact on the overall index, driving the dispersion.
Realized Dispersion By Sector
You can see the same thing in the realized-dispersion table — an equal-weighted look across sectors. The technology sector has outperformed the S&P 500 over the past 30 days by 18 percentage points. Discretionary has underperformed by almost 5 percentage points, and every other sector has underperformed the S&P over that window, with technology the only one ahead.
And technology at this point is largely semiconductors. It used to be that Apple and Microsoft were the biggest weights; then NVIDIA took over; and now stocks like Micron and Broadcom have moved up very quickly. The group has taken on a bigger and bigger role.
The Squeeze And The Unwind Risk
While it may seem like this can go on for a while longer, one of the bigger risks is that Broadcom reports results this week — and Broadcom has become as important as NVIDIA in a lot of ways for determining the health of the sector.
So what you’re really looking at right now is a kind of gamma-squeeze dynamic: surging implied volatility in some of these semiconductor and quantum-computing names, which pushes single-stock implied vol higher, which pushes dispersion up and implied correlations down. That creates a scenario where, once the semiconductor stocks hit a wall — which could be relatively soon given where positioning sits — the unwind could come pretty quickly. It could look similar to the 2024 period, where you got a big drawdown over a short stretch. It could even resemble 2018, just from a slightly different perspective — almost the inverse of that time, when the VIX spiked dramatically.
Last Week: What We Saw
Tue 5/26 — The S&P’s close versus the prior all-time high at 7,515 was the pivot. Outcome: played out on the rejection leg — the index stalled around 7,515 into midweek with no meaningful new high.
Wed 5/27 — Micron’s $900-call volume cratered (45k → 14k mid-session); the watch was whether the gamma pin would let go as IV compressed. Outcome: still pending — Micron stayed a top index contributor, and semi vol (VXSMH) is back at the high end of its range.
Thu 5/28 — The S&P pushed above 7,515 for the first time since 5/14 on the Iran-MOU headline; durability was the test. Outcome: durability held into the weekend.
Fri 5/29 — The dispersion-correlations spread remained the direction tell; the turn signal Mike wanted was the VIX rising while the VIXEQ fell. Outcome: neither happened — the spread kept widening, the rally held, and by the weekend the 3-month correlation reached 8.6.
Defined Terms
Implied dispersion — A measure of how much single-stock implied volatility exceeds index-level implied volatility across a basket. High dispersion means individual names are expected to move much more than the index — trading on their own stories rather than together.
Implied correlation — The mirror image of dispersion: a market-implied measure of how synchronously index constituents are expected to move. Low readings mean names are going their own way while index vol stays subdued; readings this low are historically rare.
VIXEQ — The CBOE Equity VIX, an average of individual S&P 500 component implied volatilities, in contrast to the VIX, which measures index-level volatility. Constituent vol rising while index vol falls is the classic dispersion-up signal.
VXSMH — The implied-volatility index for the SMH (semiconductor) ETF — analogous to the VIX but for semis specifically. Rises when option premiums on semiconductor names get bid.
Skew (call-side) — The relative pricing of out-of-the-money calls versus puts. “Skew to the call side” means calls are trading richer than puts — unusual for equities, which are normally put-skewed — and signals heavy upside (call) demand.
Gamma squeeze — A self-reinforcing dynamic where heavy call buying forces options dealers to buy the underlying to hedge, pushing the price (and implied volatility) higher, which begets more hedging — until the buying stops.
Realized dispersion — The actually-observed (rather than implied) spread of returns across S&P 500 sectors or constituents, measured by sector-versus-index performance and pairwise correlation.
Disclaimer
This report contains independent commentary to be used for informational and educational purposes only. Michael Kramer is a member and investment adviser representative with Mott Capital Management. Mr. Kramer is not affiliated with this company and does not serve on the board of any related company that issued this stock. All opinions and analyses presented by Michael Kramer in this analysis or market report are solely Michael Kramer’s views. Readers should not treat any opinion, viewpoint, or prediction expressed by Michael Kramer as a specific solicitation or recommendation to buy or sell a particular security or follow a particular strategy. Michael Kramer’s analyses are based upon information and independent research that he considers reliable, but neither Michael Kramer nor Mott Capital Management guarantees its completeness or accuracy, and it should not be relied upon as such. Michael Kramer is not under any obligation to update or correct any information presented in his analyses. Mr. Kramer’s statements, guidance, and opinions are subject to change without notice. Past performance is not indicative of future results. Neither Michael Kramer nor Mott Capital Management guarantees any specific outcome or profit. You should be aware of the real risk of loss in following any strategy or investment commentary presented in this analysis. Strategies or investments discussed may fluctuate in price or value. Investments or strategies mentioned in this analysis may not be suitable for you. This material does not consider your particular investment objectives, financial situation, or needs and is not intended as a recommendation appropriate for you. You must make an independent decision regarding investments or strategies in this analysis. Upon request, the advisor will provide a list of all recommendations made during the past twelve months. Before acting on information in this analysis, you should consider whether it is suitable for your circumstances and strongly consider seeking advice from your own financial or investment adviser to determine the suitability of any investment.