
Semiconductor Weakness May Test the Market Rally This Week

Please remember to subscribe to my Substack to receive this free daily commentary—which I work very hard to produce—directly in your inbox.
Paid Member Content:

Advanced Topics:

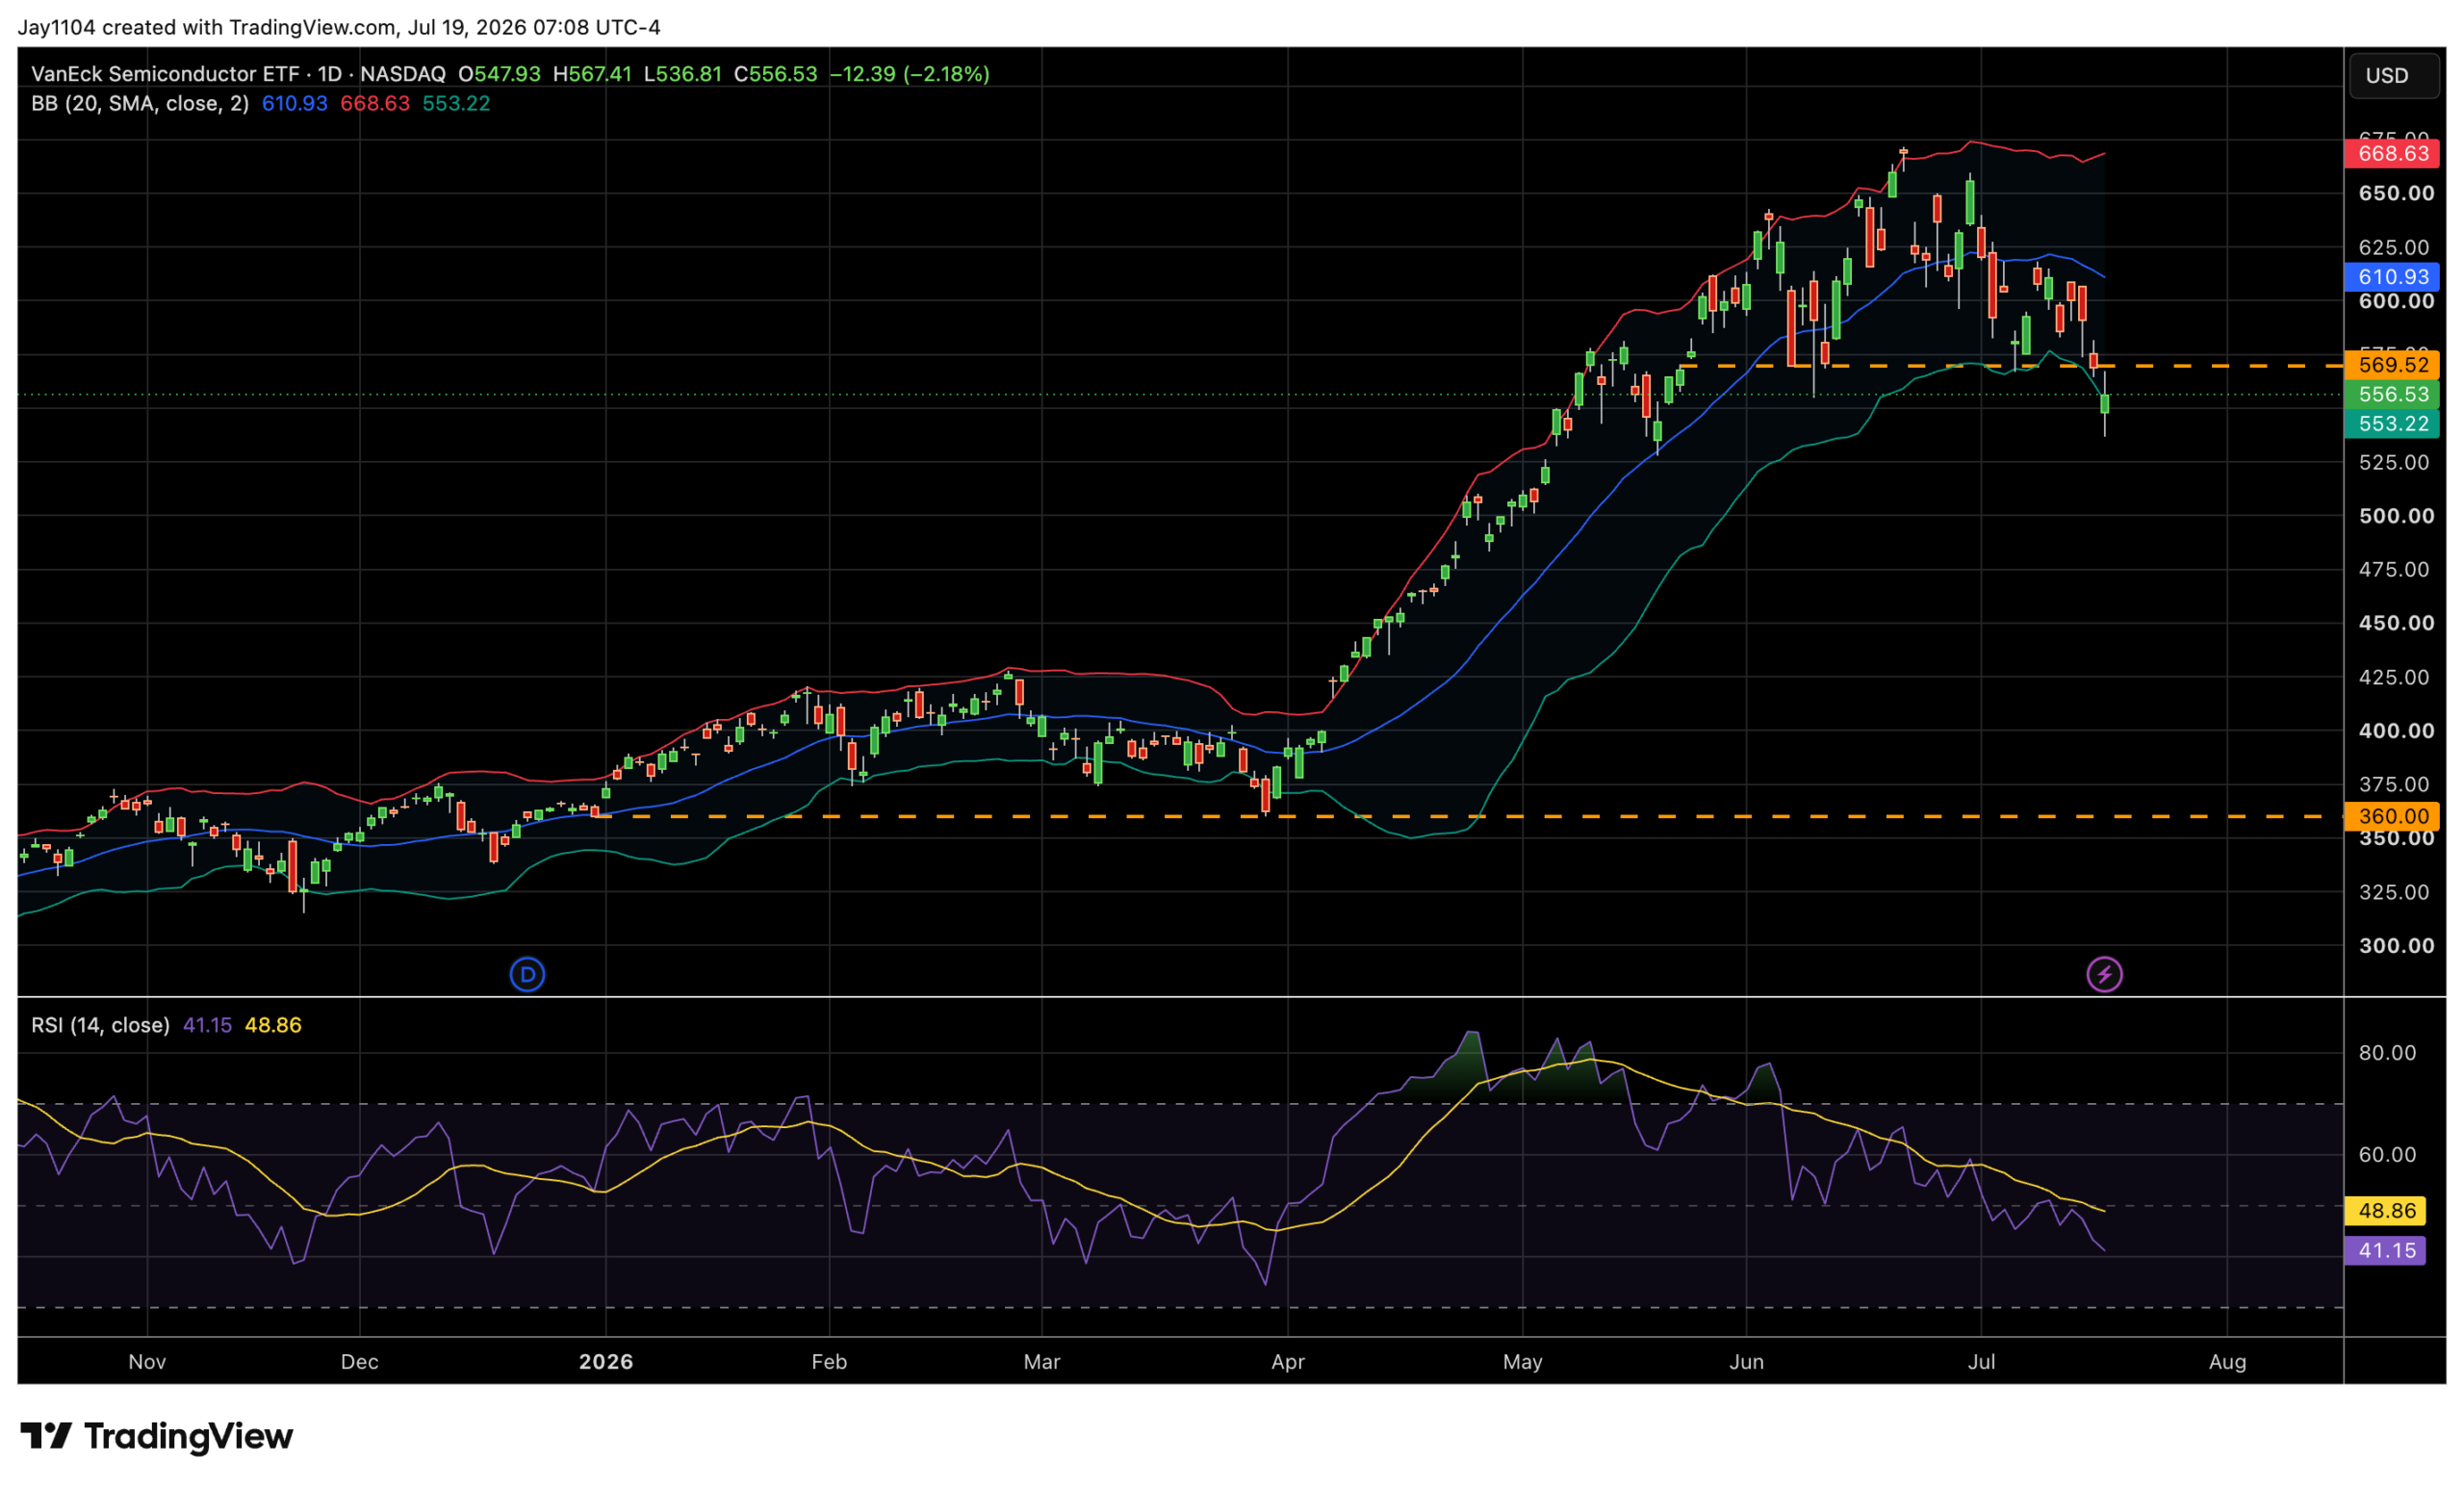
The S&P 500 fell about 1% on Friday as the technology sector declined, led by a roughly 2% drop in semiconductor stocks. Semiconductor stocks are approaching their lower Bollinger Band, but their RSI is only around 41 and continues to trend lower, suggesting they are not yet oversold. As a result, the group could continue to decline this week.
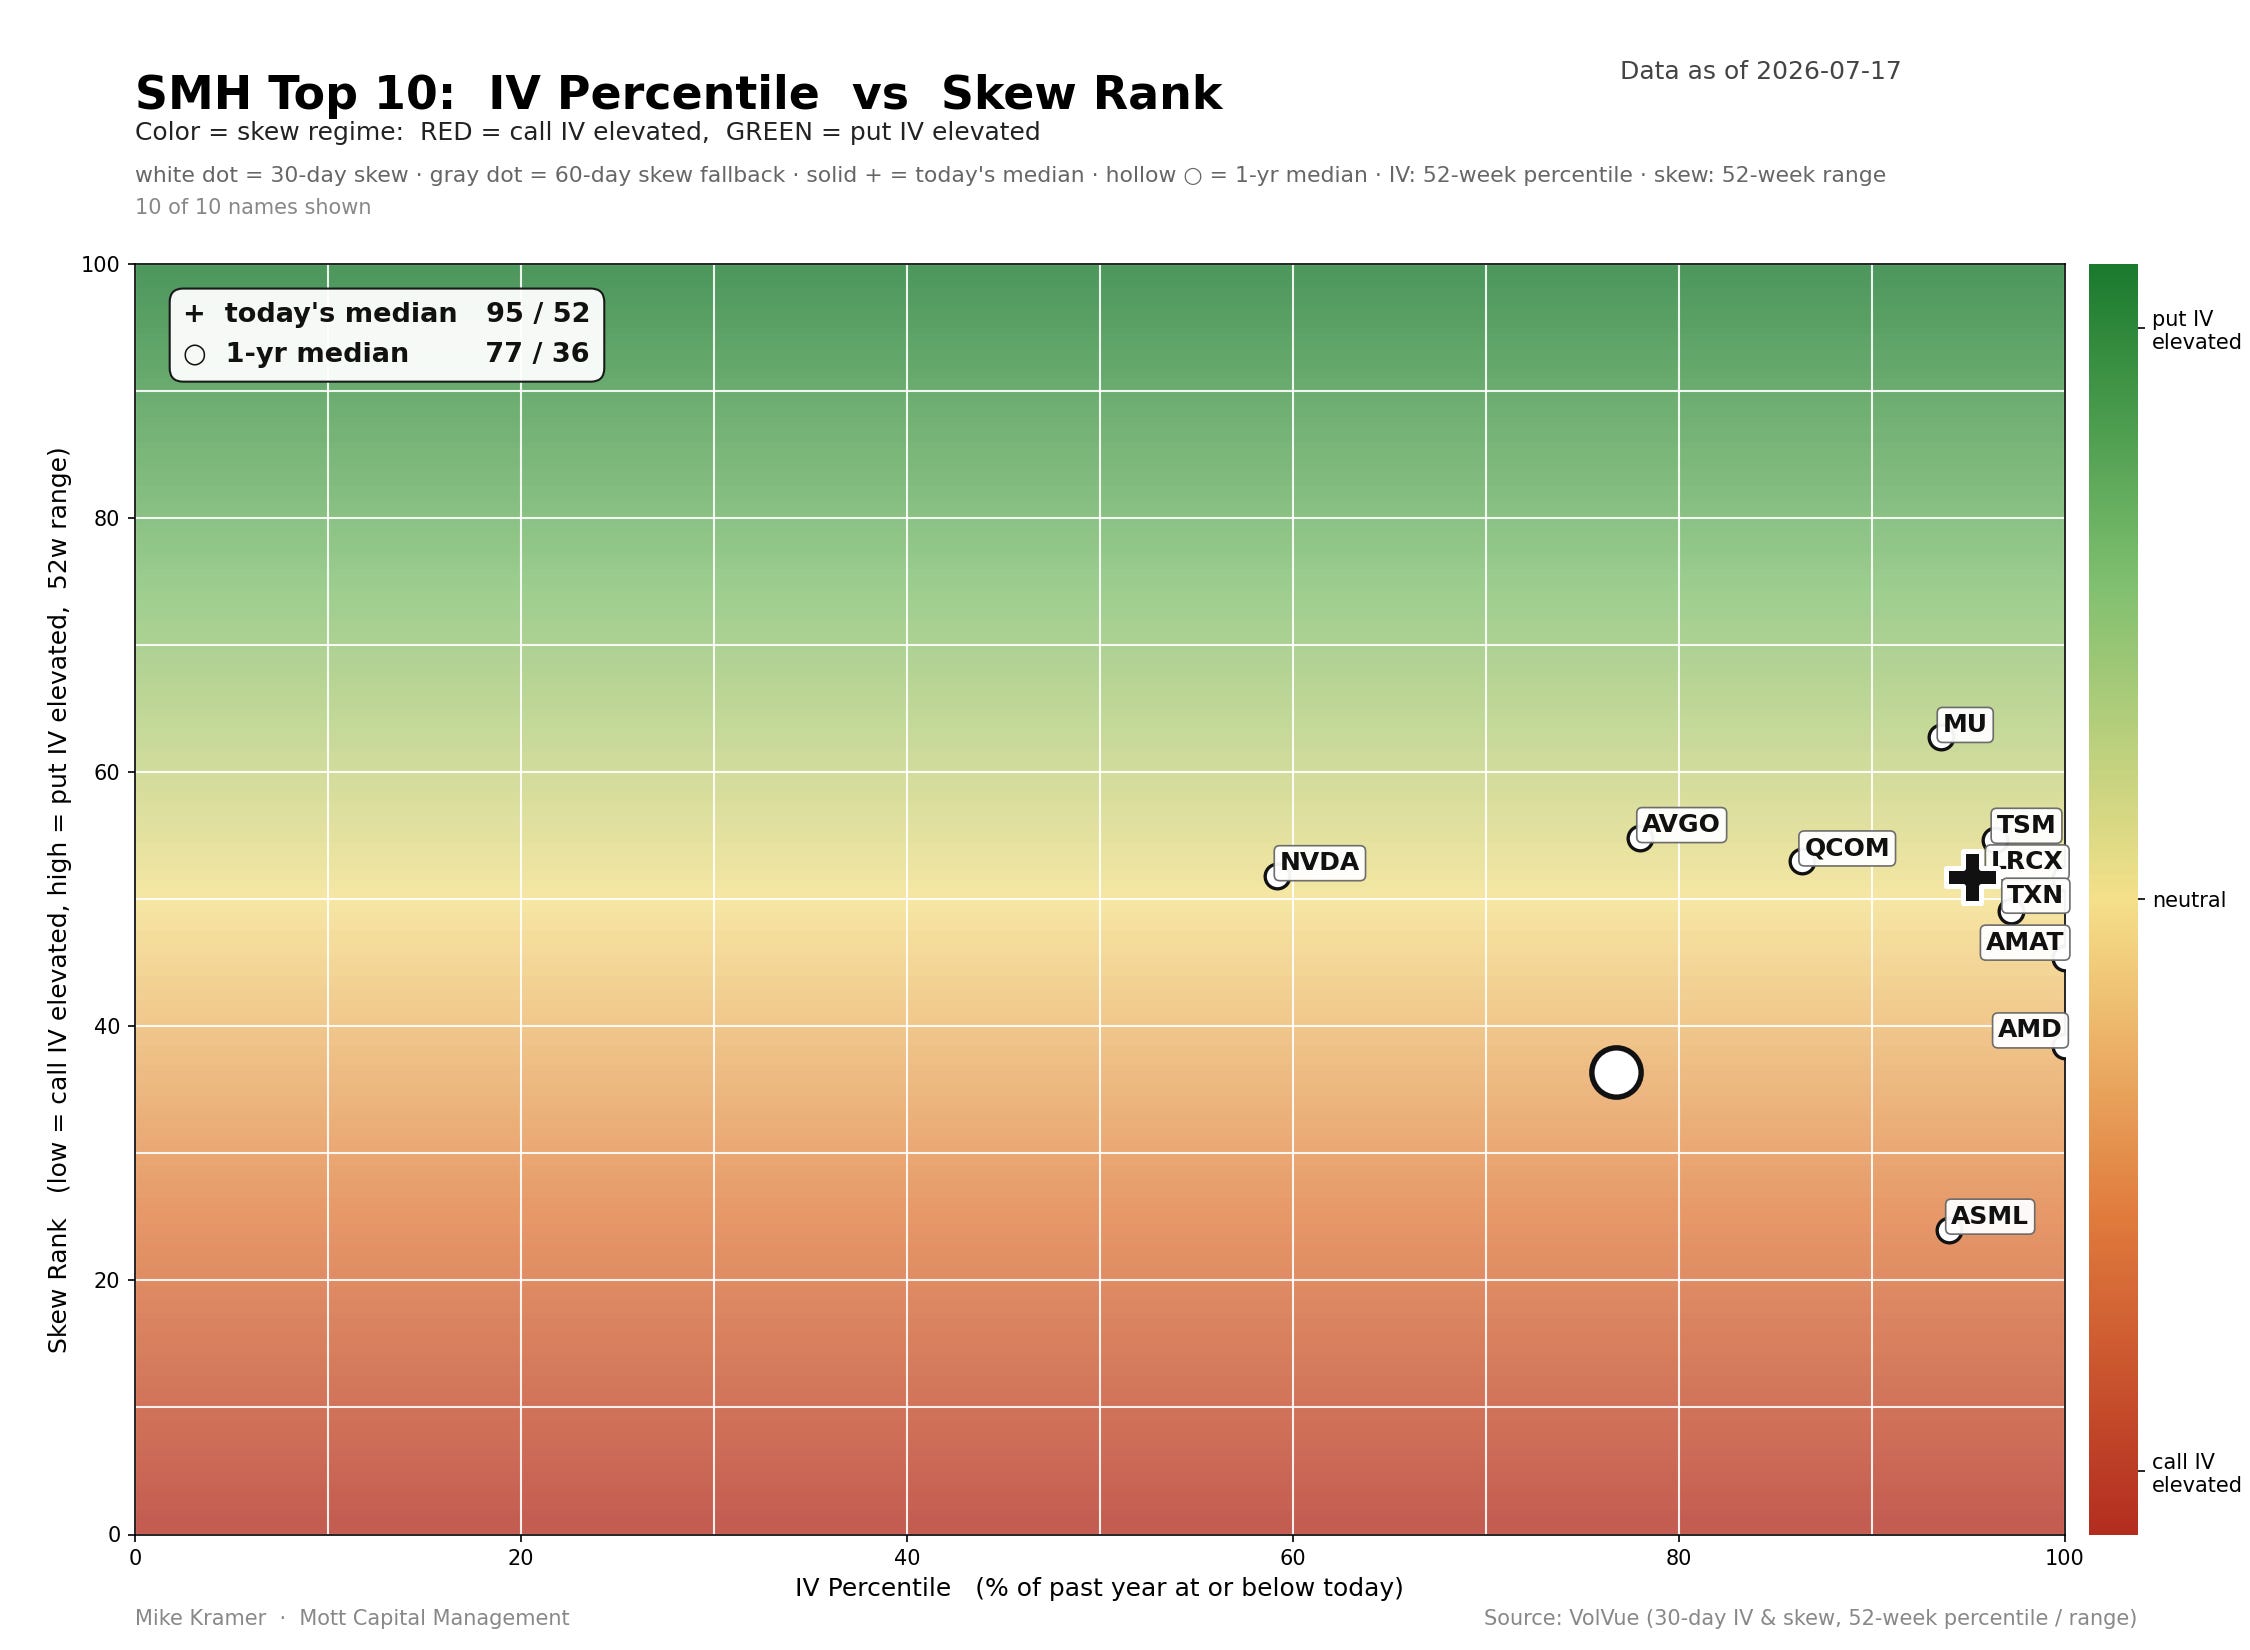
One thing that stands out is the shift in indicators such as implied volatility and skew. Implied volatility remains very high for the group, but the skew has shifted from an extremely bullish positioning to a more neutral stance. The group’s bullish momentum appears to have become more balanced, which is probably a healthy sign that the feverish sentiment and momentum chasing seen in May and June have faded.
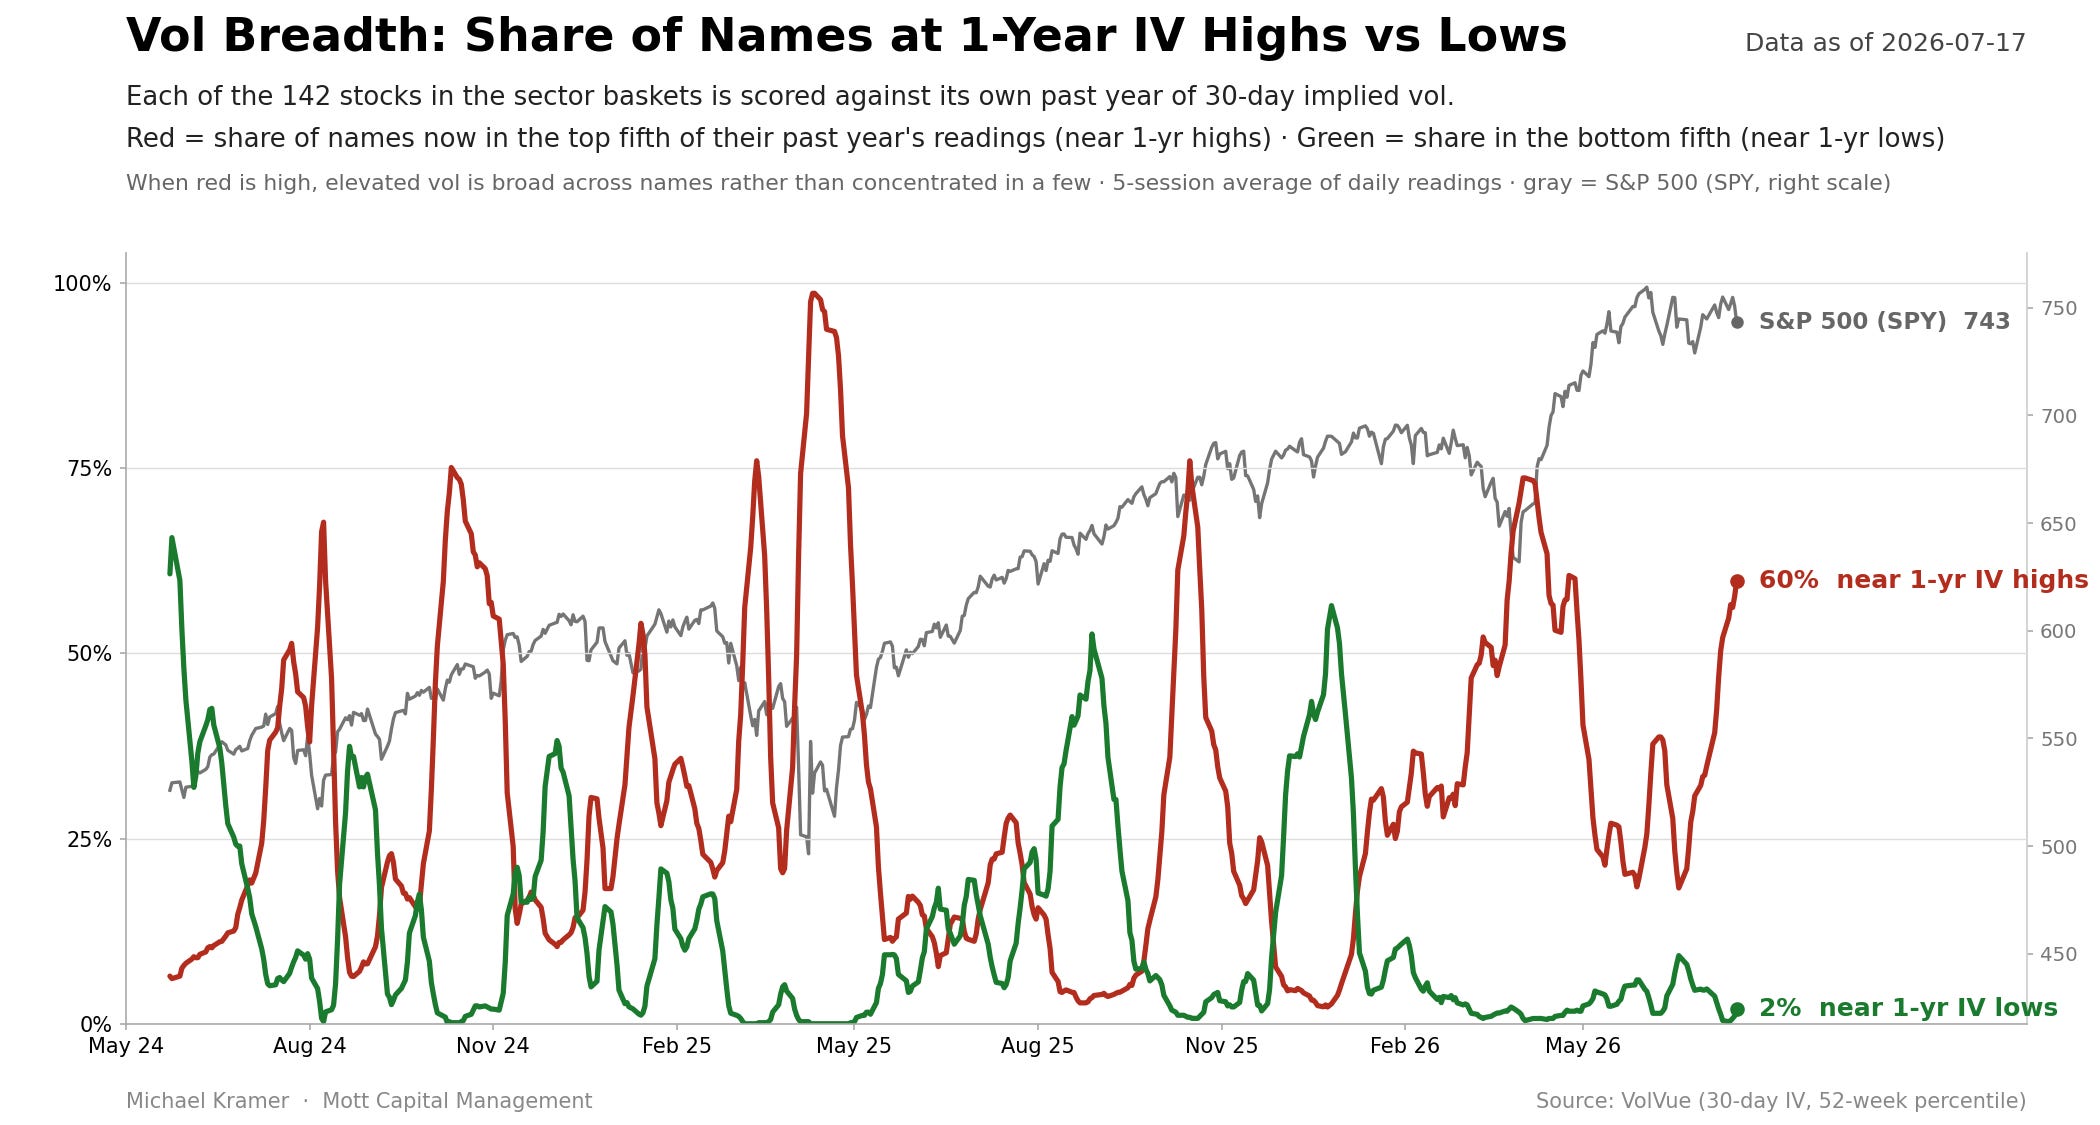
Still, implied volatility in individual stocks remains very high. Of the 142 stocks I track daily—representing the largest companies in the S&P 500—60% have implied volatility near their 52-week highs, compared with only 2% near their 52-week lows. This is certainly not the highest level since May 2024, but historically, volatility breadth this elevated has tended to be followed by a pullback in the S&P 500. July 2024 stands out on the chart below as a similar period: volatility breadth initially rose alongside the index, but the relationship eventually reversed, with breadth continuing to rise as the index fell.
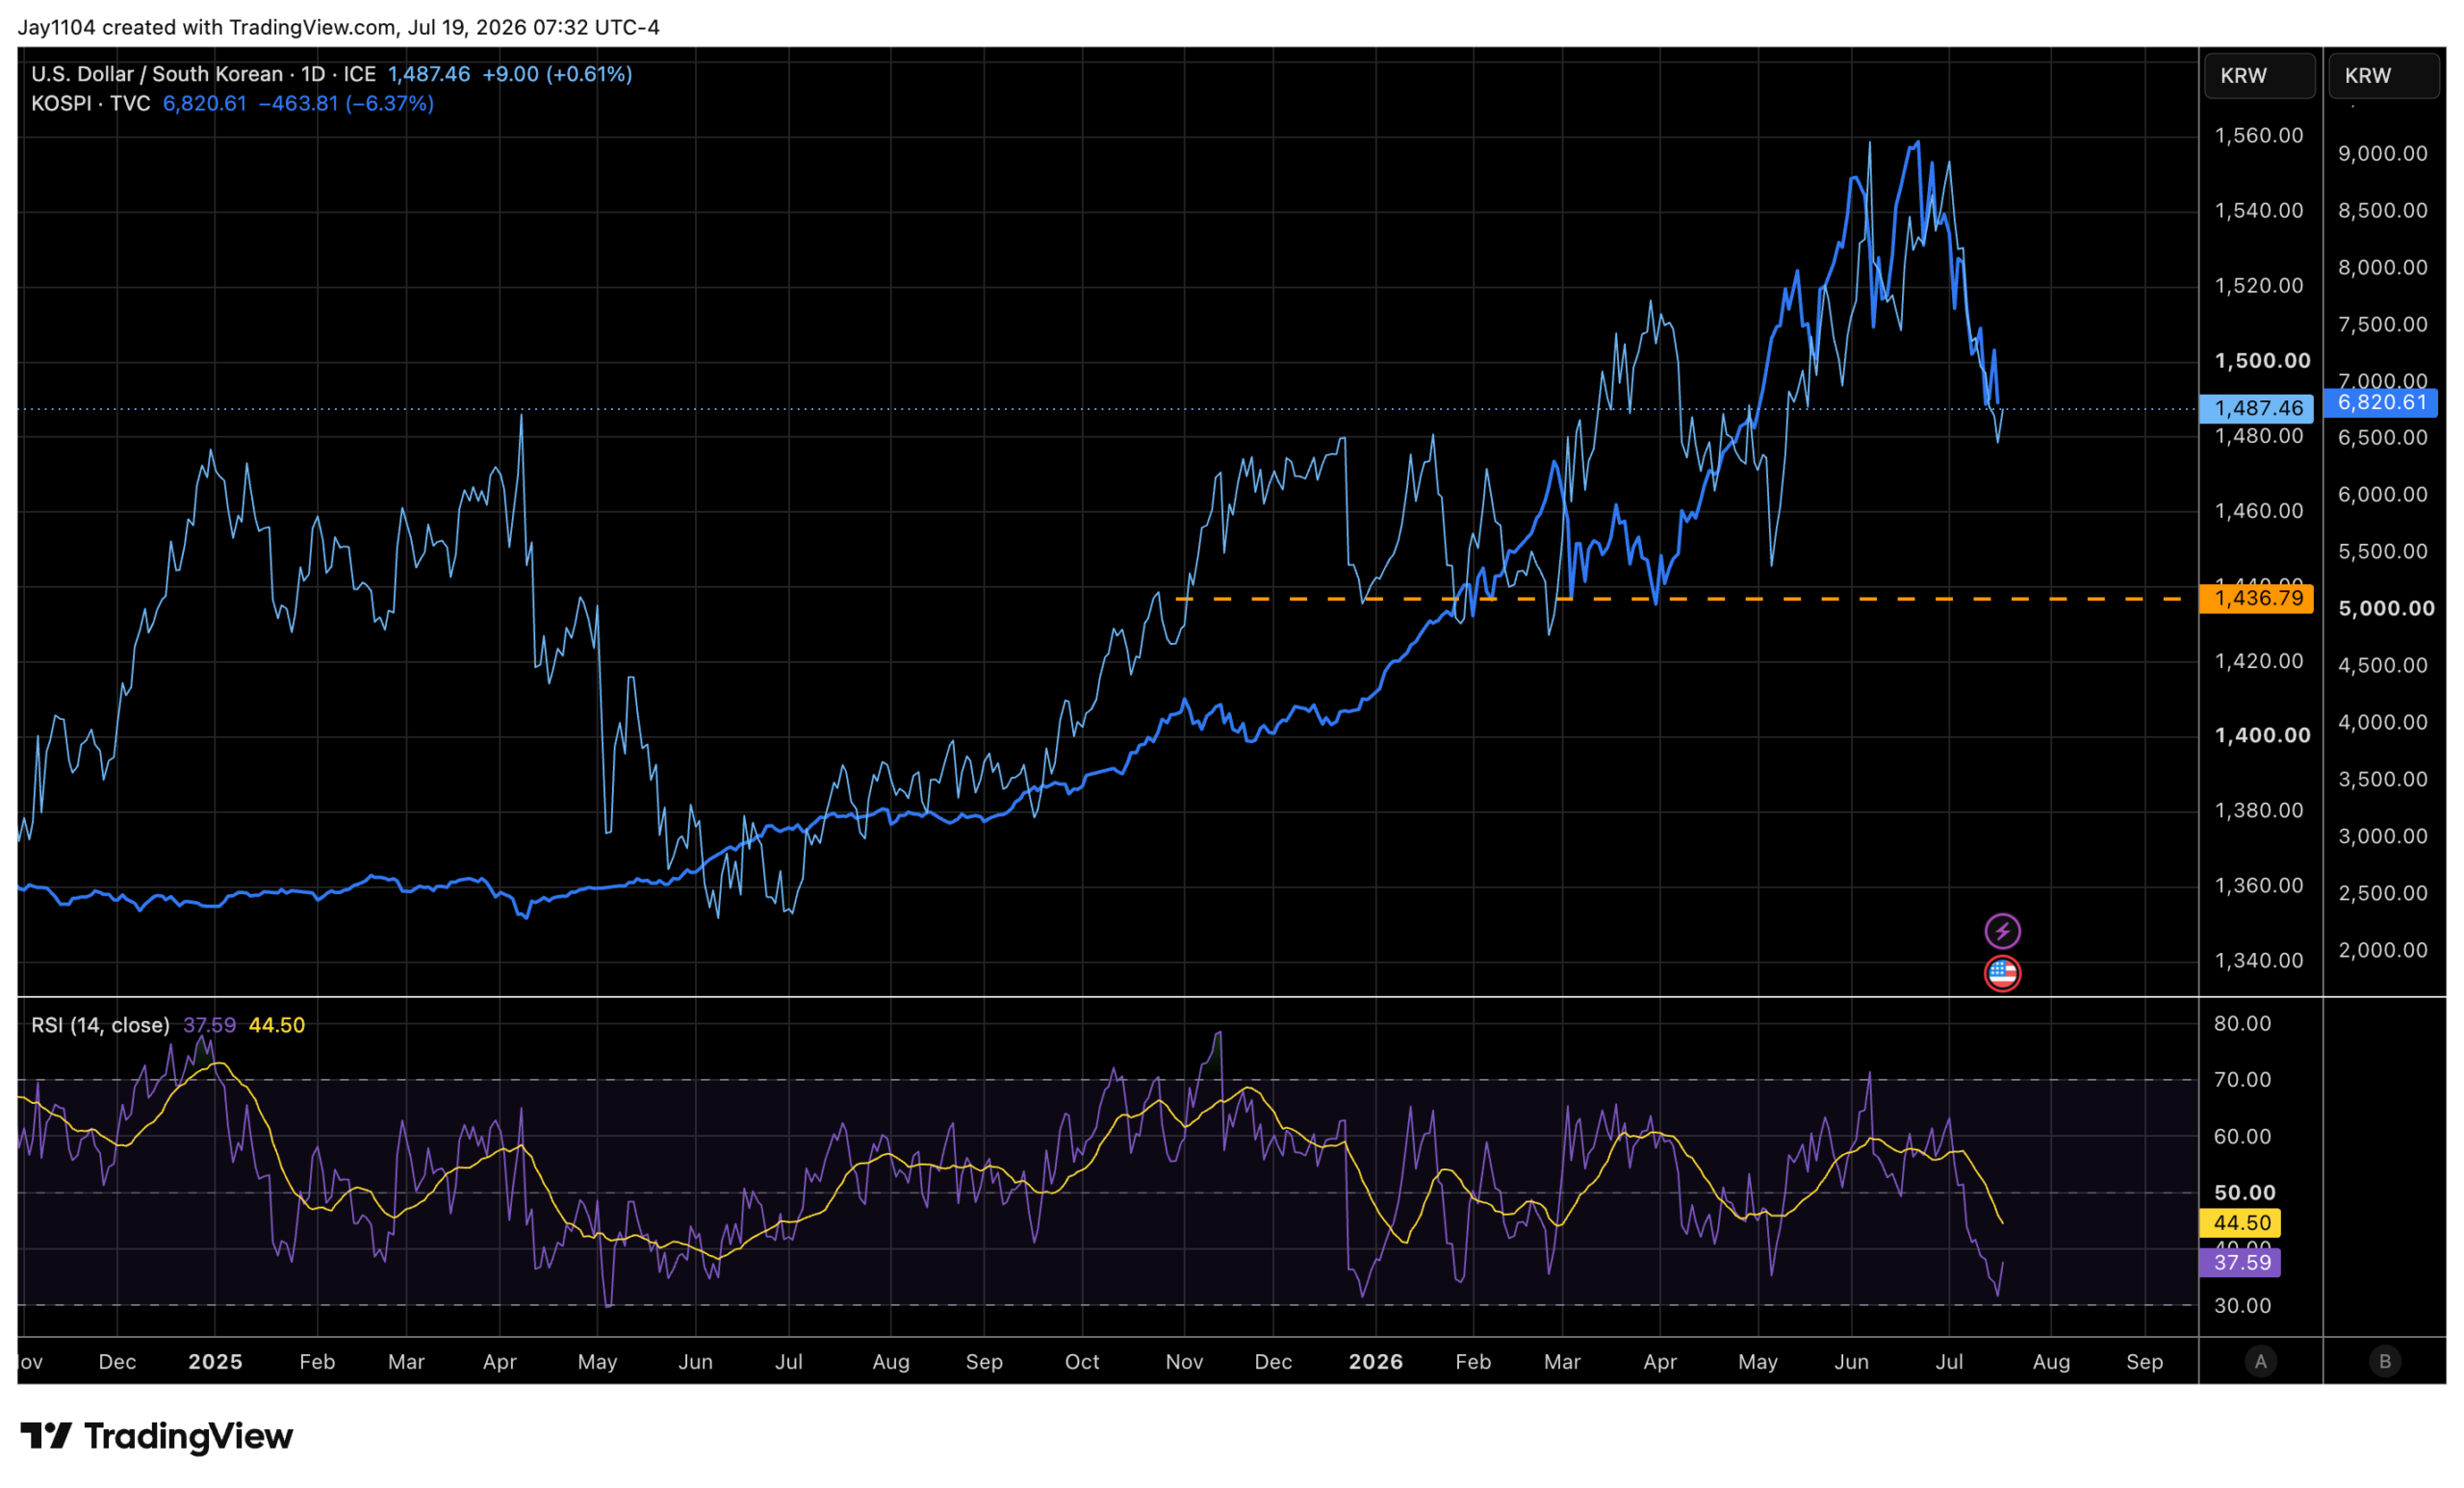
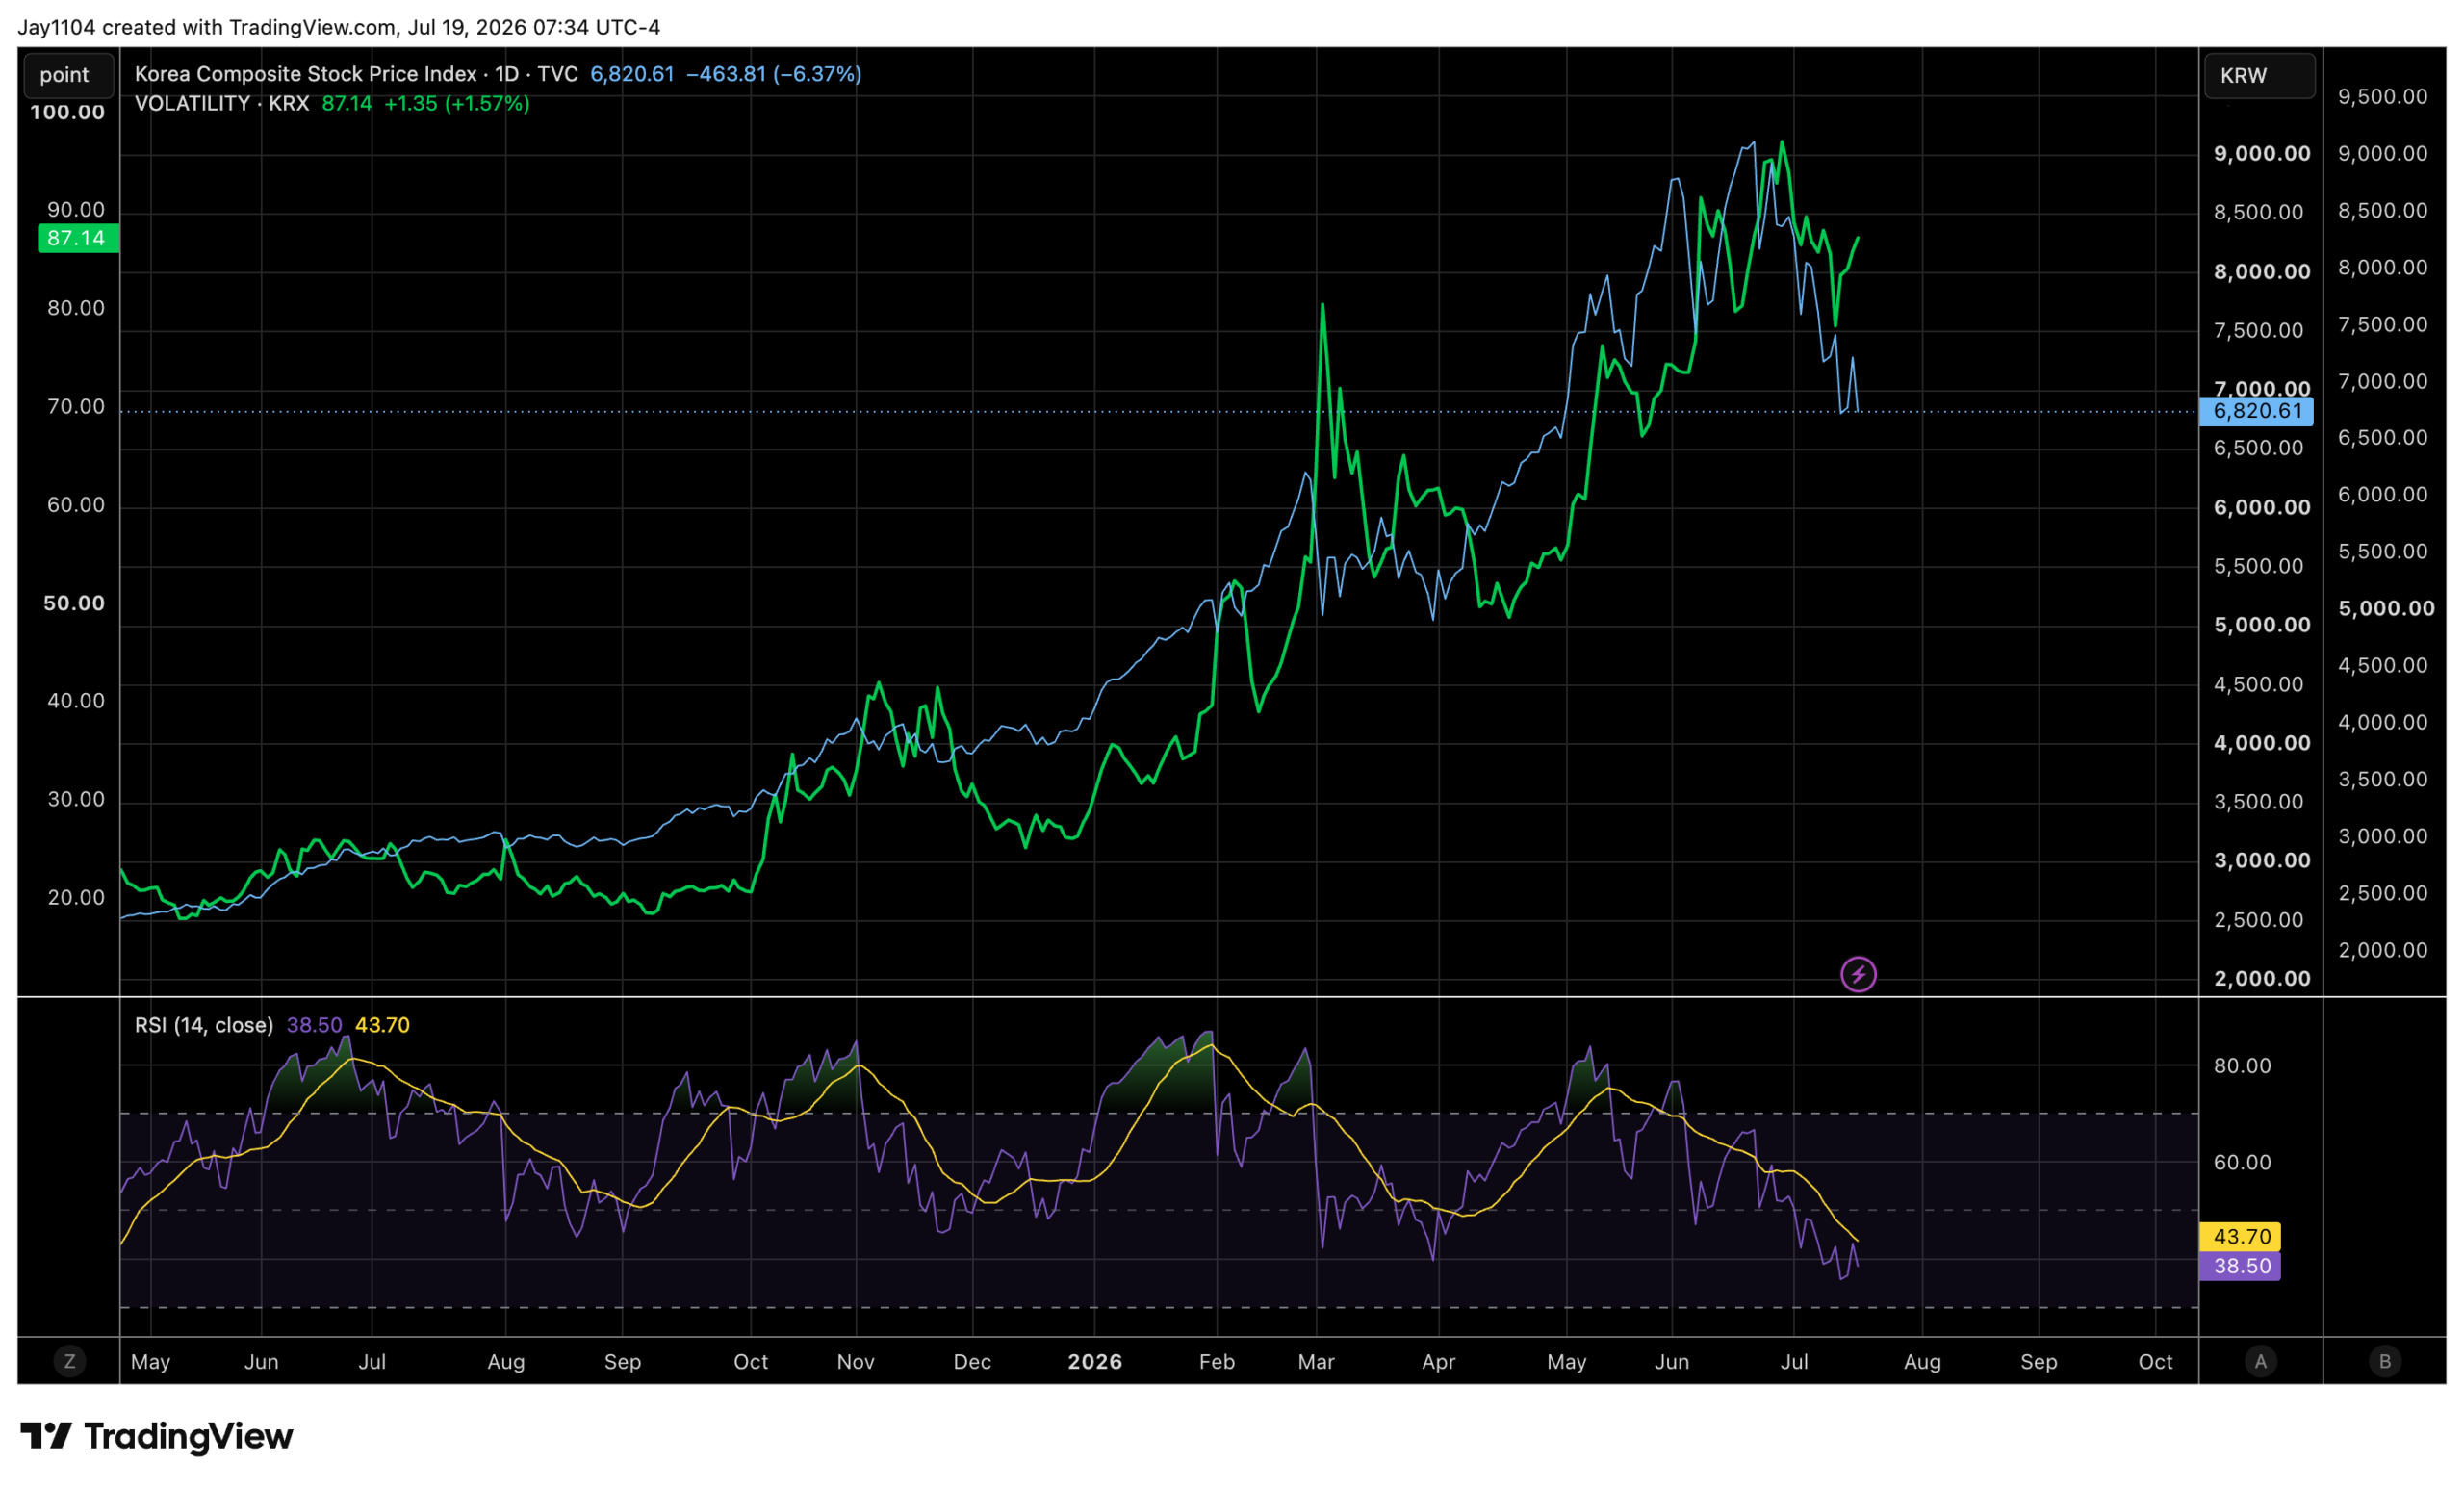
Meanwhile, South Korea’s market was closed on Friday and will reopen on Monday. The Bank of Korea raised interest rates by 25 basis points on July 15, and the market expects another increase before year-end. This has pushed USD/KRW lower, indicating that the won has strengthened against the dollar. The won’s weakness over the past few months appears to have been closely tied to movements in the KOSPI, although whether that relationship will persist remains to be seen. Fundamentally, a weaker won benefits Korean exporters, so further strengthening could weigh on the market their.
On top of that, implied volatility in South Korea has been rising alongside the equity market, generally signaling that the rally is being driven by momentum chasing—rarely a healthy sign.
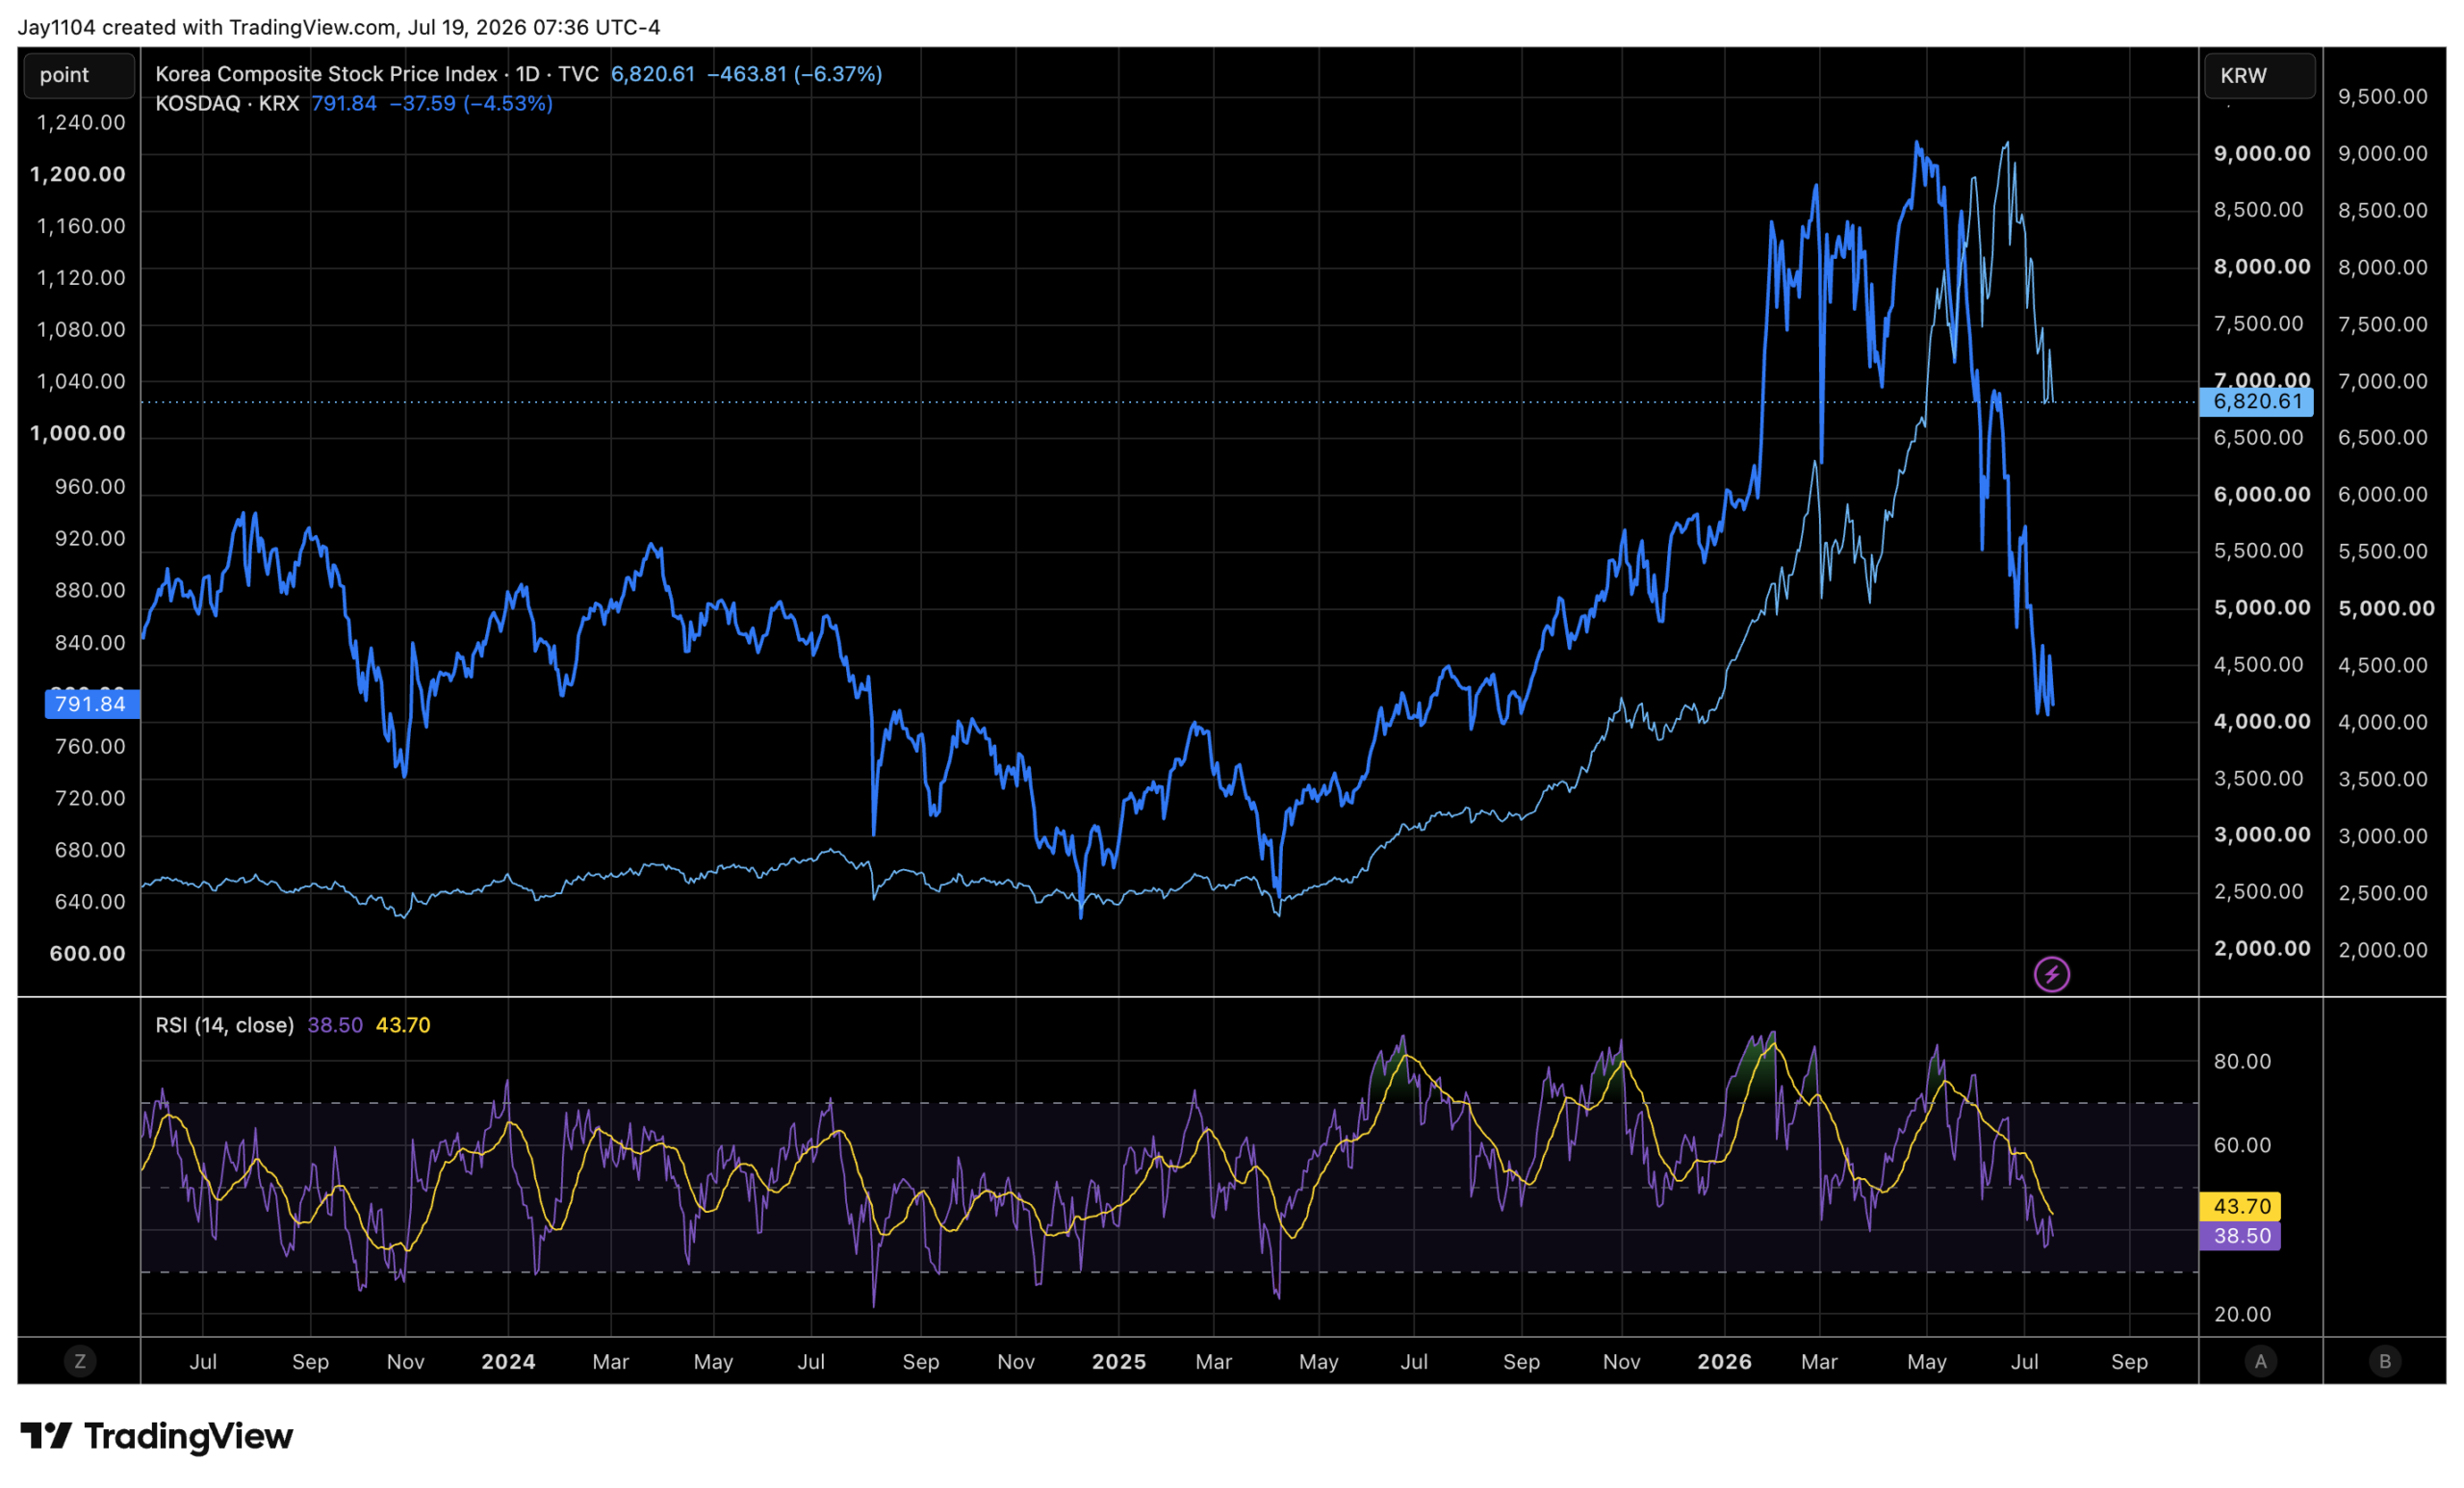
The less-followed KOSDAQ has been crushed in recent weeks, giving back all its gains since September 2025. Because it can lead the KOSPI, its weakness does not bode well for either the KOSPI or the semiconductor sector.
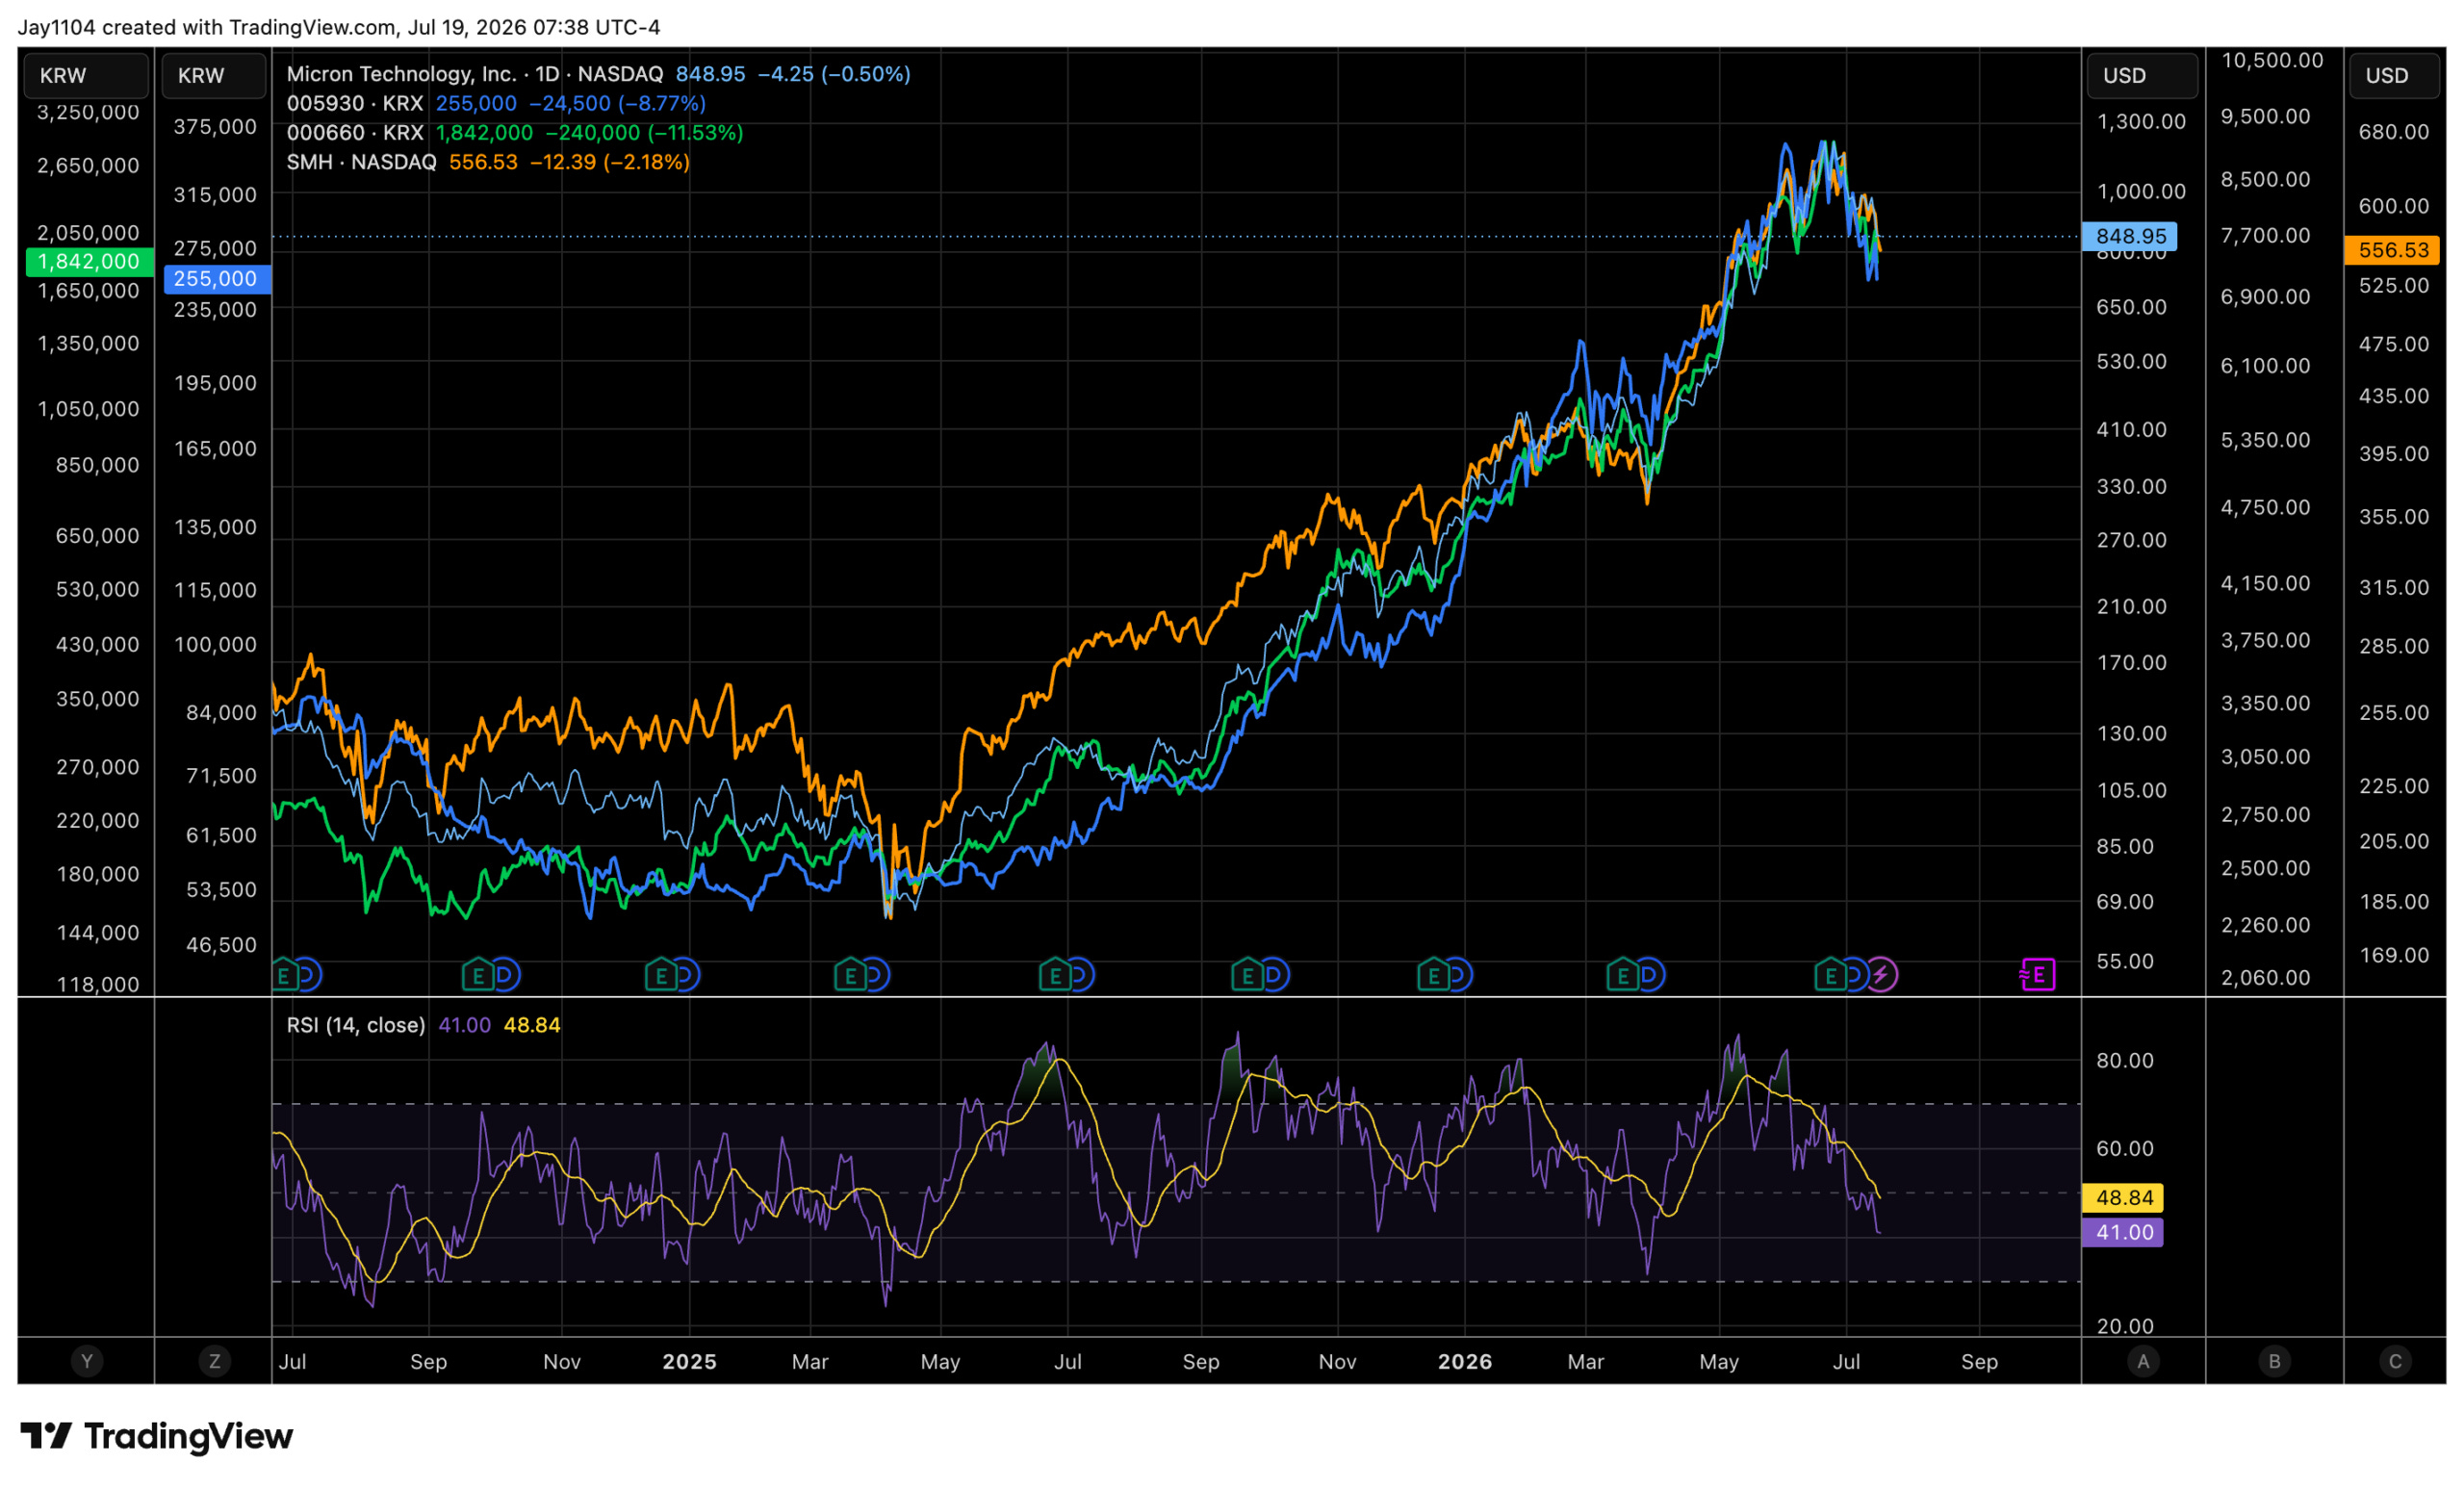
There has been virtually no difference between semiconductor stocks listed in South Korea and those listed in the U.S.; Micron, SK Hynix, Samsung, and the SMH have all traded in much the same way.
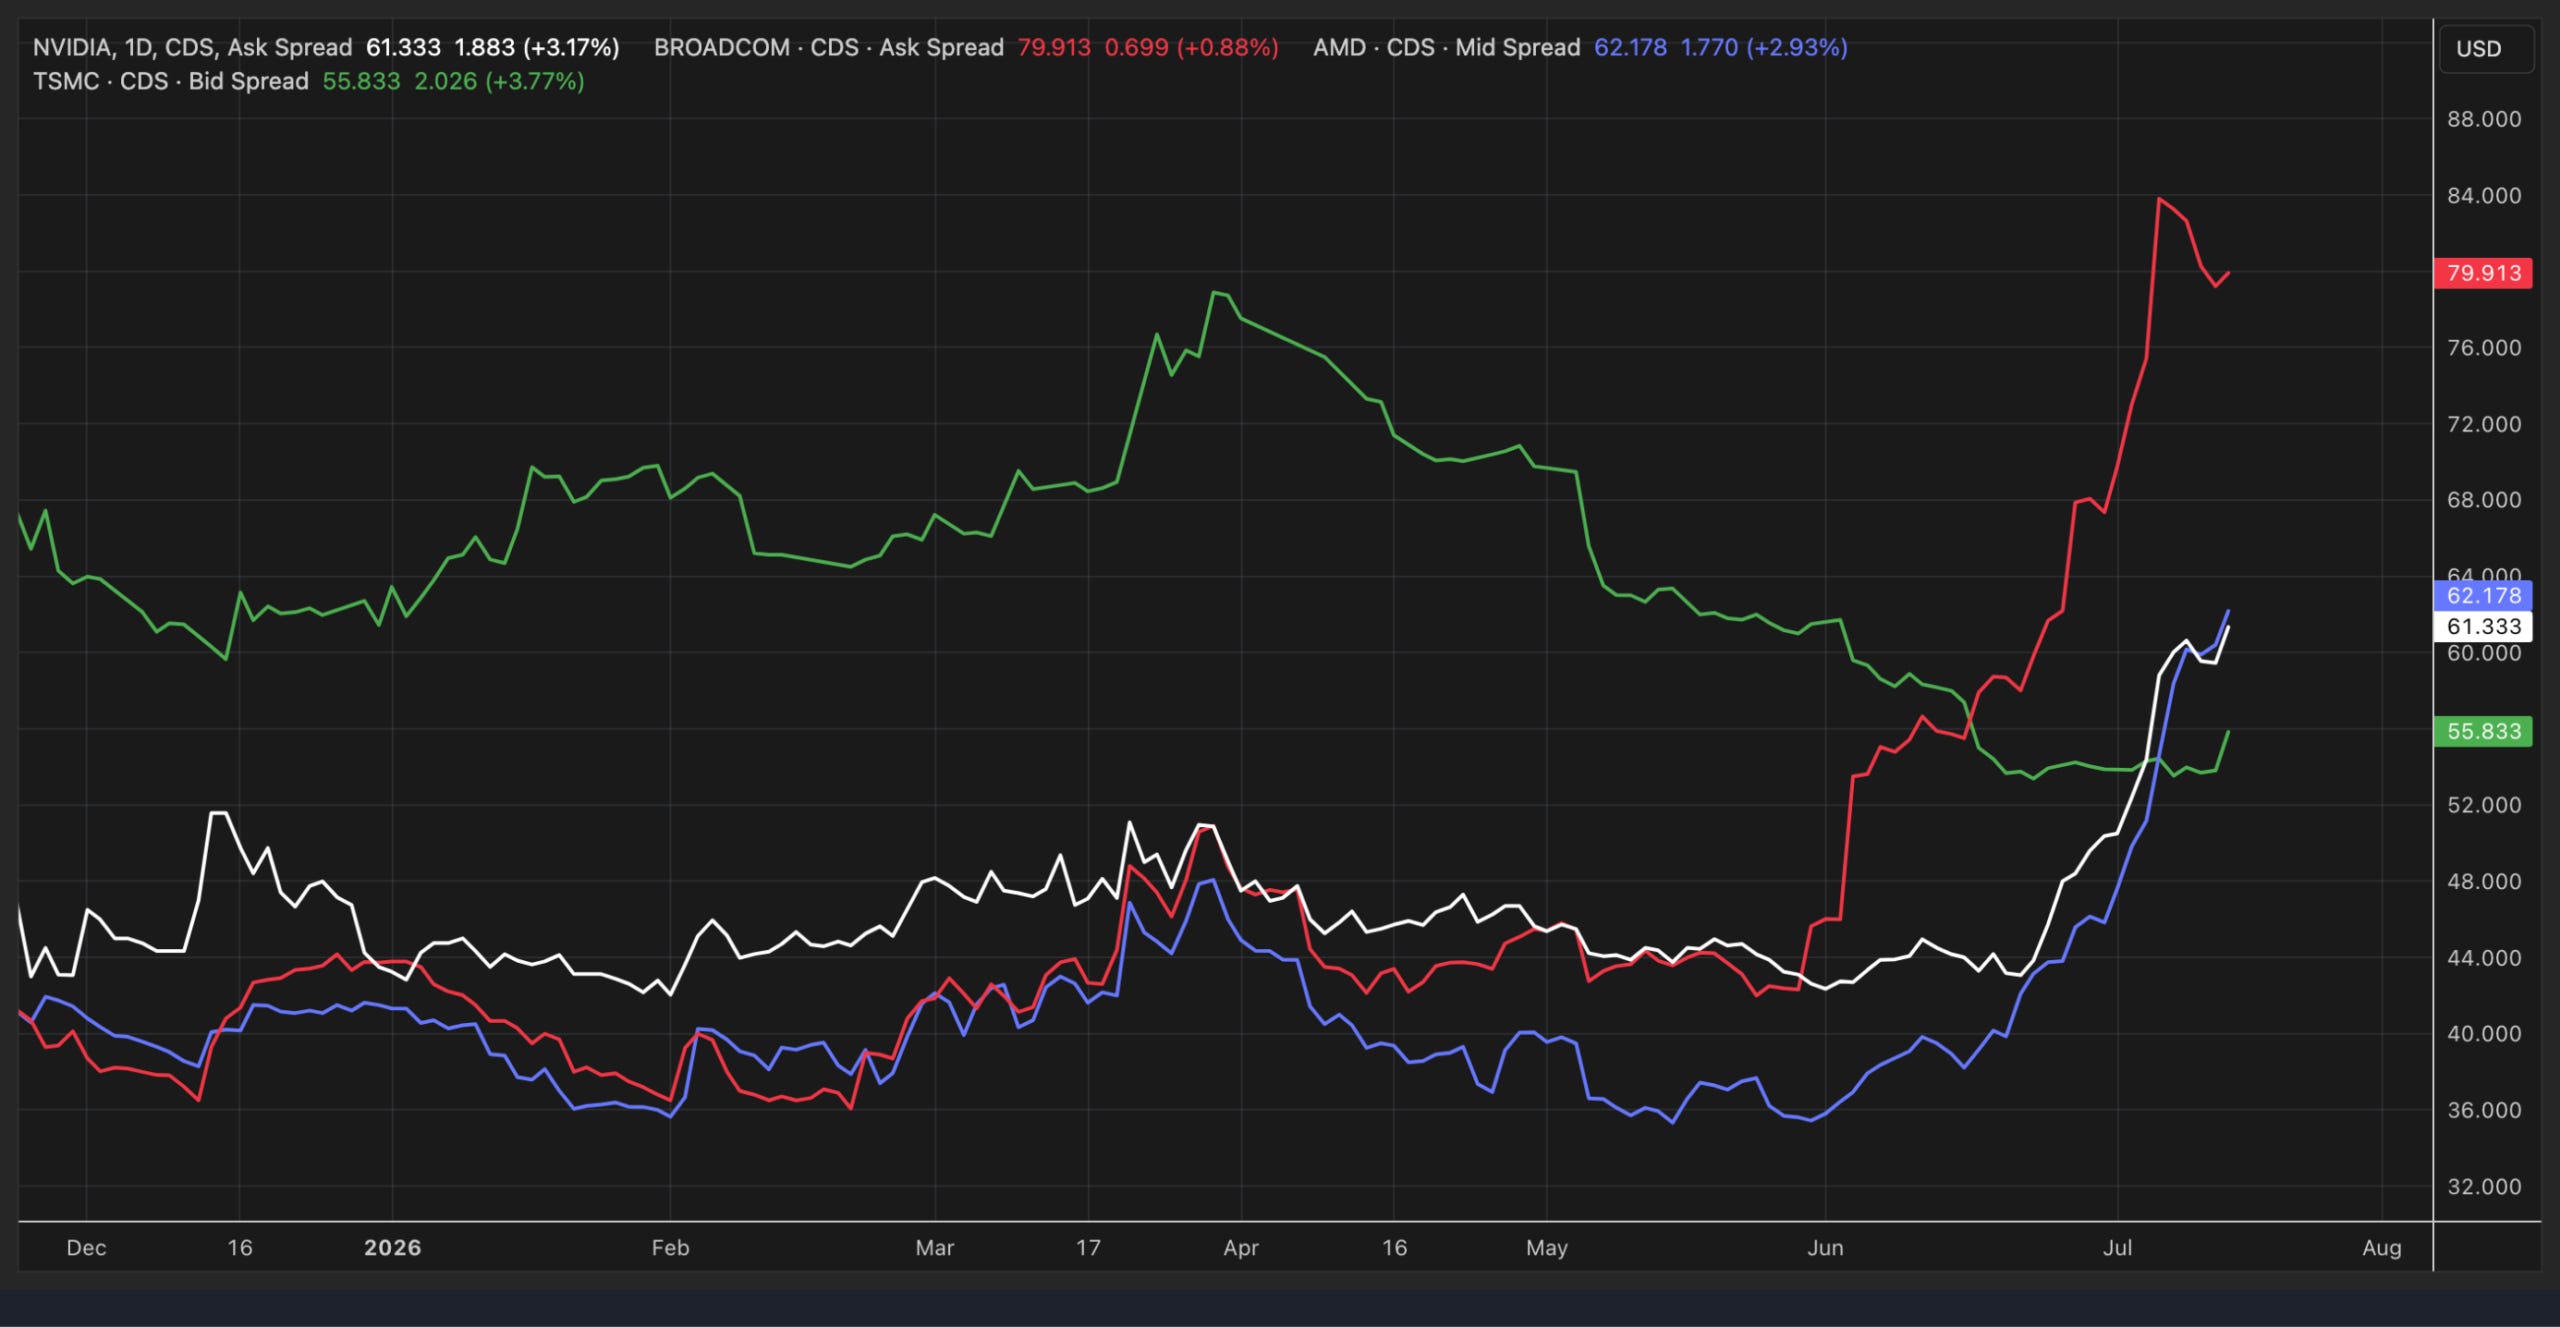
For the most part, their risk profiles are also rising, at least according to the CDS market.
-Mike
Glossary by ChatGPT
Basis Point (bp): One one-hundredth of a percentage point, equal to 0.01%.
Bollinger Band: A technical indicator that measures price volatility using bands plotted above and below a moving average.
CDS (Credit Default Swap): A derivative that reflects the market’s assessment of a borrower’s credit risk.
Implied Volatility: The market’s expectation of future price volatility derived from option prices.
KOSDAQ: South Korea’s technology- and growth-focused stock exchange, similar in profile to the Nasdaq.
KOSPI: South Korea’s primary stock market index, tracking the country’s largest listed companies.
Momentum Chasing: Buying assets primarily because prices are rising, rather than based on fundamental valuation.
RSI (Relative Strength Index): A momentum oscillator that measures the speed and magnitude of recent price movements to identify overbought or oversold conditions.
Semiconductor ETF (SMH): An exchange-traded fund tracking a basket of leading semiconductor companies.
Skew: An options-market measure comparing demand for downside versus upside protection, often used to gauge investor positioning and sentiment.
USD/KRW: The exchange rate between the U.S. dollar and the South Korean won.
Volatility Breadth: A measure of how broadly elevated implied volatility is across a group of stocks.
Disclosure
This report contains independent commentary to be used for informational and educational purposes only. Michael Kramer is a member and investment adviser representative with Mott Capital Management. Mr. Kramer is not affiliated with this company and does not serve on the board of any related company that issued this stock. All opinions and analyses presented by Michael Kramer in this analysis or market report are solely Michael Kramer’s views. Readers should not treat any opinion, viewpoint, or prediction expressed by Michael Kramer as a specific solicitation or recommendation to buy or sell a particular security or follow a particular strategy. Michael Kramer’s analyses are based upon information and independent research that he considers reliable, but neither Michael Kramer nor Mott Capital Management guarantees its completeness or accuracy, and it should not be relied upon as such. Michael Kramer is not under any obligation to update or correct any information presented in his analyses. Mr. Kramer’s statements, guidance, and opinions are subject to change without notice. Past performance is not indicative of future results. Neither Michael Kramer nor Mott Capital Management guarantees any specific outcome or profit. You should be aware of the real risk of loss in following any strategy or investment commentary presented in this analysis. Strategies or investments discussed may fluctuate in price or value. Investments or strategies mentioned in this analysis may not be suitable for you. This material does not consider your particular investment objectives, financial situation, or needs and is not intended as a recommendation appropriate for you. You must make an independent decision regarding investments or strategies in this analysis. Upon request, the advisor will provide a list of all recommendations made during the past twelve months. Before acting on information in this analysis, you should consider whether it is suitable for your circumstances and strongly consider seeking advice from your own financial or investment adviser to determine the suitability of any investment.