
Semiconductor Stocks Test Critical Support Levels

Please remember to subscribe to my Substack to receive this free daily commentary—which I work very hard to produce—directly in your inbox.
It was a mixed day of trading, even though the S&P 500 finished essentially flat. Semiconductor stocks were hit hard, with the SMH falling nearly 3% at one point.
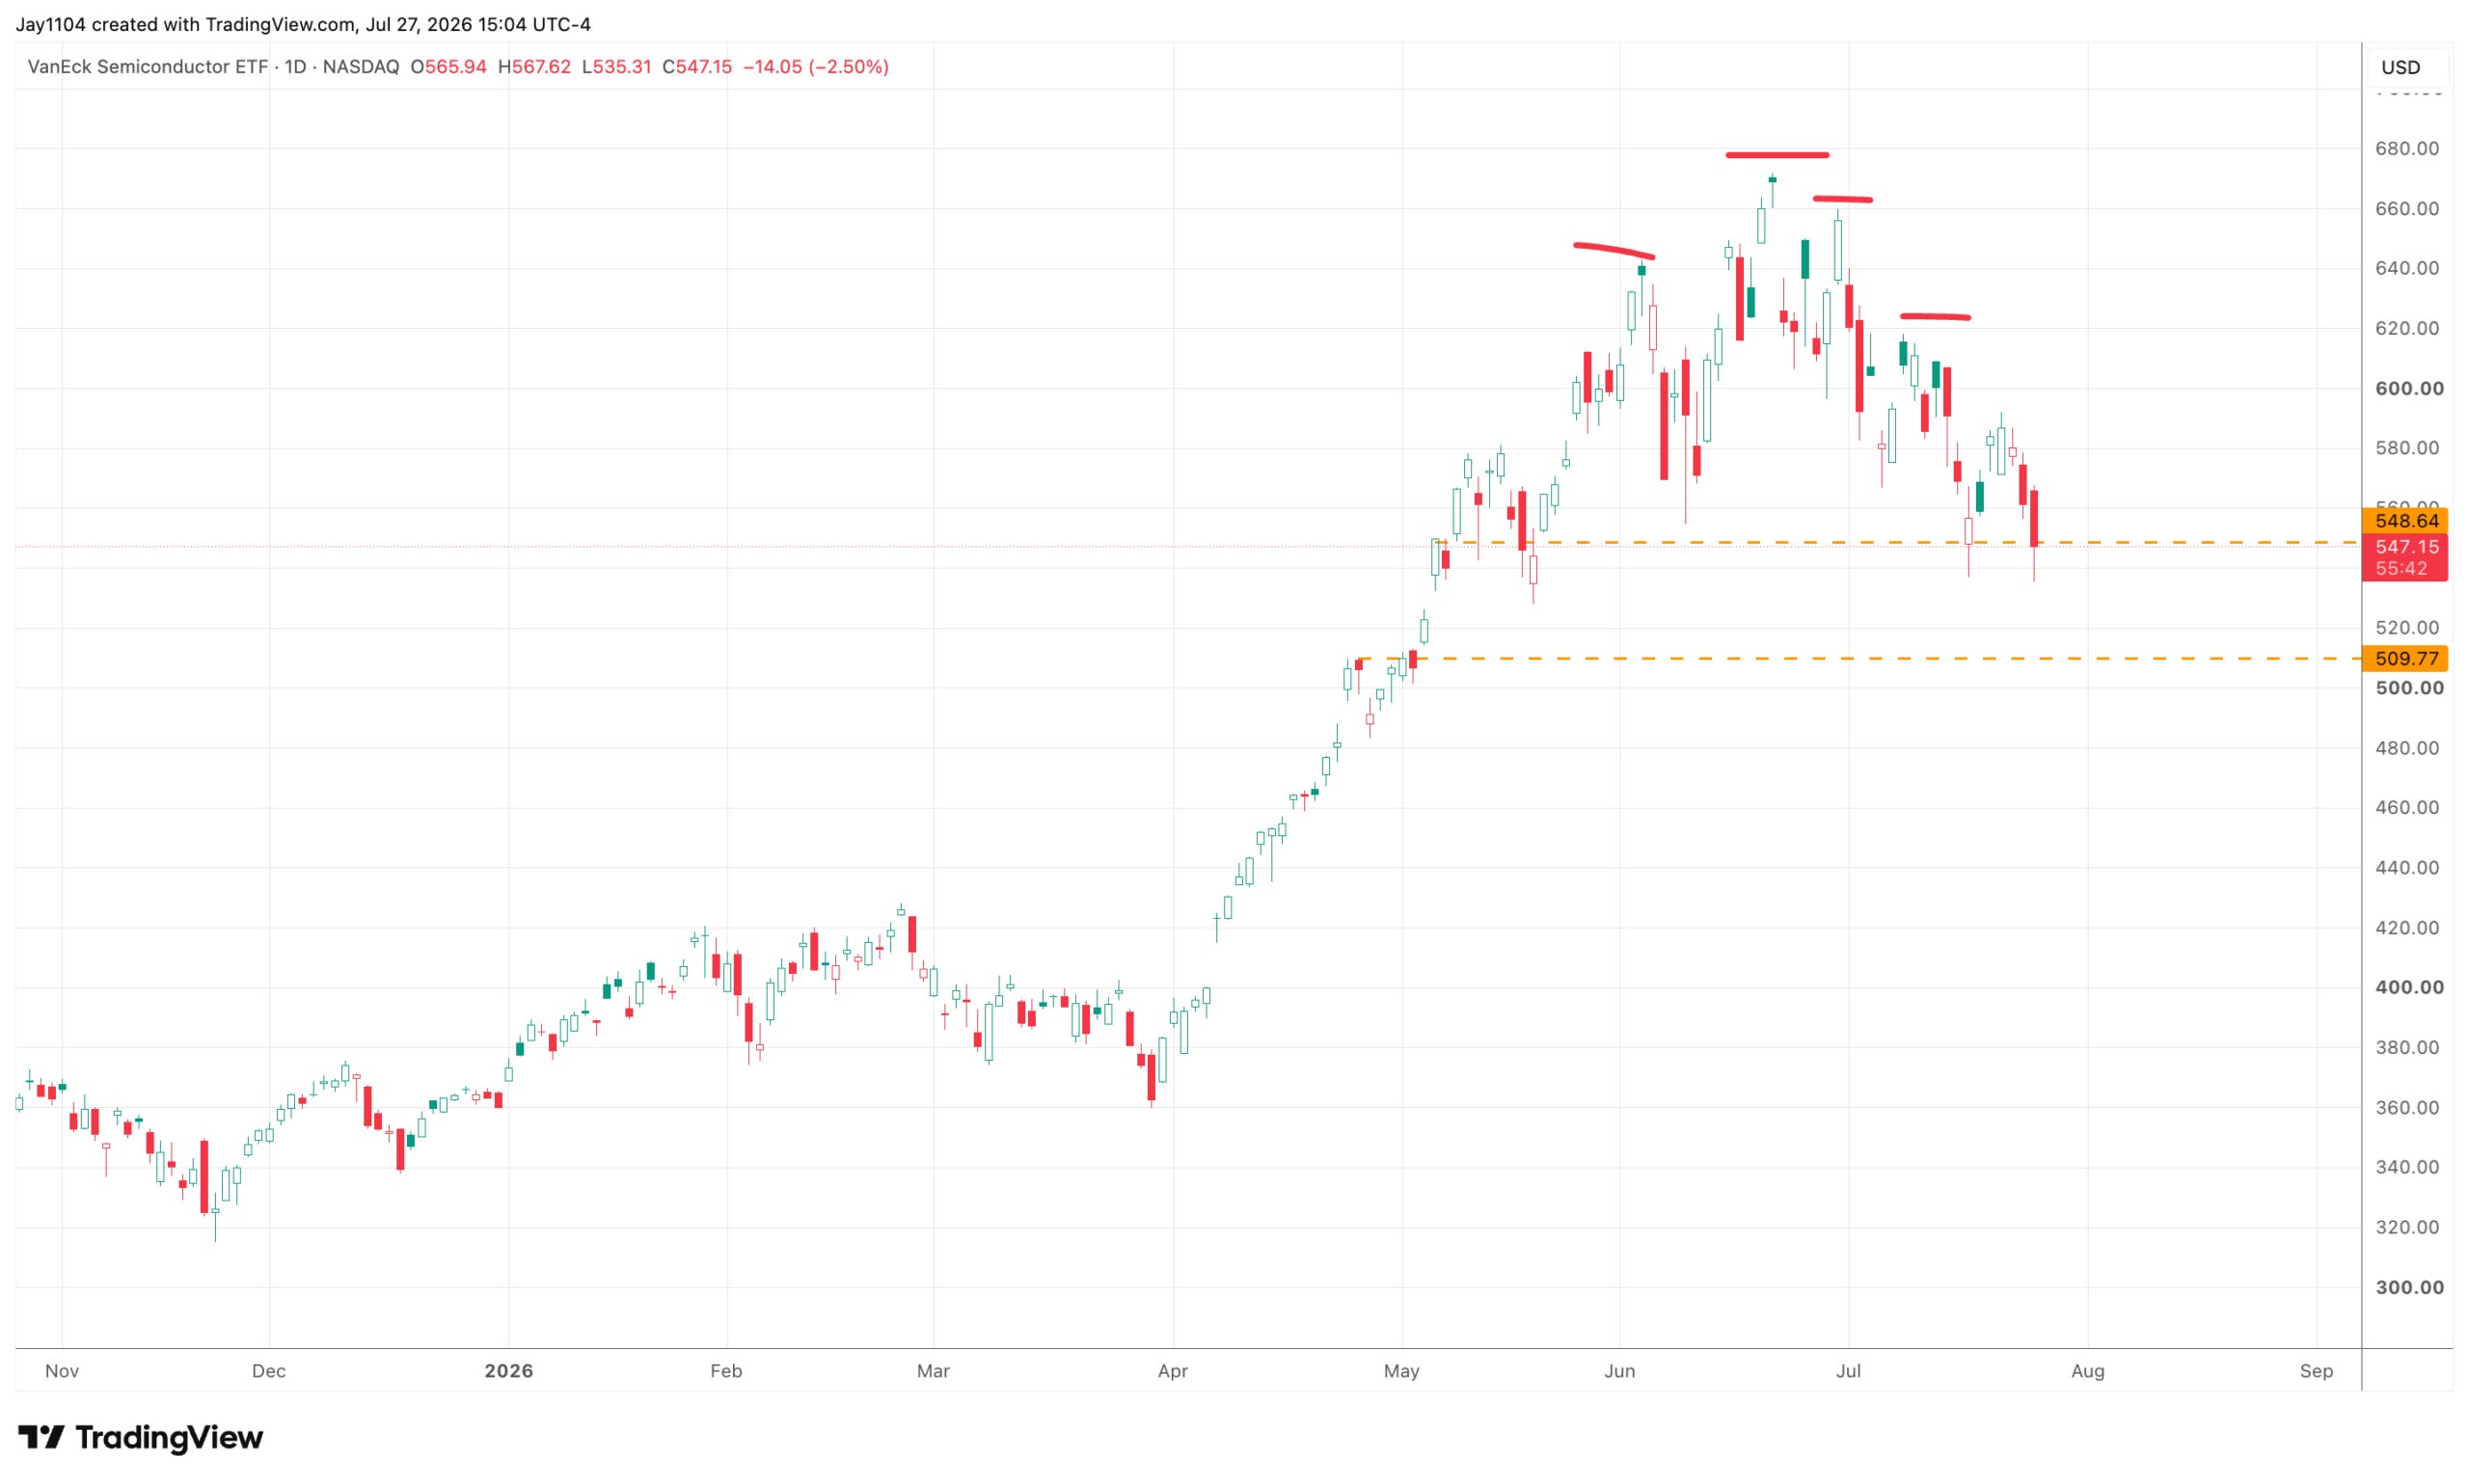
The SMH appears to be at risk as it tests support around $550, which looks to be the neckline of a potential head-and-shoulders pattern. The options market put wall for SMH sits near $520, while the next major technical support level is around $510. That makes the $510-$520 area the most likely downside target if the current pullback continues.
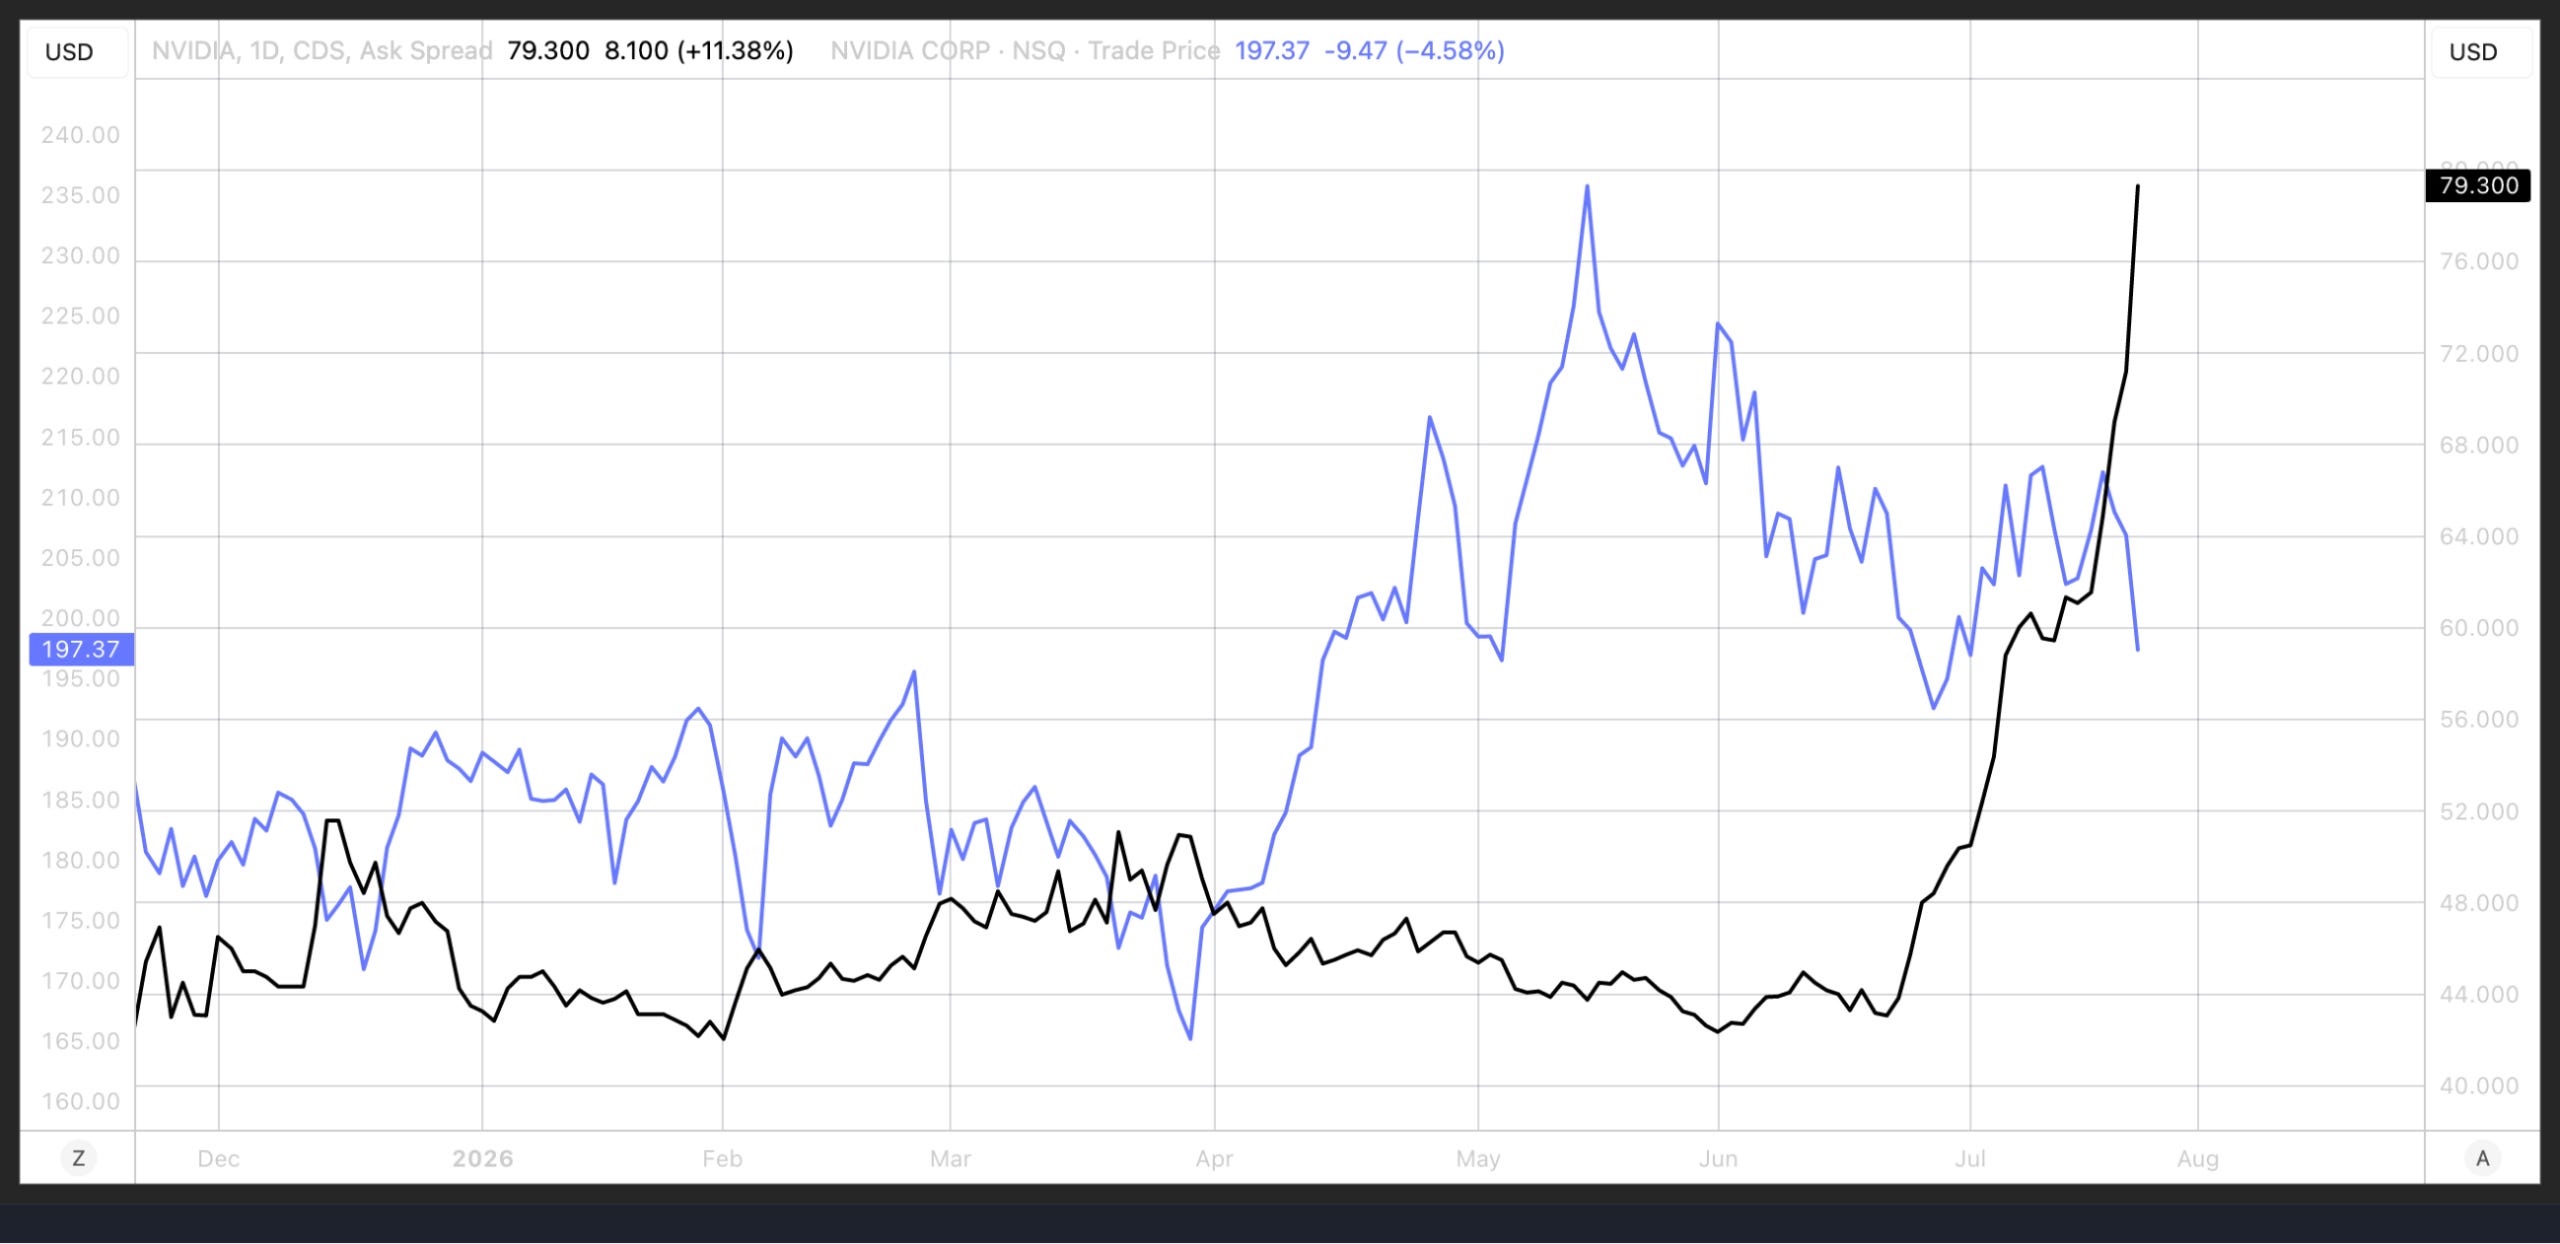
Nvidia’s announcement overnight that it is guaranteeing up to $250 billion for OpenAI’s data center expansion didn’t appear to be well received by the credit market. The company’s 5-year CDS spread widened again today, reaching 79.5 basis points. The stock also came under pressure, suggesting that, at least today, the widening in credit spreads is beginning to be reflected in the share price.
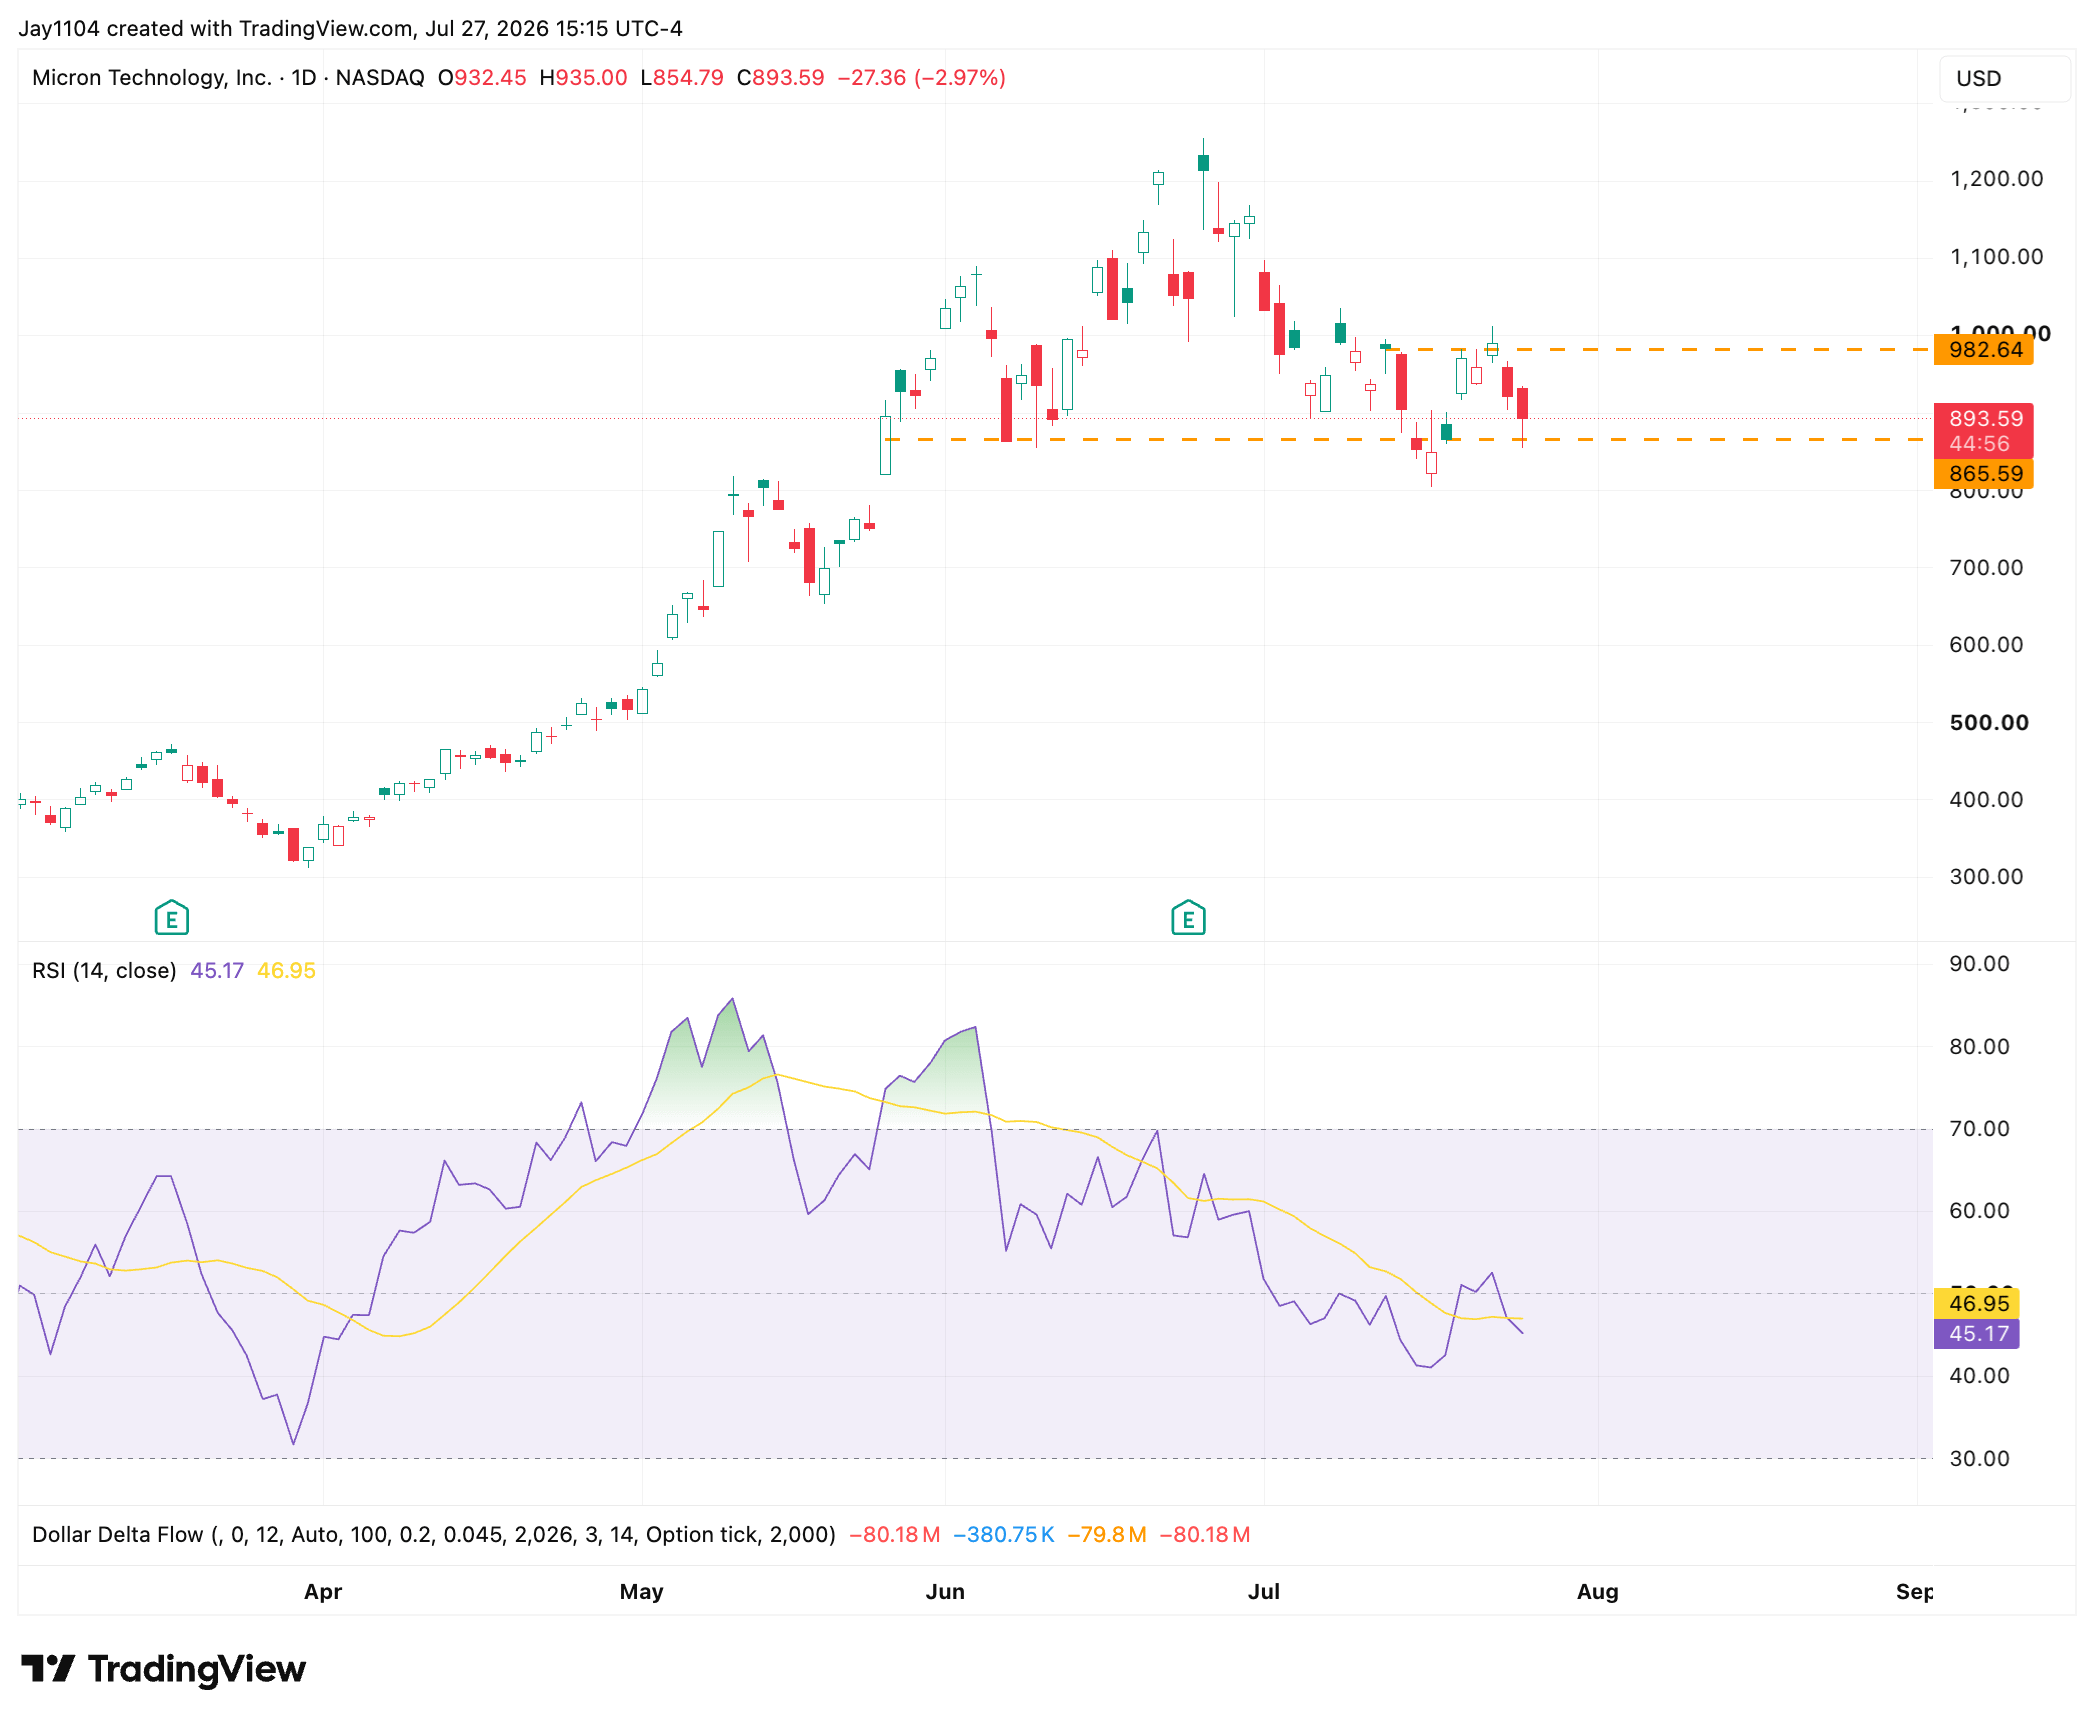
The same technical pattern seen in the SMH is also present in Micron, with a similar neckline around $870. However, Micron’s options put wall sits much lower, around $800, roughly 10% below the current share price. That suggests Micron has significantly more downside potential if the neckline support fails.
The rest of this week is packed with potential market-moving events, including earnings from Microsoft, Amazon, Meta, and Apple, as well as the FOMC and BOJ meetings and the release of the PCE inflation report.
On top of that, Treasury Tuesday brings $70.5 billion in T-bill settlements, followed by another $38.5 billion on Thursday. That combination of heavy Treasury settlements, major earnings, central bank meetings, and key economic data is likely to make for a challenging week for risk assets. With another wave of important economic data due in the first week of August and additional liquidity set to leave the financial system, next week may not prove much easier.
-Mike
Glossary by ChatGPT
BOJ (Bank of Japan): Japan’s central bank, responsible for setting monetary policy and interest rates.
CDS (Credit Default Swap): A financial contract that reflects the market’s assessment of a borrower’s credit risk.
FOMC (Federal Open Market Committee): The Federal Reserve committee that determines U.S. monetary policy.
Head-and-Shoulders Pattern: A technical chart formation that can signal a potential reversal from an uptrend to a downtrend.
Liquidity: The availability of cash and funding within the financial system that supports trading and investment activity.
Neckline: A support or resistance level in a chart pattern whose break often confirms the pattern.
PCE Inflation Report: The Personal Consumption Expenditures Price Index, the Federal Reserve’s preferred measure of inflation.
Put Wall: An options strike with significant put open interest that may act as a potential price support level.
Risk Assets: Investments such as stocks and high-yield bonds whose prices are more sensitive to economic and financial conditions.
SMH: The VanEck Semiconductor ETF, a widely followed exchange-traded fund tracking the semiconductor industry.
T-Bill (Treasury Bill): A short-term U.S. government debt security with a maturity of one year or less.
Disclosure
This report contains independent commentary to be used for informational and educational purposes only. Michael Kramer is a member and investment adviser representative with Mott Capital Management. Mr. Kramer is not affiliated with this company and does not serve on the board of any related company that issued this stock. All opinions and analyses presented by Michael Kramer in this analysis or market report are solely Michael Kramer’s views. Readers should not treat any opinion, viewpoint, or prediction expressed by Michael Kramer as a specific solicitation or recommendation to buy or sell a particular security or follow a particular strategy. Michael Kramer’s analyses are based upon information and independent research that he considers reliable, but neither Michael Kramer nor Mott Capital Management guarantees its completeness or accuracy, and it should not be relied upon as such. Michael Kramer is not under any obligation to update or correct any information presented in his analyses. Mr. Kramer’s statements, guidance, and opinions are subject to change without notice. Past performance is not indicative of future results. Neither Michael Kramer nor Mott Capital Management guarantees any specific outcome or profit. You should be aware of the real risk of loss in following any strategy or investment commentary presented in this analysis. Strategies or investments discussed may fluctuate in price or value. Investments or strategies mentioned in this analysis may not be suitable for you. This material does not consider your particular investment objectives, financial situation, or needs and is not intended as a recommendation appropriate for you. You must make an independent decision regarding investments or strategies in this analysis. Upon request, the advisor will provide a list of all recommendations made during the past twelve months. Before acting on information in this analysis, you should consider whether it is suitable for your circumstances and strongly consider seeking advice from your own financial or investment adviser to determine the suitability of any investment.
Original Post on Semiconductor Stocks Test Critical Support Levels