
S&P 500 Tests Key Support as CPI and Oil Take Focus

Try Navigating The Markets For Free… Get a 2Day Free Trial

Stocks finished the day lower, with the S&P 500 falling by more than 1.6%. The move came despite a CPI report that was largely in line with expectations. The only notable surprise was core CPI, which rose by 0.2% month over month, slightly below estimates of 0.3%. The drop in the market likely had little to do with the CPI report and more to do with the rising tension in the Middle East.
The bigger takeaway is that headline inflation has been running at more than an 8% annualized rate over the past three months, while core CPI has been running at roughly a 3.2% annualized pace. That suggests underlying inflation pressures remain elevated, even if the monthly data did not deliver any major surprises.

Looking at CPI swaps for June is probably still a bit premature, but for now, the market is pricing year-over-year inflation at around 4%, which would actually be a modest improvement. However, we are only midway through the month, and gasoline prices have been declining until recently.
Today, gasoline prices rose by roughly 3%, with RBOB reaching resistance at its 10-day exponential moving average. If gasoline prices continue to move higher from here, I would expect inflation swaps to begin pricing in higher headline inflation readings as well.
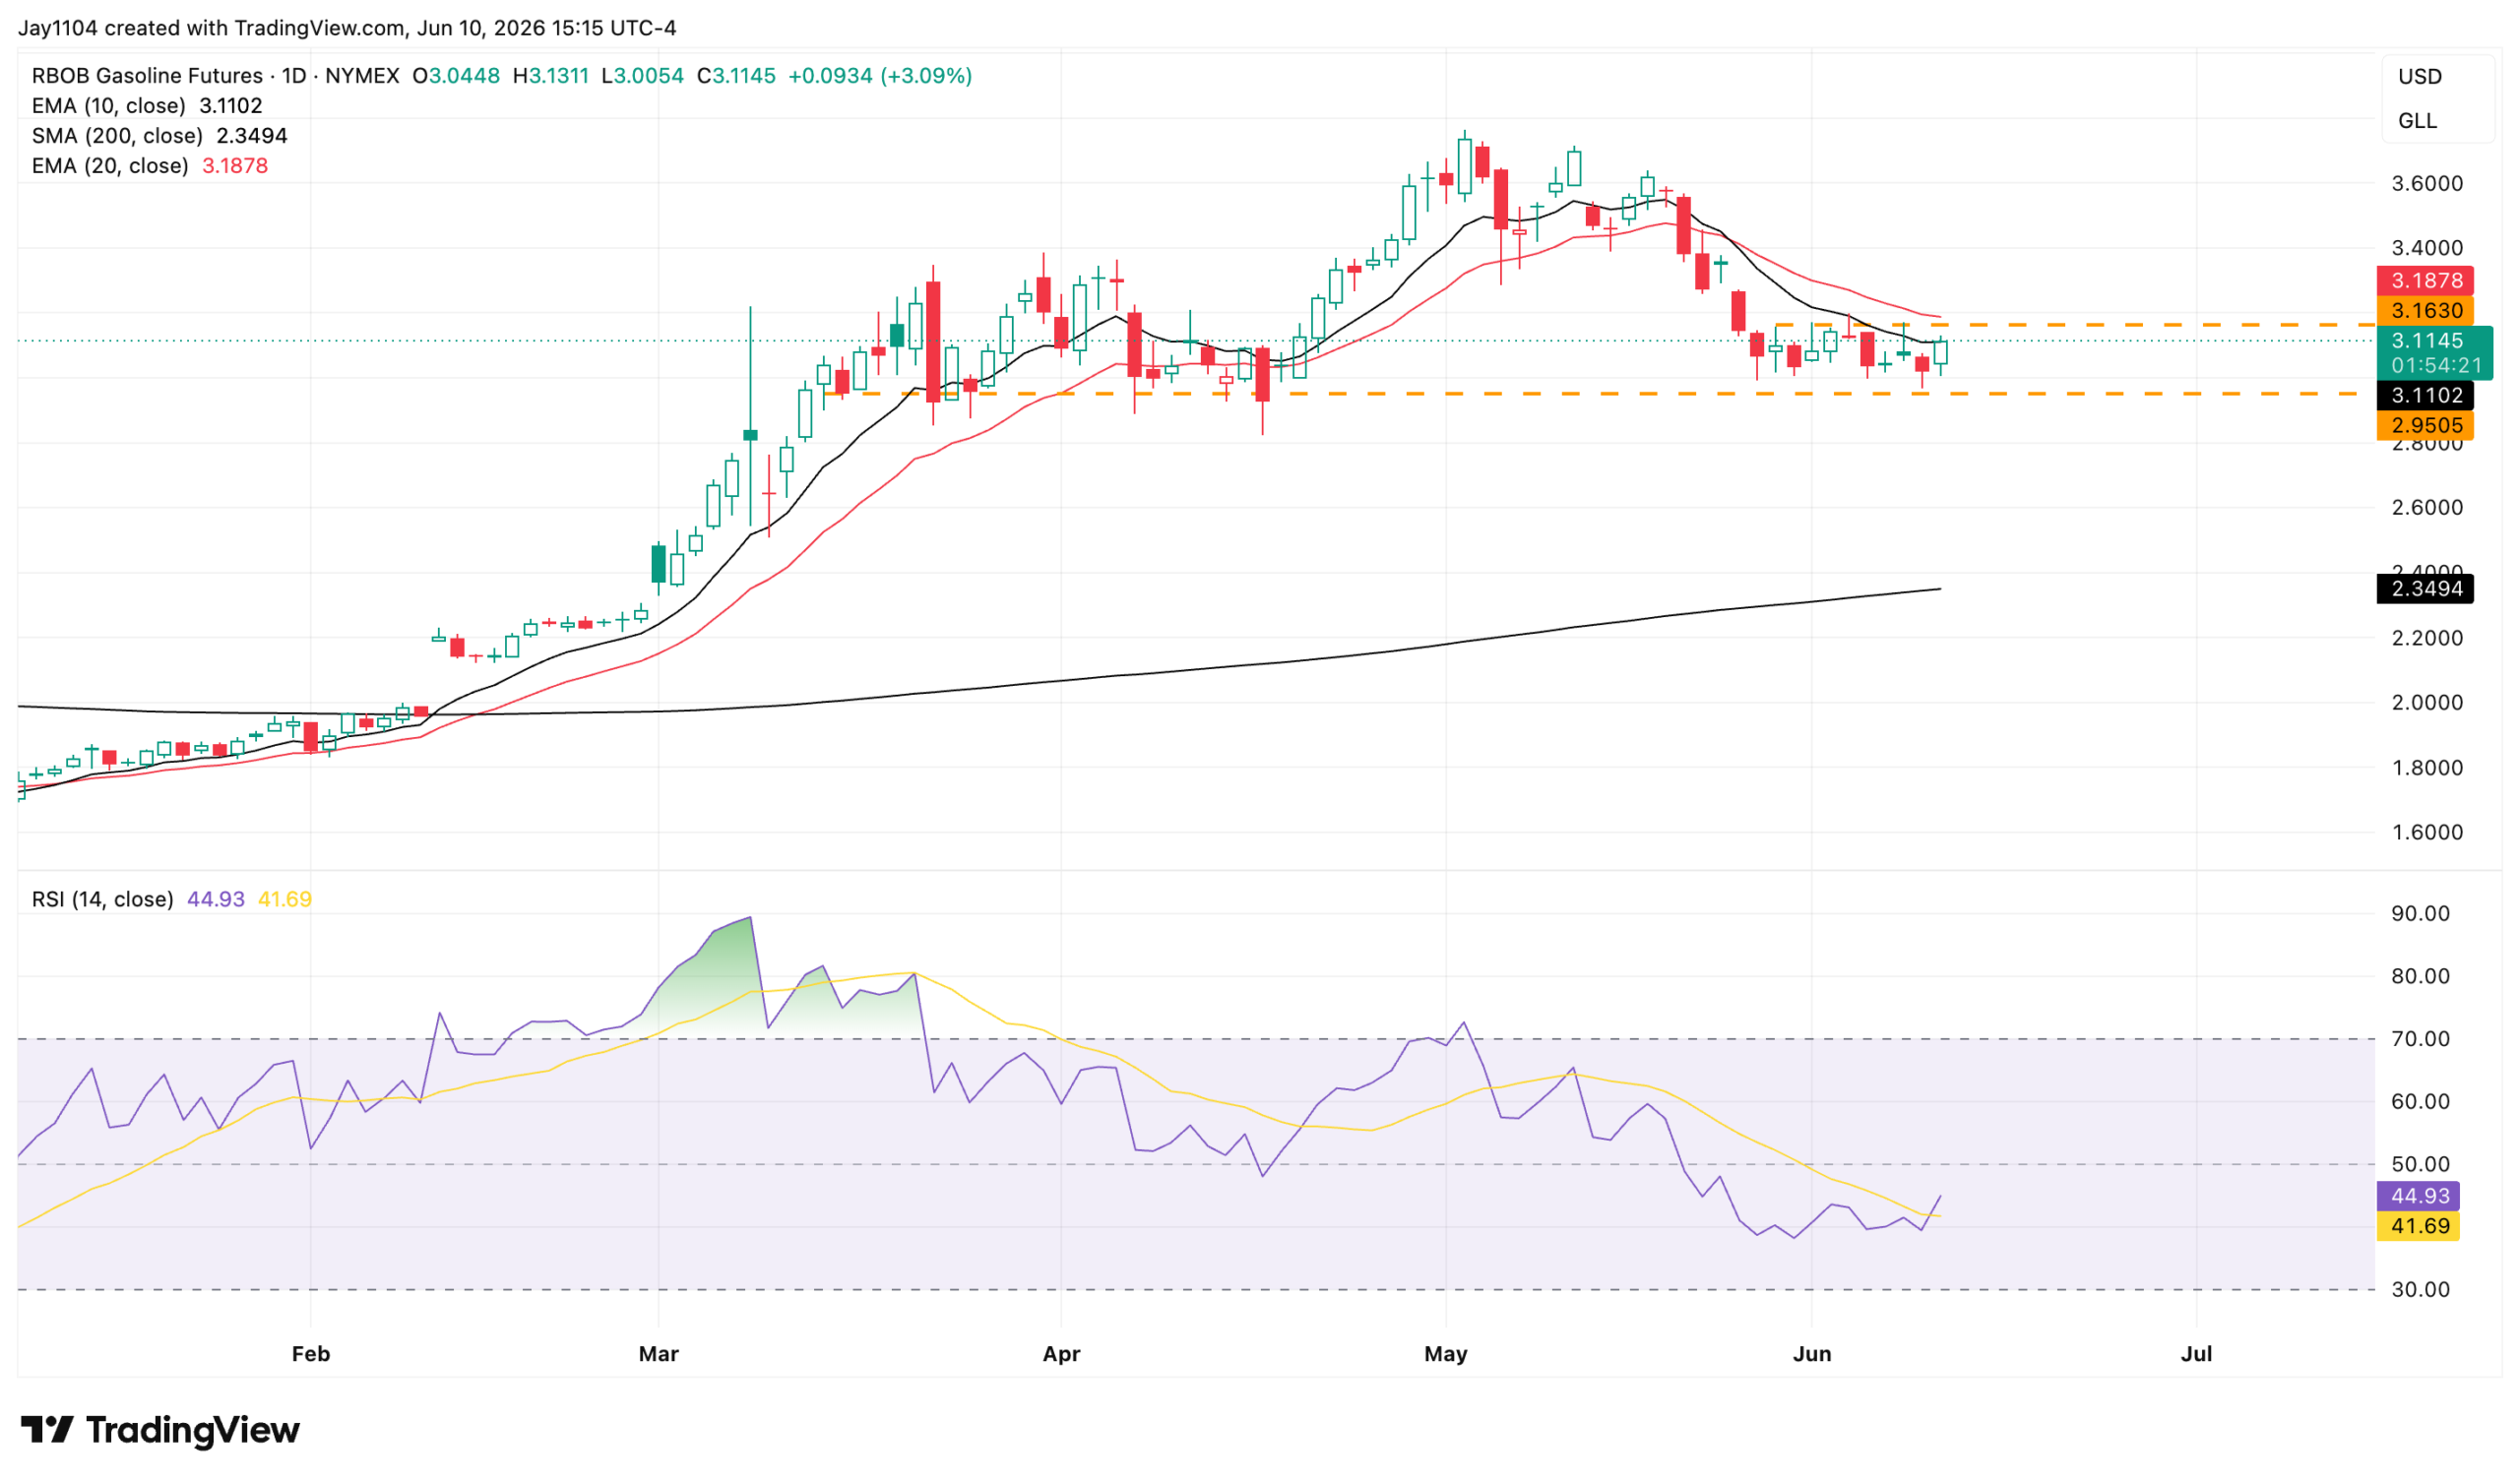
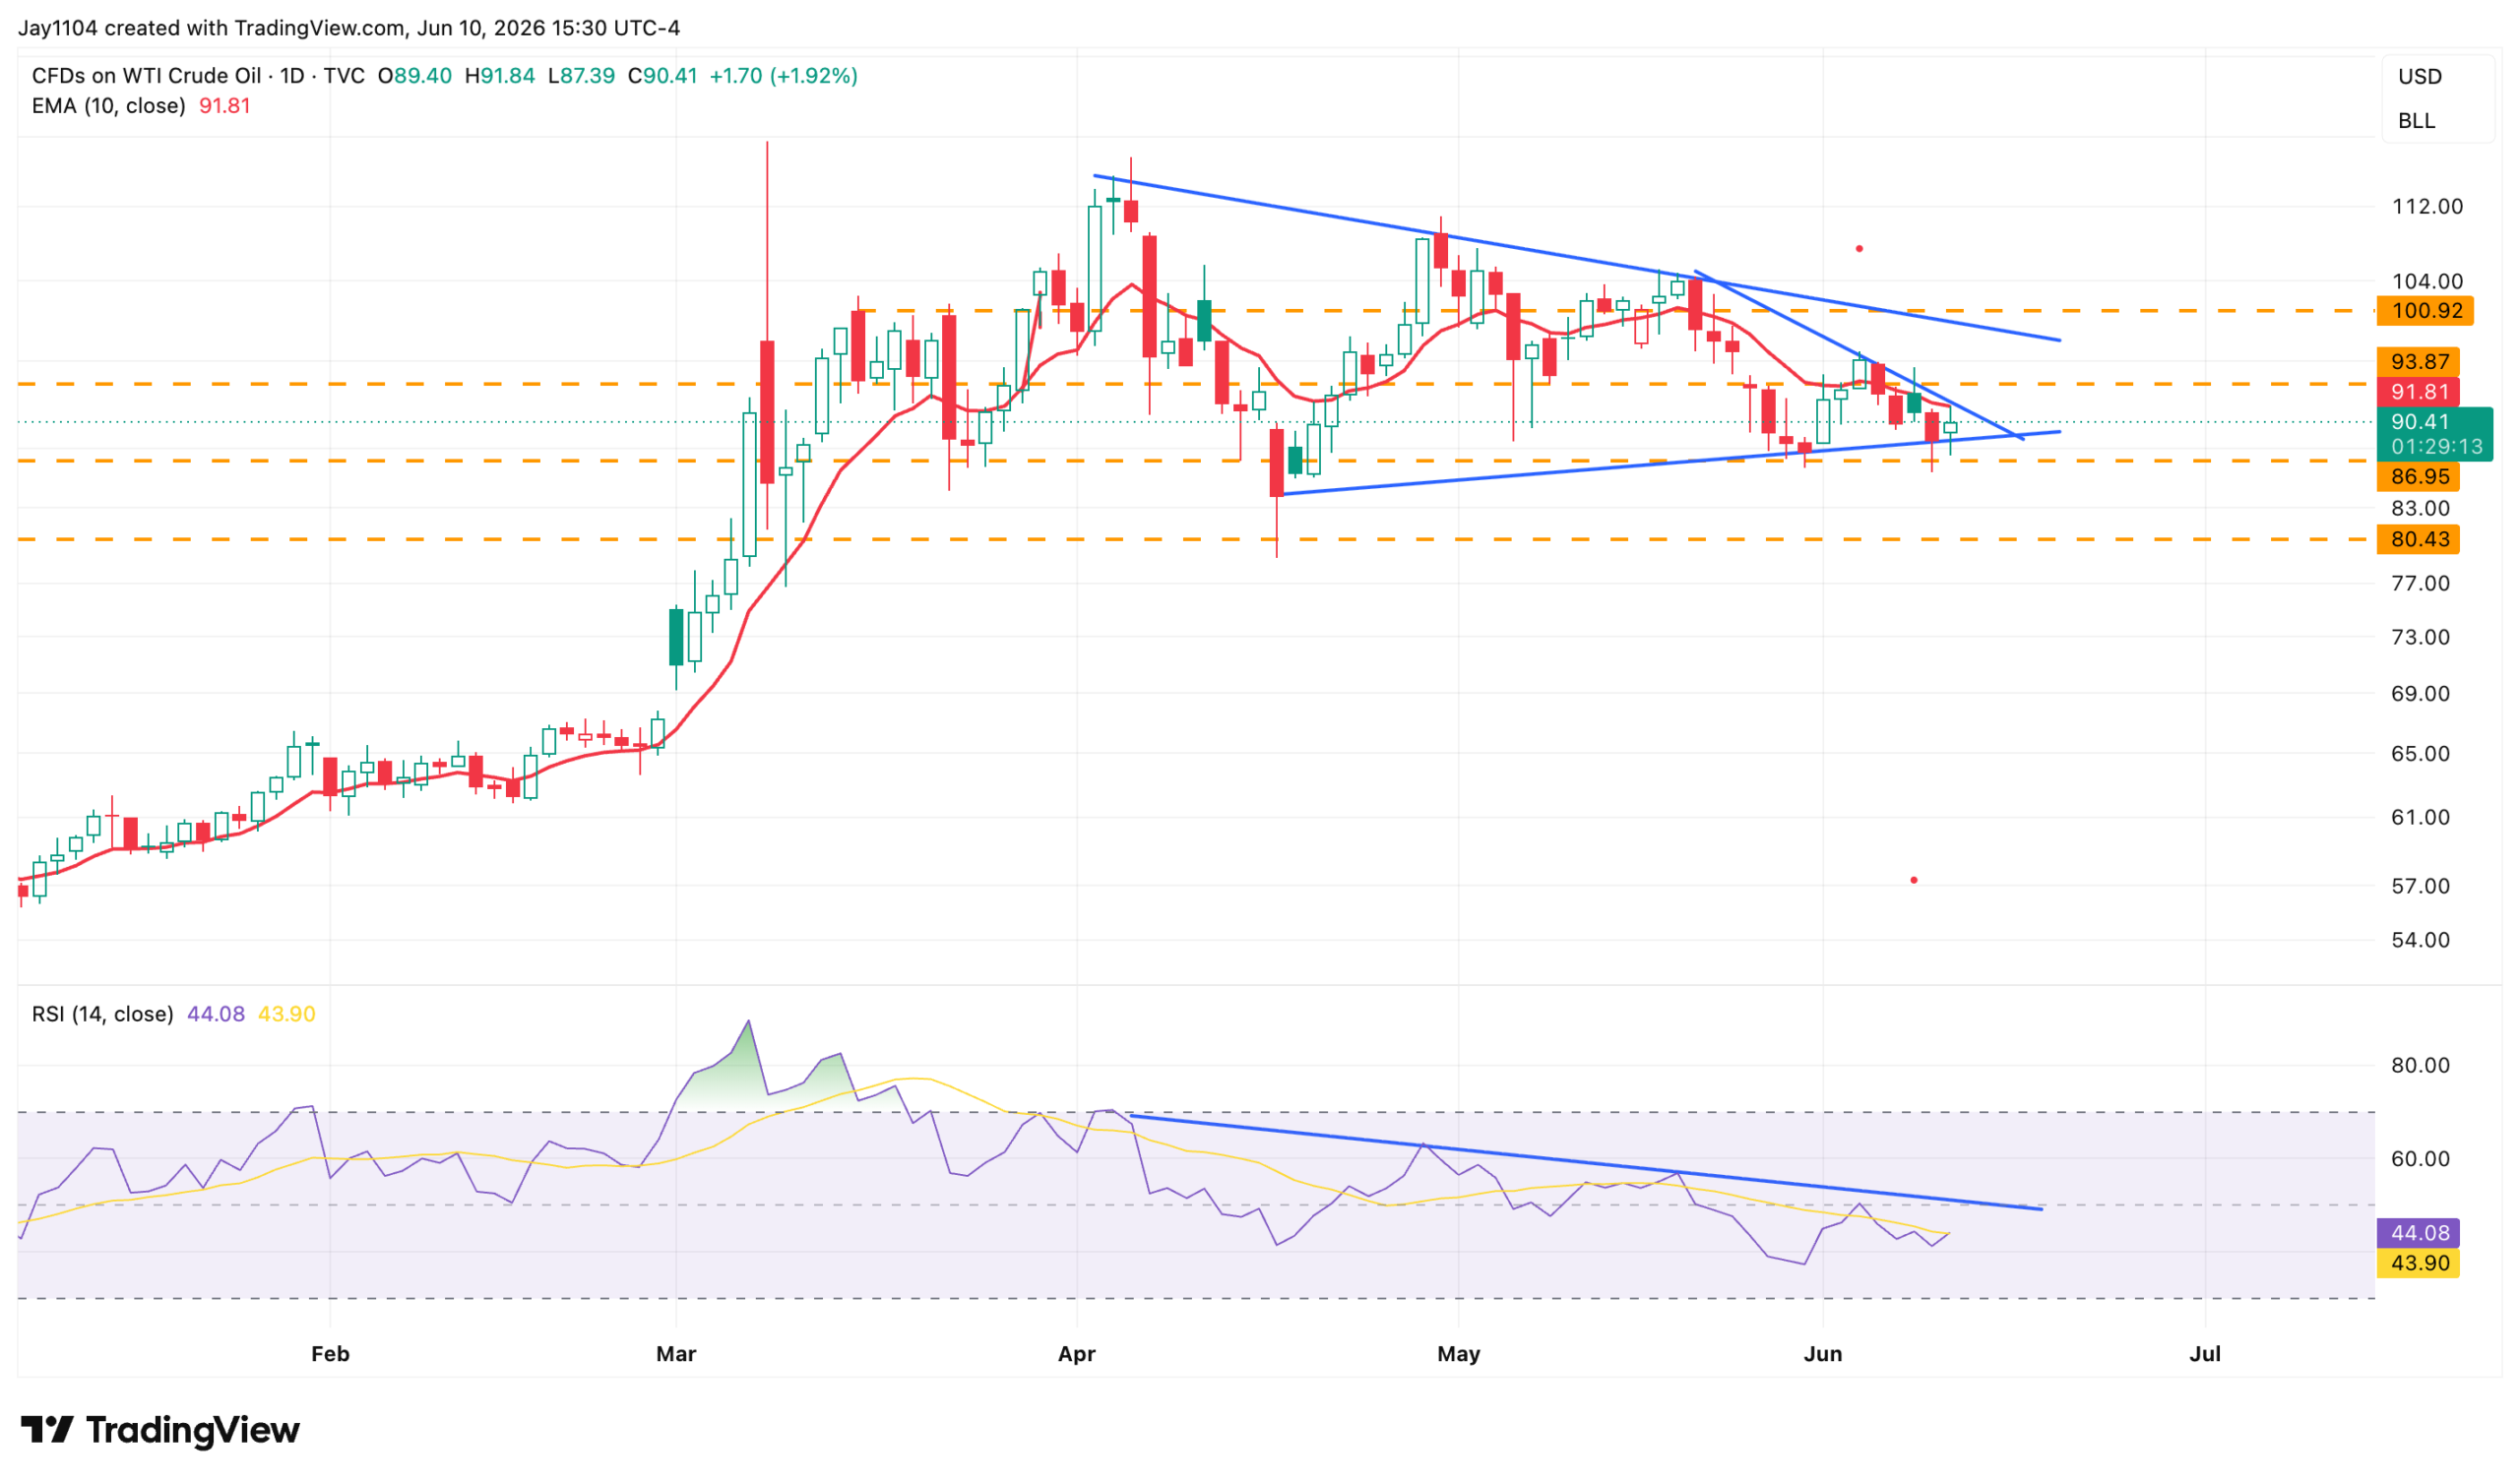
Where inflation goes from here will largely depend on what happens to gasoline and oil prices. Right now, tensions in the Middle East are escalating again, and oil prices are rising. Not by much, but the chart remains bullish in my view, and I still think oil ultimately heads higher over time.
For now, oil appears to be consolidating just below its 10-day exponential moving average in what looks like a triangle pattern. A breakout from that formation could signal the next leg higher and potentially put a move back above $100 per barrel into play.
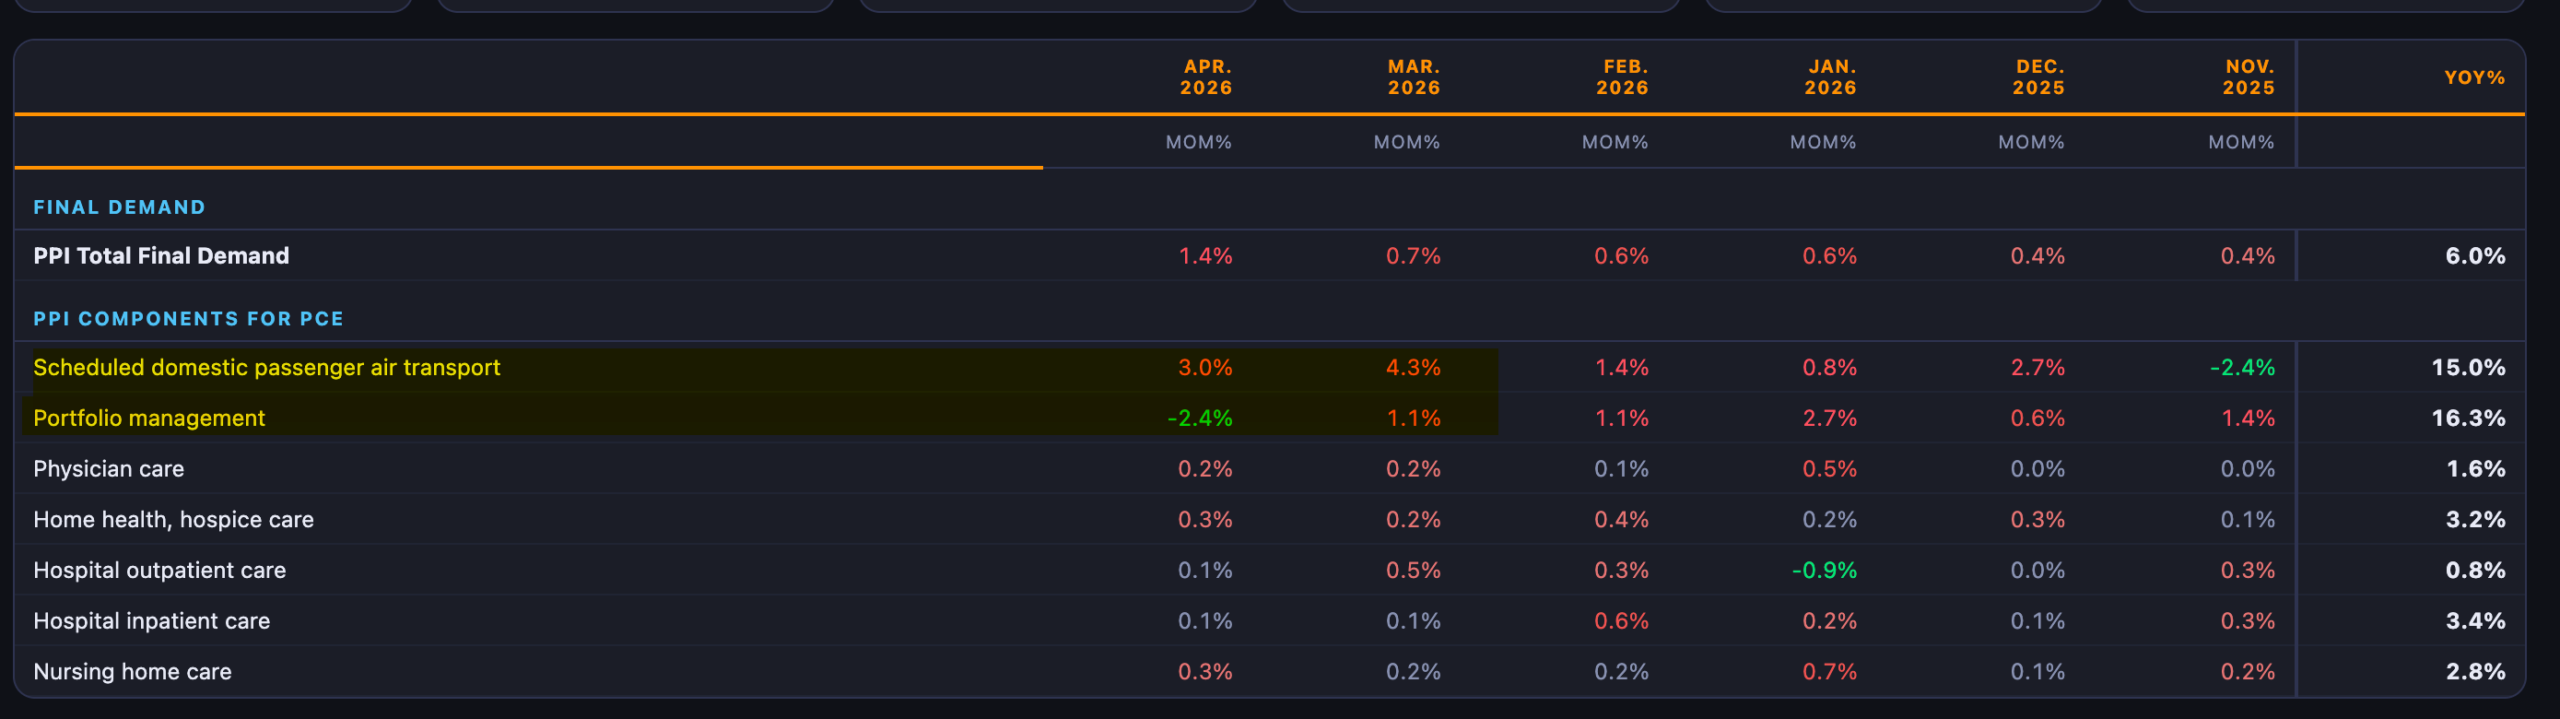
Tomorrow brings the PPI report, and there are a few components the market is likely to focus on more than others—namely, those that feed directly into the PCE report. One of the most important will be portfolio management fees.
Given the stock market’s sharp rally in April and May, there is a good chance that strength could show up in portfolio management fees. Because those fees feed into the PCE calculation, a strong upside reading could have implications for future PCE inflation readings, which is why the market will be paying close attention.
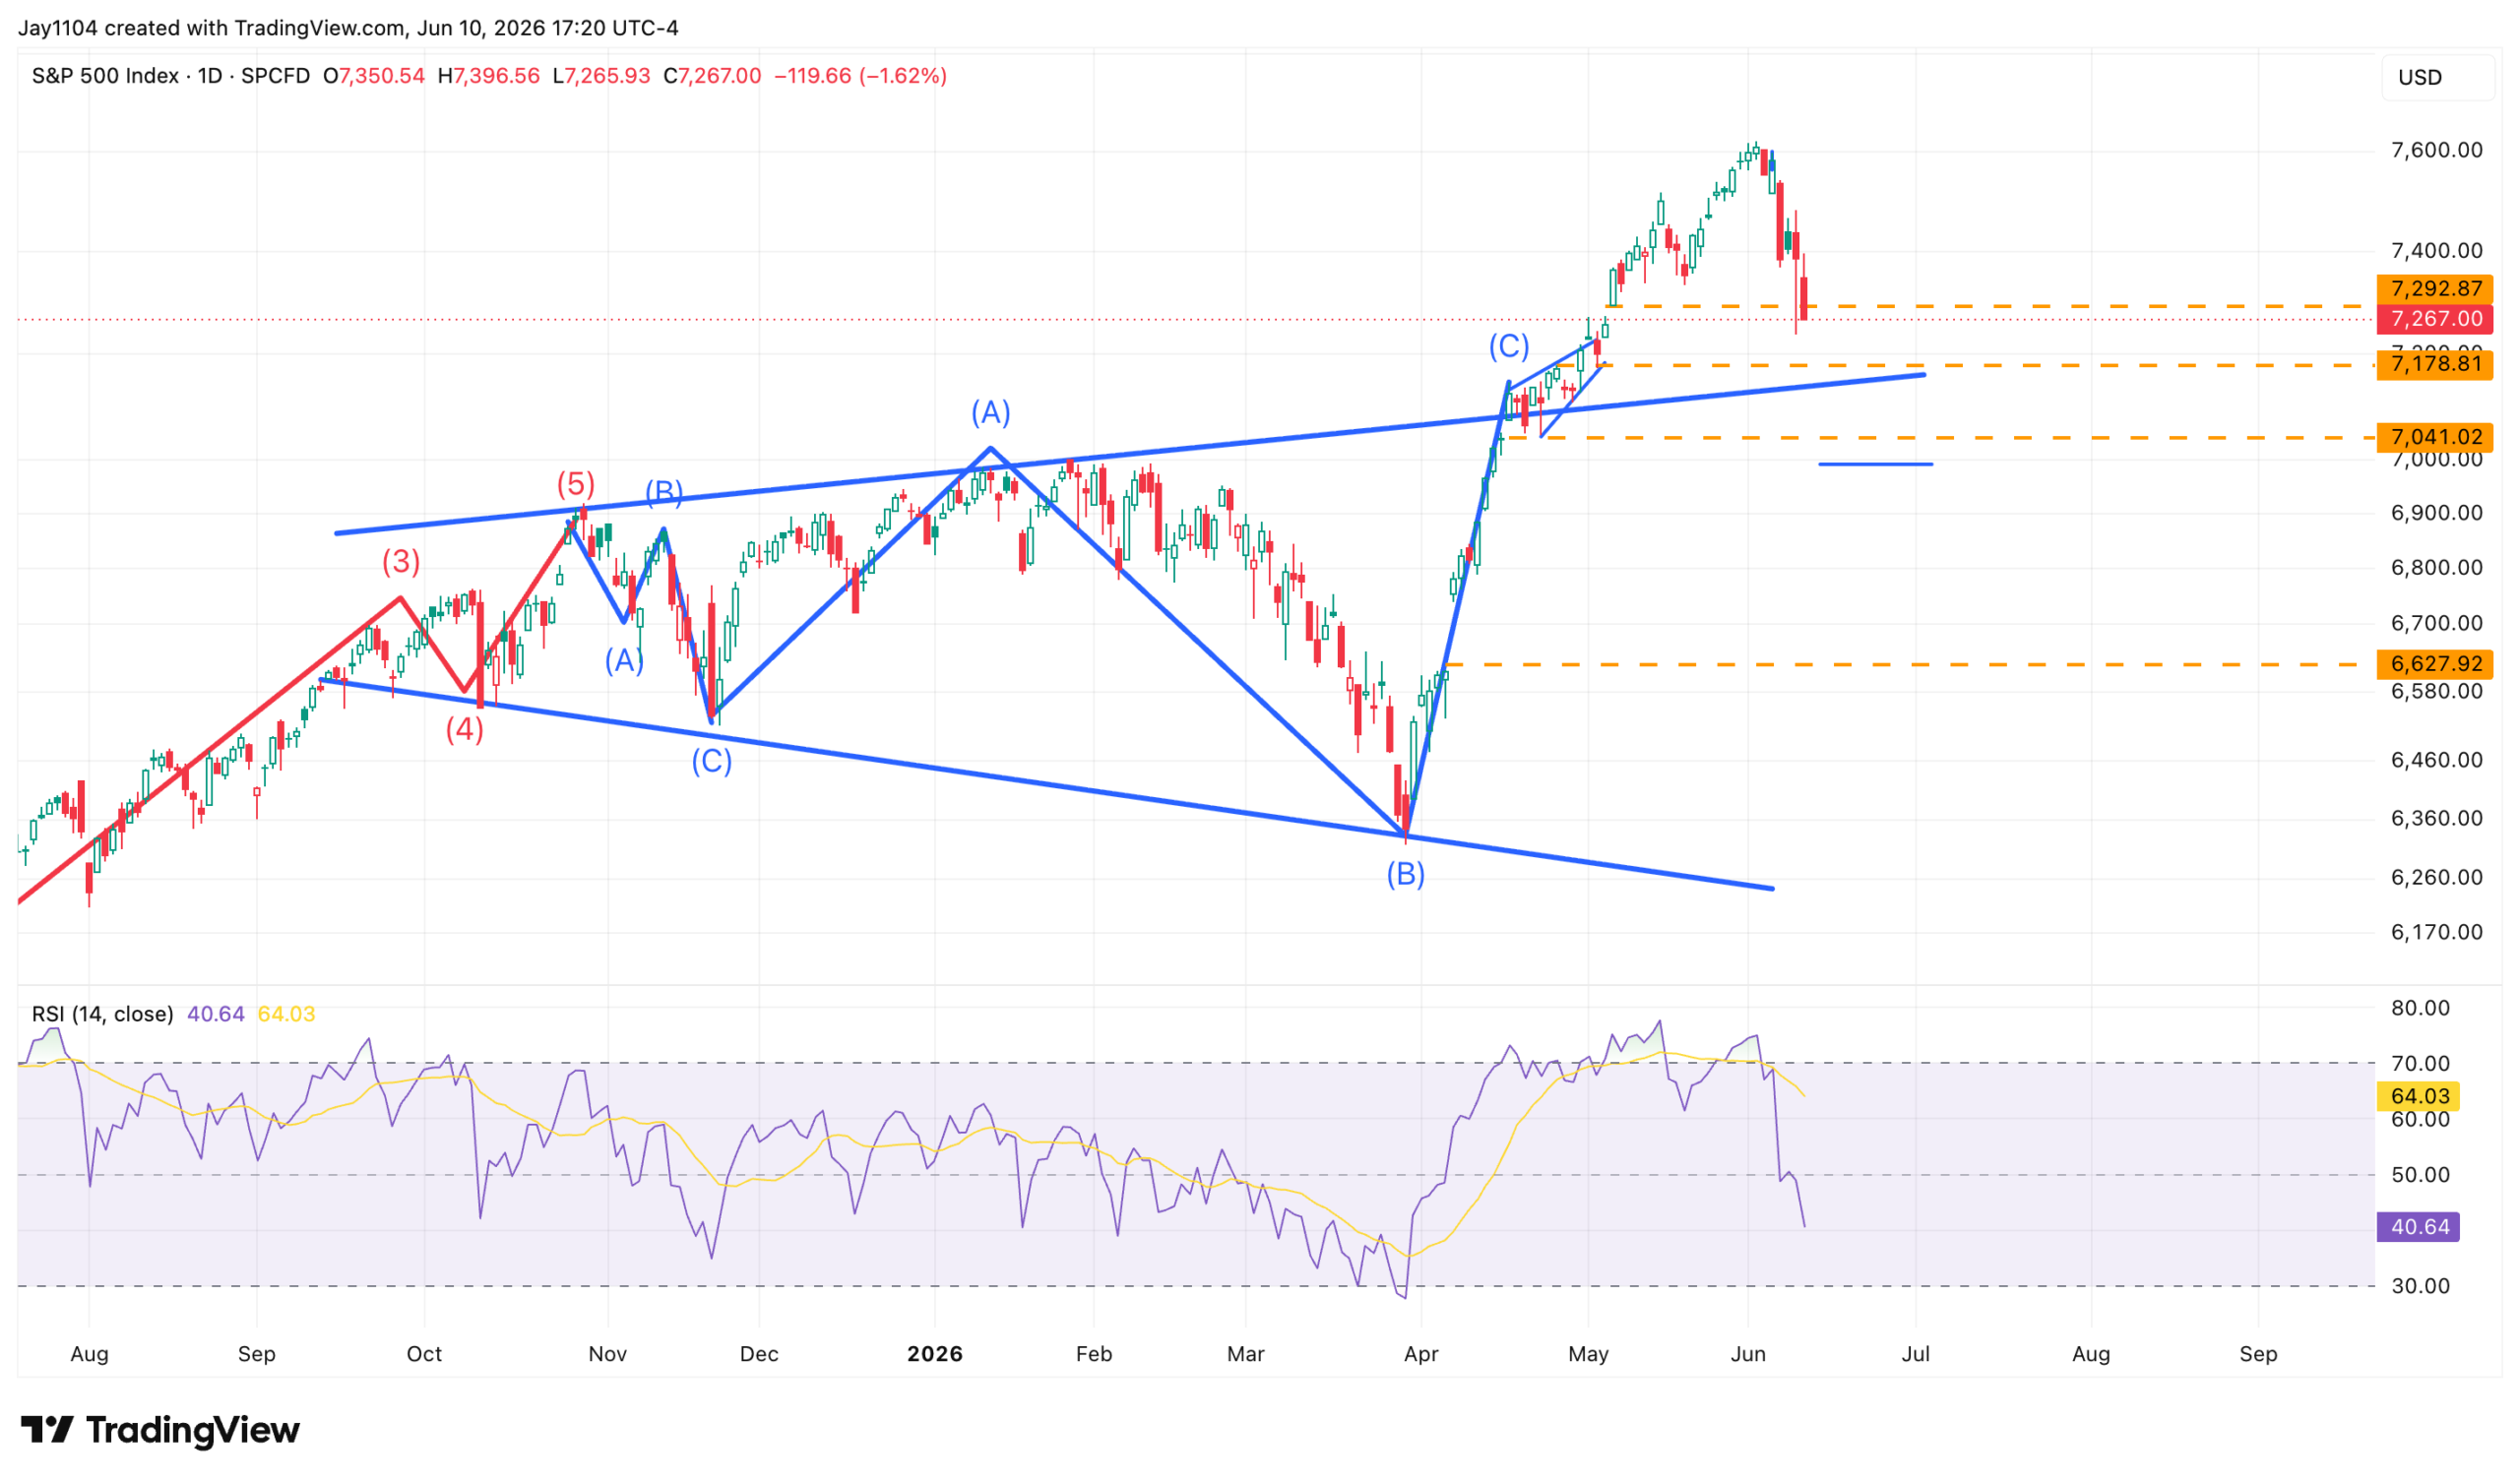
As for the S&P 500, it has closed below the 7,300 put wall, which could allow the index to move lower toward 7,200. That does not necessarily mean the market will decline, but it does open the door for further downside from here.
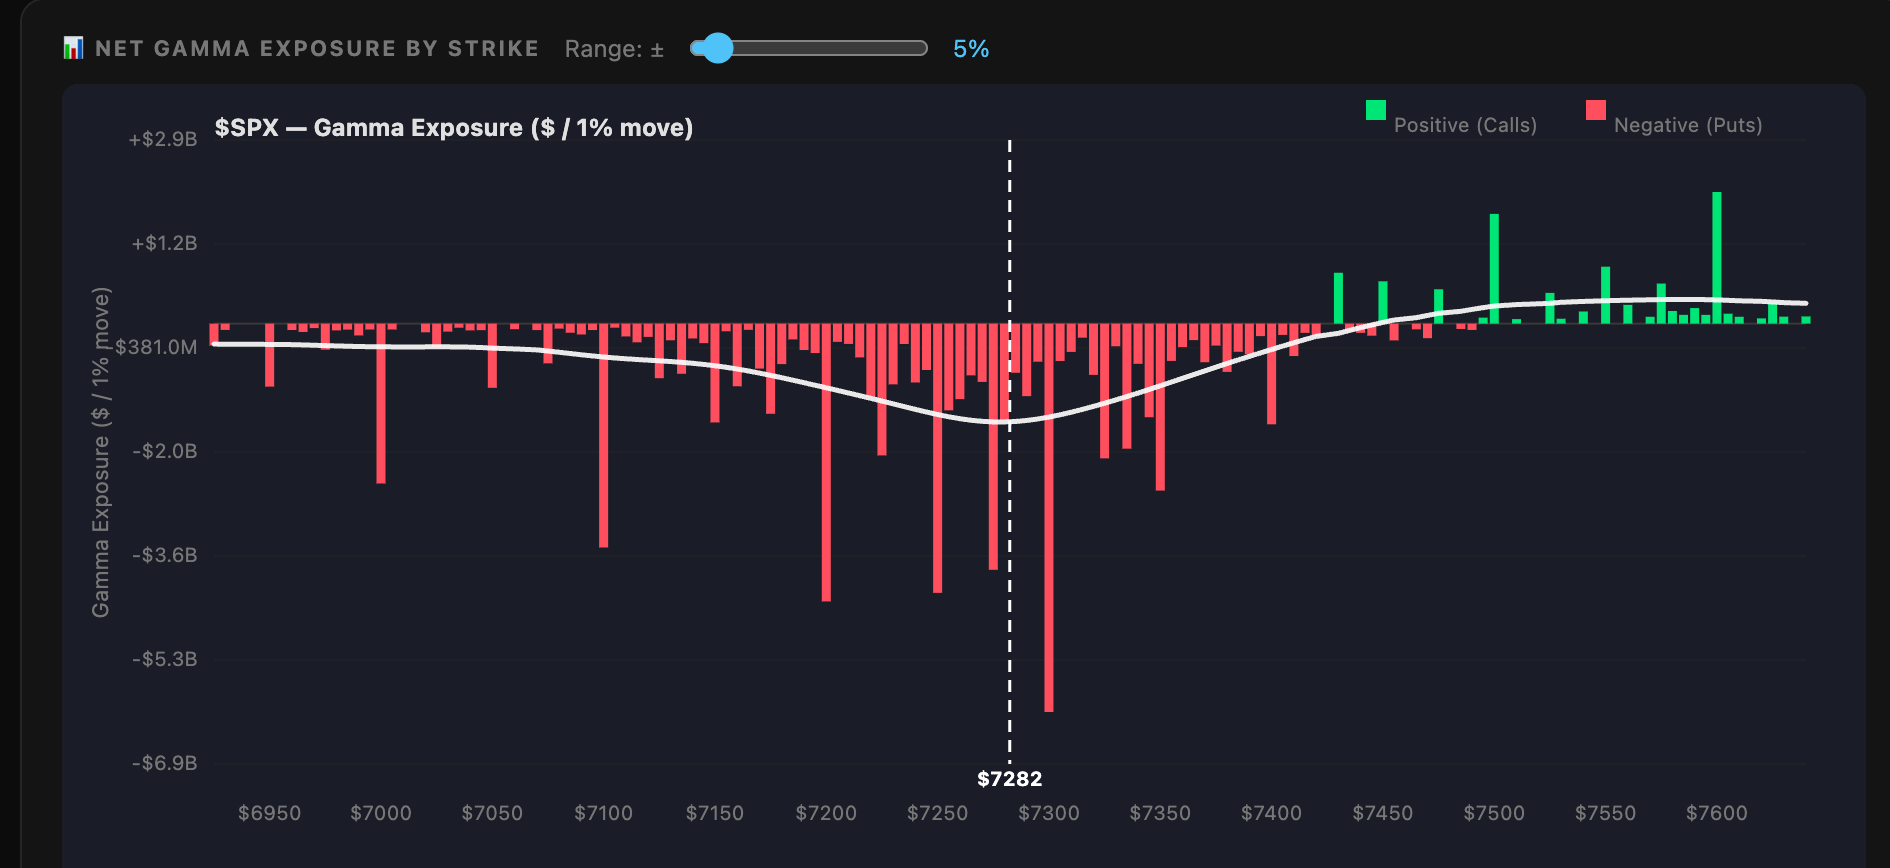
Things could start to get interesting for a couple of reasons. One is that the next technical support area comes in around 7,170. Additionally, the rising trend line that formed the upper boundary of the megaphone pattern I wrote about a few months ago, when the market was first breaking out, is coming back into play and could create what would be considered a throwover.
It will be something to watch, especially if we eventually break below 7,200.
The ECB meets tomorrow and is expected to raise rates by 25 basis points, taking the deposit rate to 2.25% from 2.0%. Markets are also pricing in another 25-basis-point hike in September.
The focus, however, will be less on tomorrow’s rate increase and more on the timing and likelihood of that second hike. Investors will be paying close attention to how Christine Lagarde frames the policy outlook and whether her comments reinforce expectations for further tightening later this year.
-Mike
Glossary by ChatGPT
Core CPI — Consumer Price Index excluding food and energy prices, used to measure underlying inflation trends.
ECB Deposit Rate — The interest rate the European Central Bank pays on deposits held by commercial banks.
Exponential Moving Average (EMA) — A moving average that places greater weight on recent price data to identify trends.
Headline Inflation — The overall inflation rate that includes all categories of goods and services, including food and energy.
Inflation Swaps — Financial derivatives that allow investors to trade or hedge against future inflation expectations.
Megaphone Pattern — A technical chart formation characterized by widening price swings and diverging trendlines.
PCE (Personal Consumption Expenditures) Price Index — The Federal Reserve’s preferred measure of inflation, tracking changes in consumer spending prices.
PPI (Producer Price Index) — A measure of price changes received by producers for goods and services before they reach consumers.
Put Wall — An options market level with significant put open interest that can influence price movements and market positioning.
RBOB Gasoline — A wholesale gasoline futures contract used as a benchmark for U.S. gasoline prices.
Technical Support — A price level where buying interest is expected to emerge and potentially halt a decline.
Throwover — A technical analysis event where price temporarily moves beyond a trendline or pattern boundary before reversing.
Triangle Pattern — A chart formation created by converging trendlines that often precedes a breakout in either direction.
Disclosure
This report contains independent commentary to be used for informational and educational purposes only. Michael Kramer is a member and investment adviser representative with Mott Capital Management. Mr. Kramer is not affiliated with this company and does not serve on the board of any related company that issued this stock. All opinions and analyses presented by Michael Kramer in this analysis or market report are solely Michael Kramer’s views. Readers should not treat any opinion, viewpoint, or prediction expressed by Michael Kramer as a specific solicitation or recommendation to buy or sell a particular security or follow a particular strategy. Michael Kramer’s analyses are based upon information and independent research that he considers reliable, but neither Michael Kramer nor Mott Capital Management guarantees its completeness or accuracy, and it should not be relied upon as such. Michael Kramer is not under any obligation to update or correct any information presented in his analyses. Mr. Kramer’s statements, guidance, and opinions are subject to change without notice. Past performance is not indicative of future results. Neither Michael Kramer nor Mott Capital Management guarantees any specific outcome or profit. You should be aware of the real risk of loss in following any strategy or investment commentary presented in this analysis. Strategies or investments discussed may fluctuate in price or value. Investments or strategies mentioned in this analysis may not be suitable for you. This material does not consider your particular investment objectives, financial situation, or needs and is not intended as a recommendation appropriate for you. You must make an independent decision regarding investments or strategies in this analysis. Upon request, the advisor will provide a list of all recommendations made during the past twelve months. Before acting on information in this analysis, you should consider whether it is suitable for your circumstances and strongly consider seeking advice from your own financial or investment adviser to determine the suitability of any investment.