
S&P 500 Gamma Squeeze Fades as Real Yields Rise

Please remember to subscribe to my Substack to receive this free daily commentary—which I work very hard to produce—directly in your inbox.


The market rally extended this week, with the S&P rising on Monday and Tuesday and finishing just above Tuesday’s close, though below Wednesday’s intraday highs. As I wrote during the week, much of what we saw was heavy call volume driving the market higher, especially on Monday and Tuesday, a gamma squeeze in essence. When that volume came off on Thursday, the market stalled. The other component was implied volatility coming down, not just on the VIX but on the VIX 1-Day as well, a clear volatility crush. Following the Fed meeting on the 29th, implied vol on the VIX 1-Day was around 19.5, and it has come down sharply since.
That framing matters because we entered the weekend in a negative gamma environment (a state where dealer hedging can amplify market moves). Coming out of it with volatility falling and call volume surging to the upside created an environment ripe for a big move. I wrote about the same idea for MarketWatch: gamma exposure shifted from negative to positive as the market rallied, creating a gamma squeeze that pushed the market higher, at least at the beginning of the week.
As of Friday, the call wall sits around 7,800, with plenty of gamma built up at 7,750 and 7,800, while the put wall is all the way down at 7,400. That tells me that if the market starts to drift lower, there is a big air pocket, with not much support from an options perspective until 7,400. That can obviously change, since we don’t know where volumes and open interest will settle out on Monday morning, but as of Friday that is the information we have to work with.
The other important point is that we are entering the part of the year when the dispersion trade unwinds. Single-stock implied volatility rises sharply heading into earnings, and once results pass and that volatility comes off, the spread between single-stock vol and index vol naturally shrinks, as it has after reaching record highs. As that spread narrows, dispersion should come down and correlations should begin to rise. To this point, they have, as three-month correlations reached record lows just a couple of weeks ago.
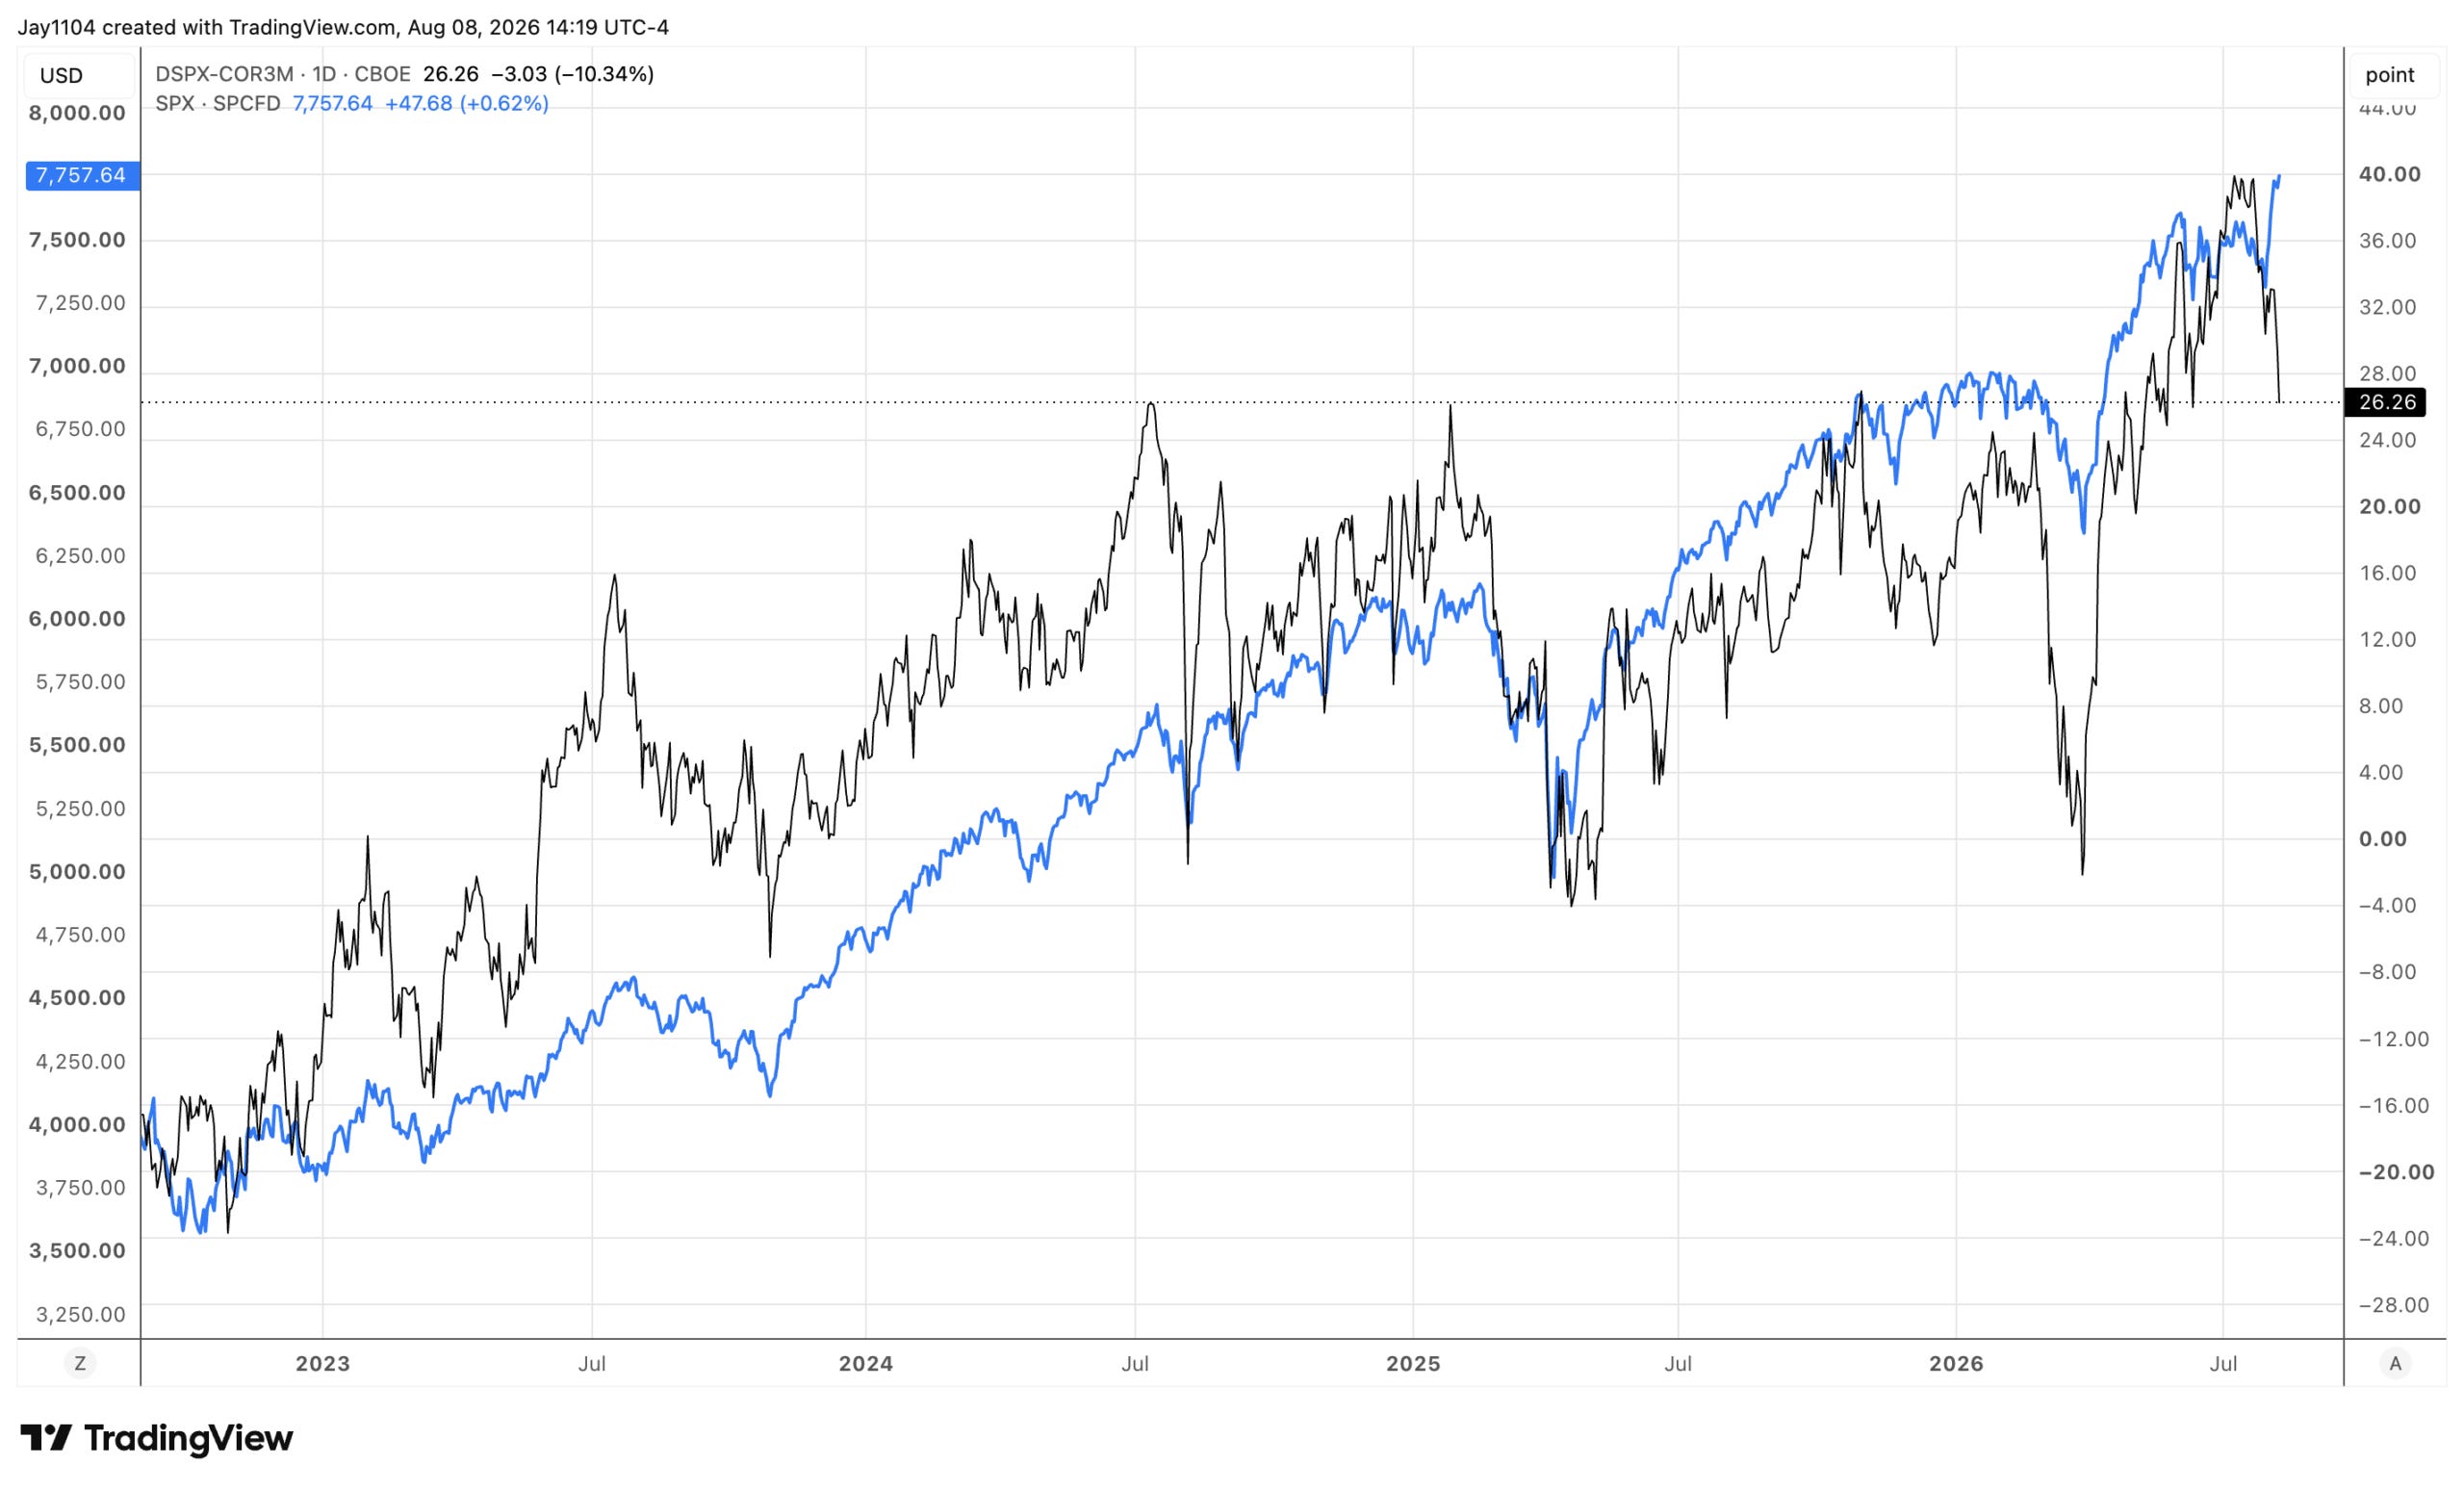
I like to look at the spread between dispersion and three-month implied correlations because it offers a good proxy for the direction of the S&P. It doesn’t tell us how much the index will rise or fall, but it gives a good sense of which way it is likely to move. By the end of the week, that spread was clearly heading lower. Nothing is a perfect indicator, and there have been times when the market’s reaction was delayed. It’s also quite possible dispersion picks back up as we get closer to NVIDIA’s earnings in late August, with Broadcom right around the same time, since those are two heavily weighted index components. But if the spread continues to come down, mechanically it is telling us the market should continue to unwind as well. The gamma squeeze distorted things, though I think that has largely worked itself off at this point.
The Nasdaq, clearly, hasn’t recovered to the same degree, retracing to between the 61.8% and 78.6% levels on a closing basis. If the Nasdaq is not going to make a new high, this is really where it should stop; usually, getting through the 78.6% level means you’re probably going back to the highs. If it stalls here and turns lower, I would think the dispersion unwind continues to weigh.
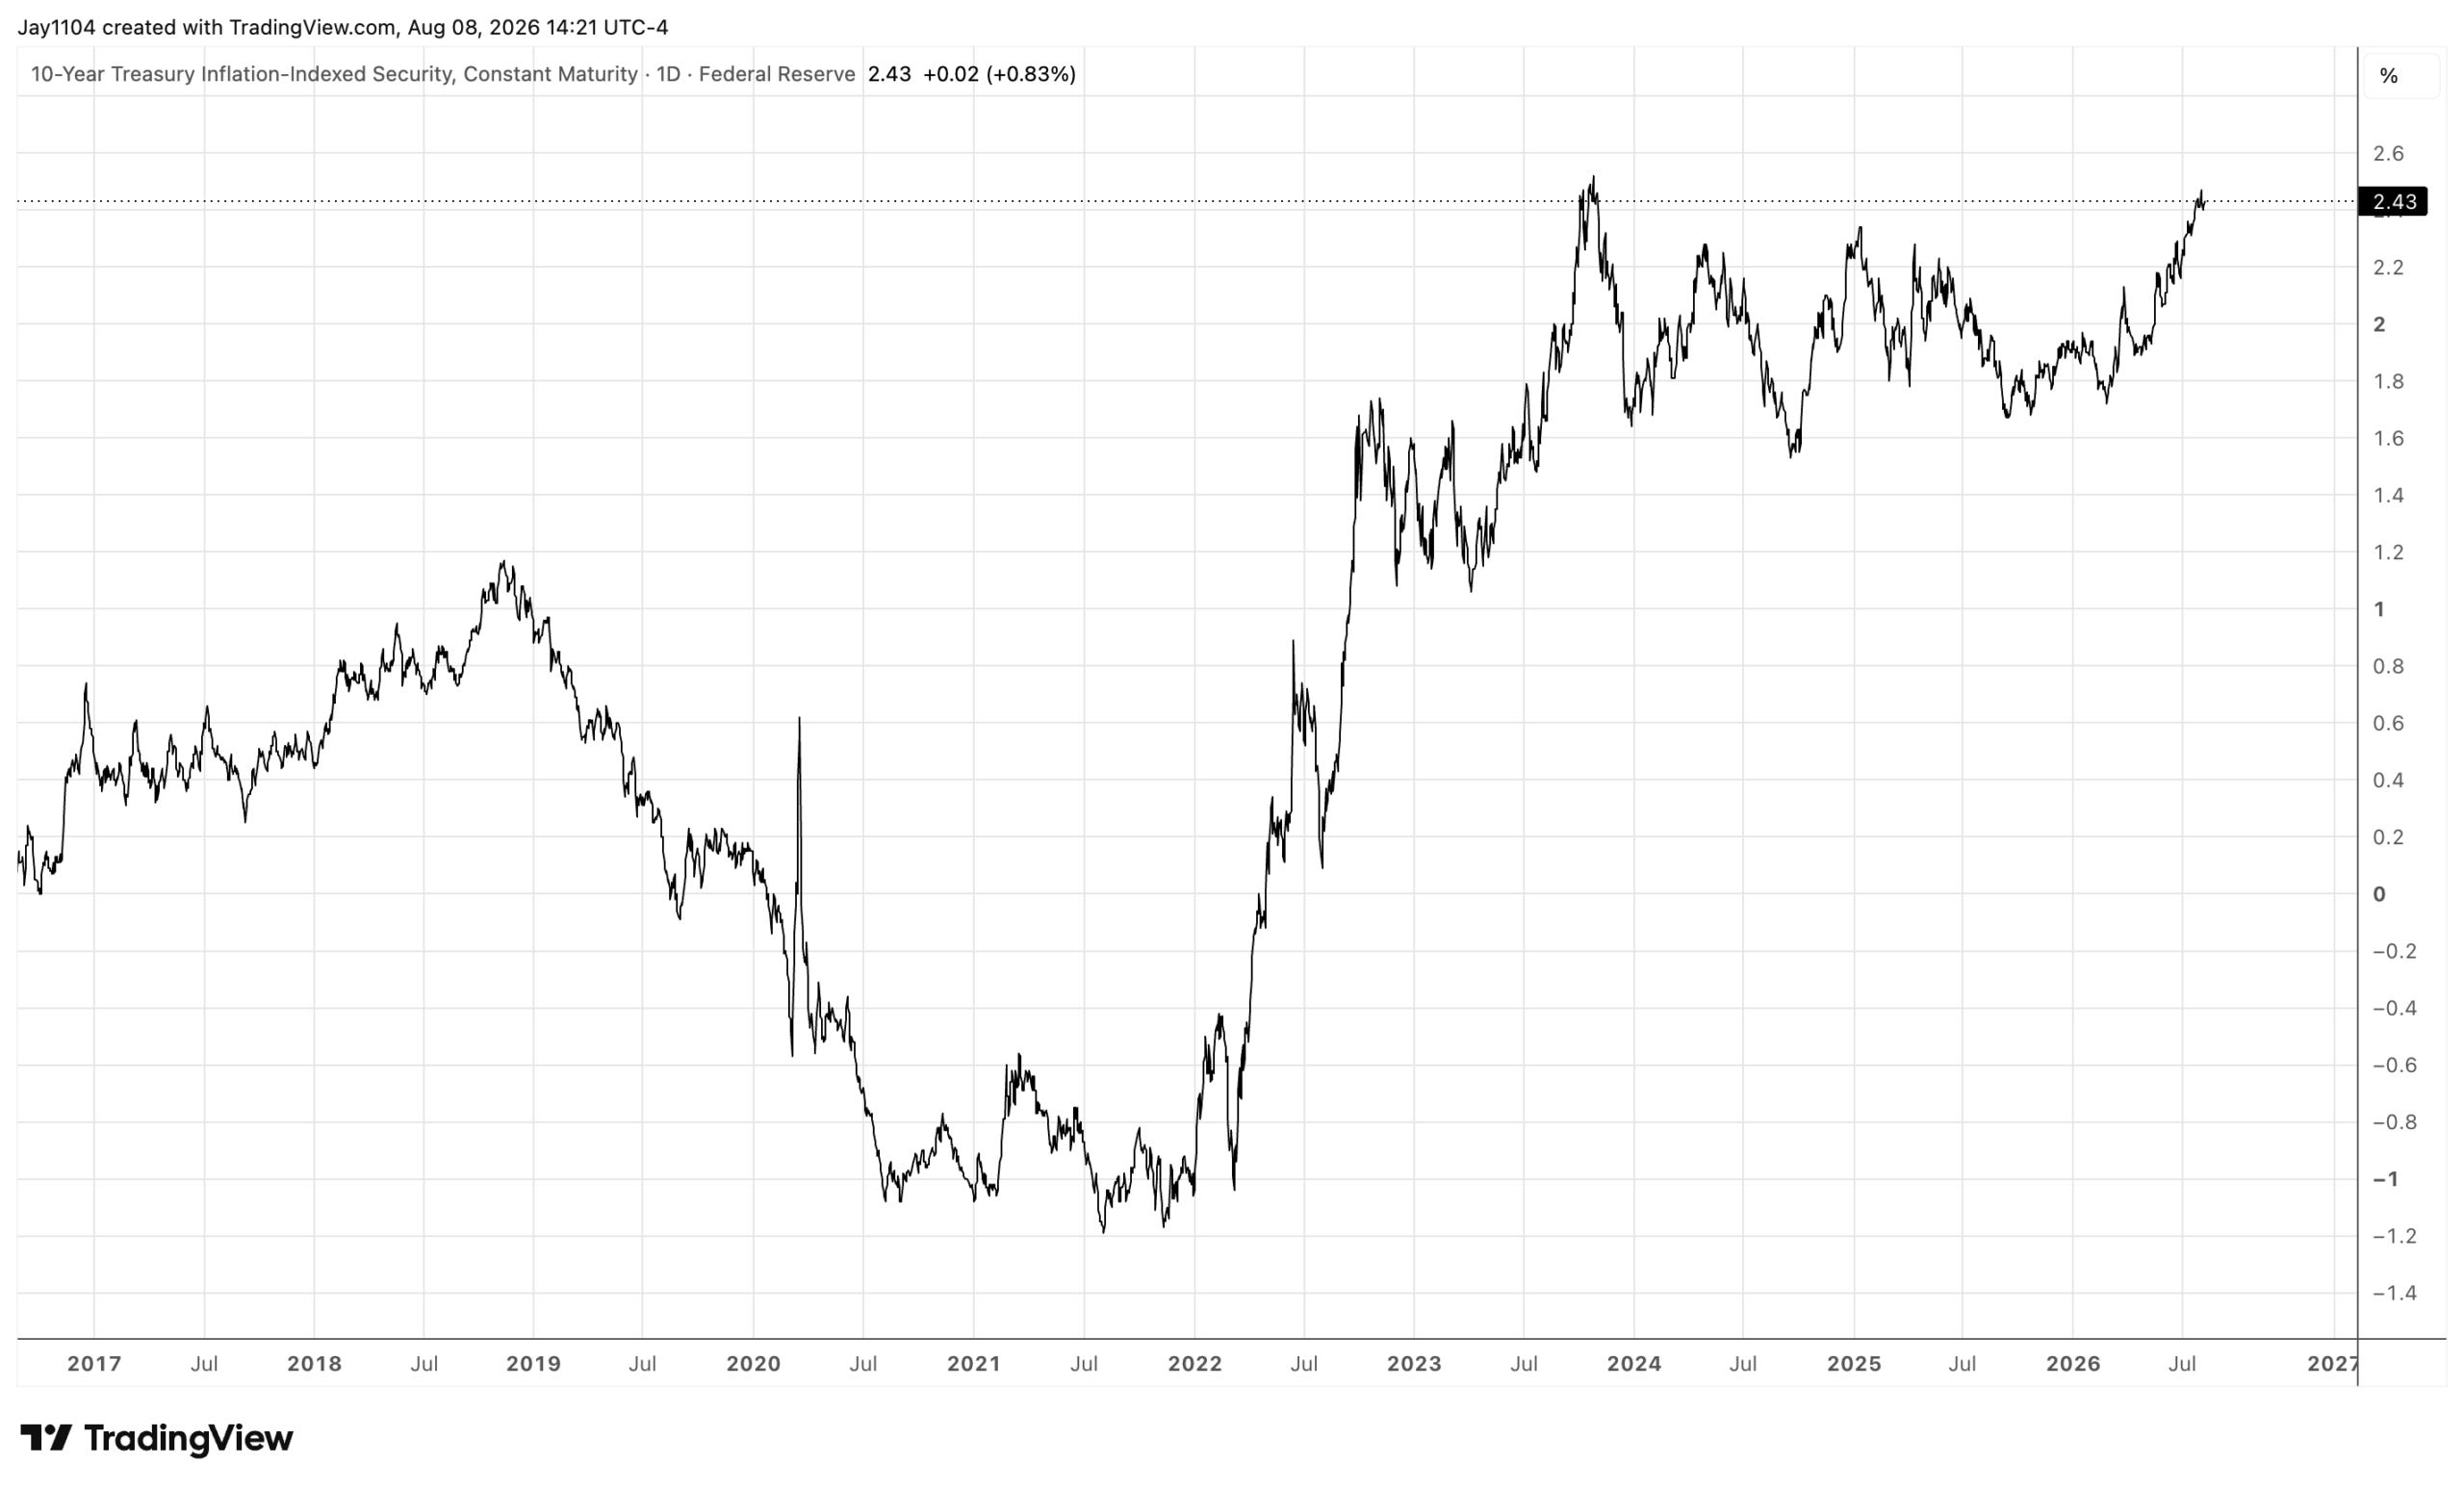
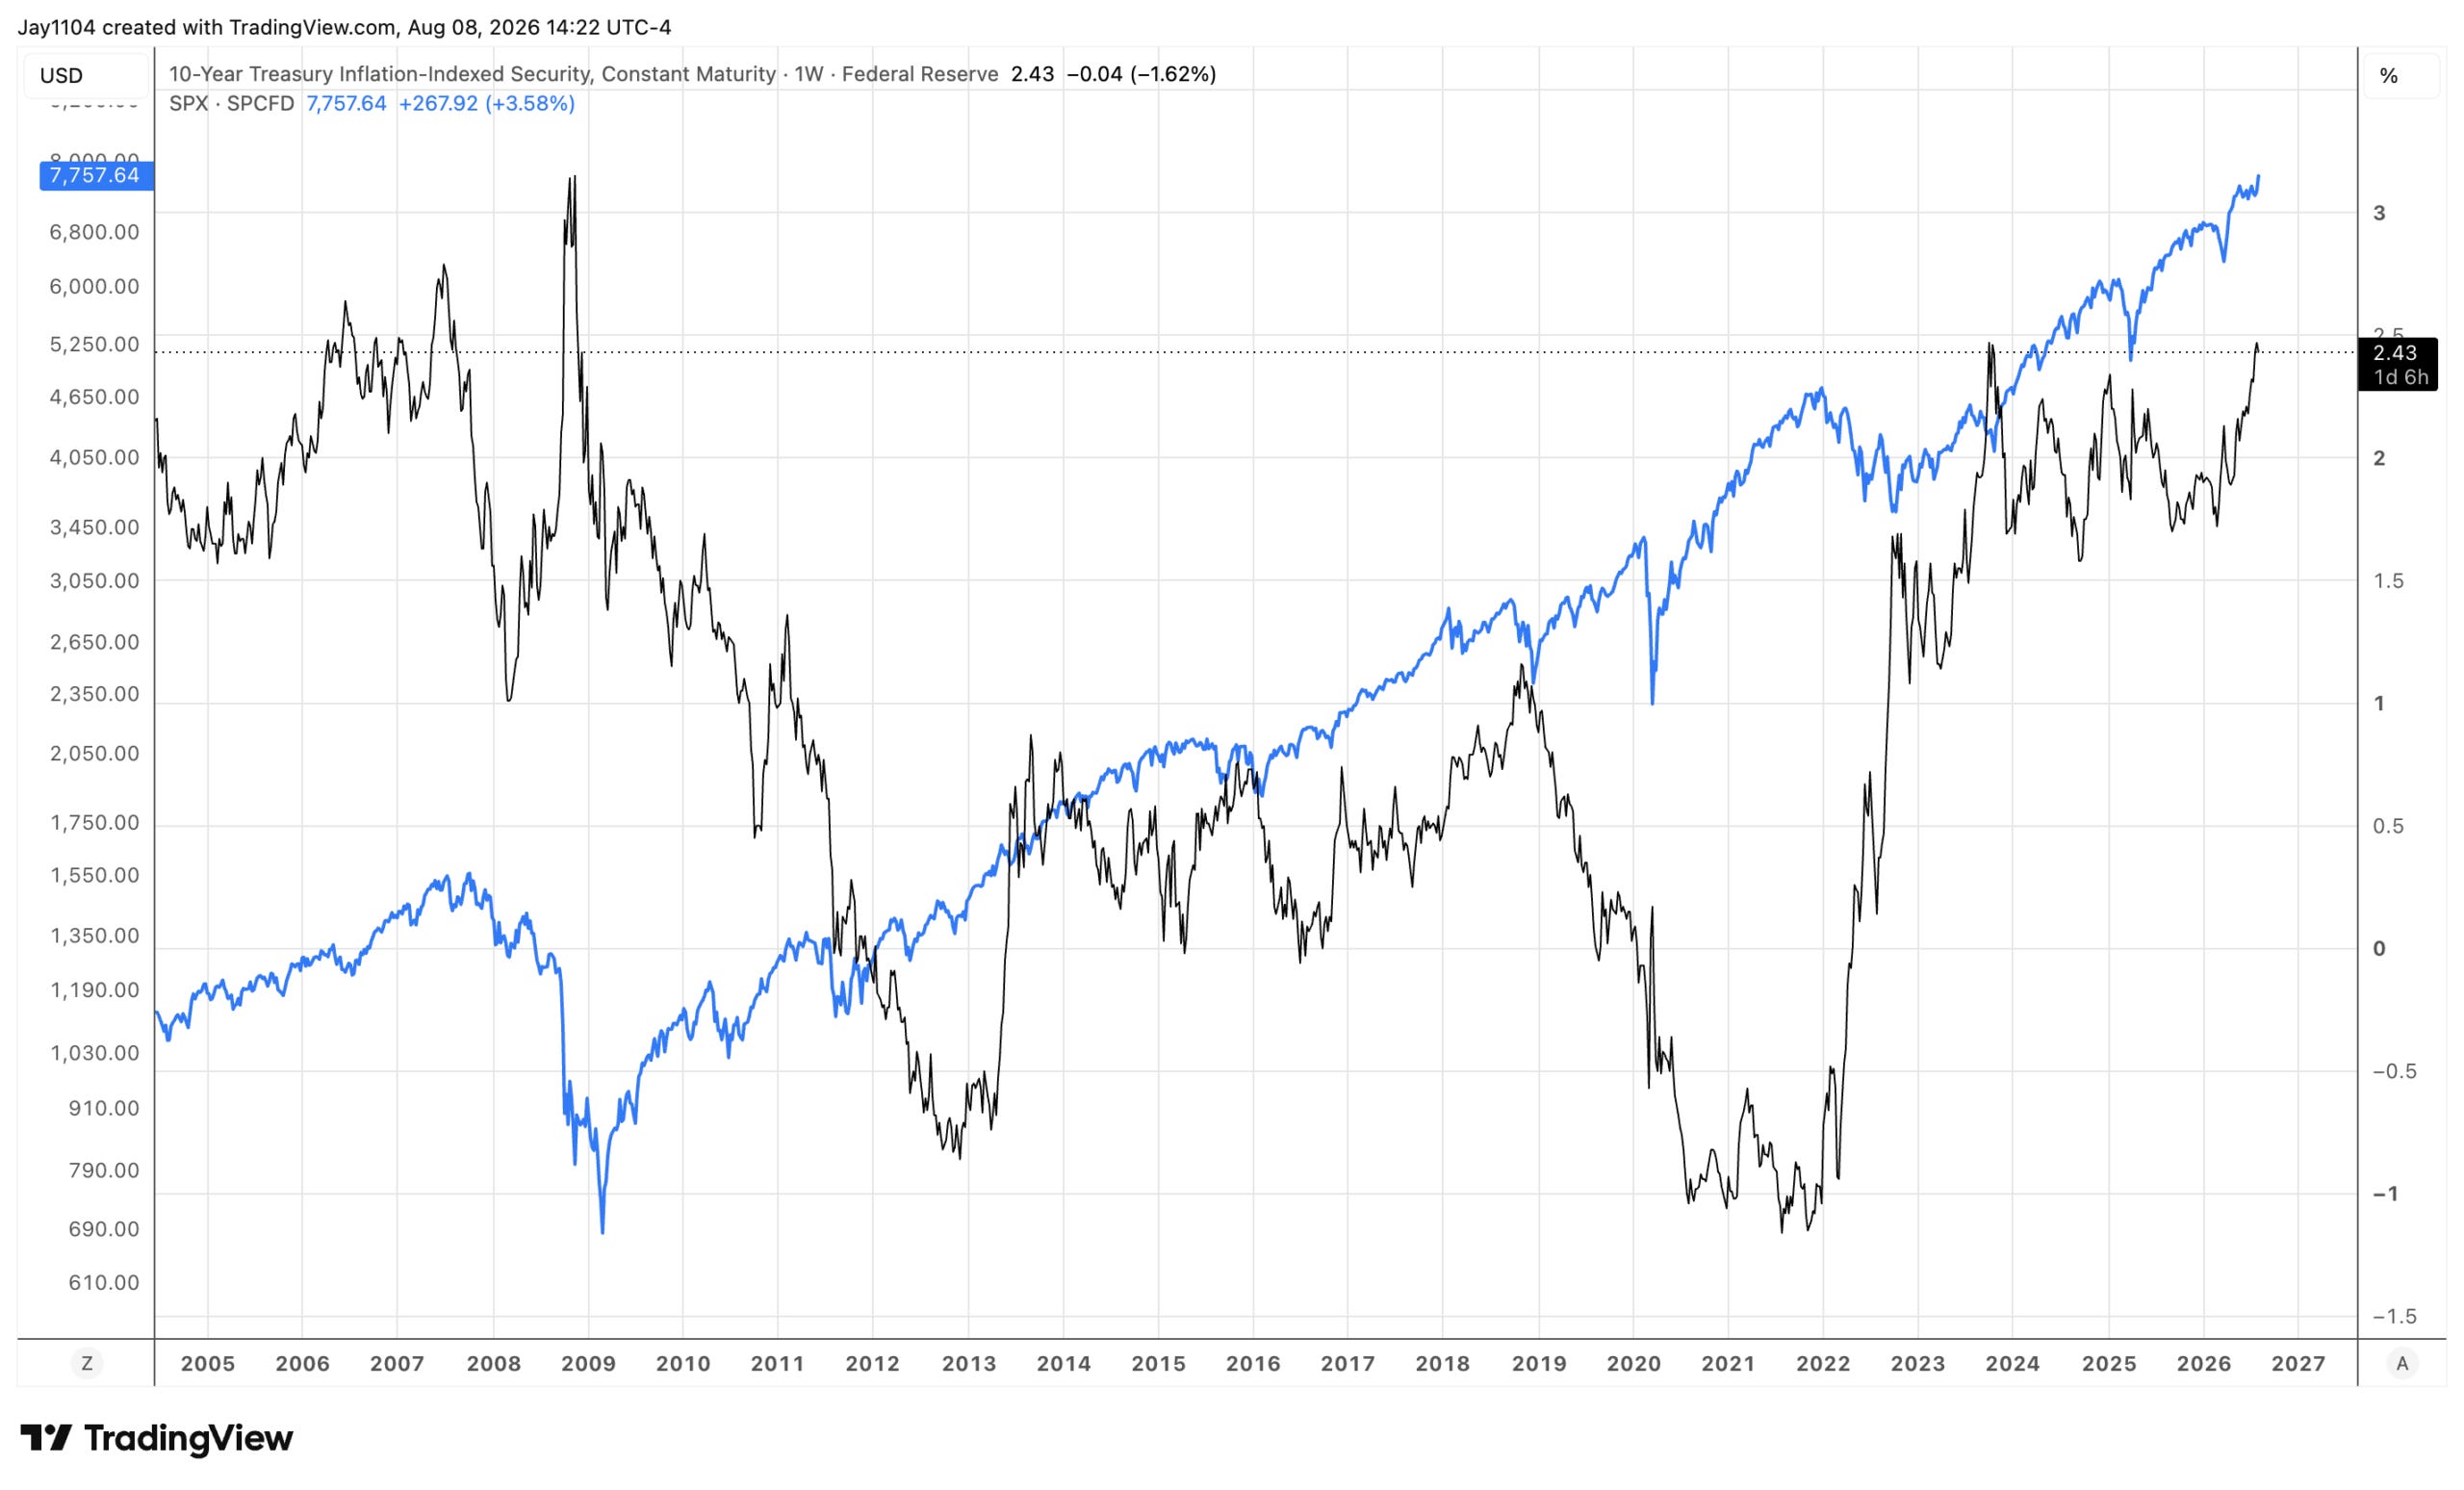
Perhaps more importantly, 10-year rates gave back very little of Thursday’s rise despite the big jobs report miss. Ten-year real yields are moving higher, now at 2.43%, up about 70 basis points since early March. That isn’t as large as the nearly 1.5% rise from April 2023 into October, which eventually led to a sharp decline in the S&P, but it is beginning to get on that scale, and history suggests the market reacts with a delay. It may only take another 10 or 20 basis points, to roughly a 90 basis point move, before impacts start showing up.
The 10-year real yield is also now trading above the 10-year breakeven inflation expectation, something that hasn’t happened since 2007, which suggests that for the first time in two decades the market is doing some of the work for the Fed in tightening policy. That preceded the housing bubble popping in July of 2007, right before the market ultimately peaked. I’m not saying we’re due for some big top, but rate policy may finally be getting to a point where it starts to matter a little more, and if real rates separate further from inflation expectations, that would be a dynamic worth monitoring closely.
-Mike
Glossary by Claude
Gamma squeeze: A rally amplified by dealers buying the underlying index to hedge as heavy call buying pushes their gamma exposure positive.
Negative gamma: A dealer positioning state in which hedging flows amplify market moves rather than dampen them.
Call wall / put wall: The strikes with the heaviest call or put open interest, which tend to act as resistance and support for the index.
VIX 1-Day: An index measuring implied volatility for just the next trading session.
Volatility crush: A rapid decline in implied volatility, often after an event the market had priced as risky.
Dispersion: A measure of how much individual stocks move independently of the index.
Implied correlation: The market’s pricing of how closely stocks in the index are expected to move together.
Real yield: A Treasury yield after subtracting expected inflation, as measured by TIPS.
Breakeven inflation rate: The gap between nominal Treasury and TIPS yields, reflecting the market’s expected inflation.
Disclaimer
This report contains independent commentary to be used for informational and educational purposes only. Michael Kramer is a member and investment adviser representative with Mott Capital Management. Mr. Kramer is not affiliated with this company and does not serve on the board of any related company that issued this stock. All opinions and analyses presented by Michael Kramer in this analysis or market report are solely Michael Kramer’s views. Readers should not treat any opinion, viewpoint, or prediction expressed by Michael Kramer as a specific solicitation or recommendation to buy or sell a particular security or follow a particular strategy. Michael Kramer’s analyses are based upon information and independent research that he considers reliable, but neither Michael Kramer nor Mott Capital Management guarantees its completeness or accuracy, and it should not be relied upon as such. Michael Kramer is not under any obligation to update or correct any information presented in his analyses. Mr. Kramer’s statements, guidance, and opinions are subject to change without notice. Past performance is not indicative of future results. Neither Michael Kramer nor Mott Capital Management guarantees any specific outcome or profit. You should be aware of the real risk of loss in following any strategy or investment commentary presented in this analysis. Strategies or investments discussed may fluctuate in price or value. Investments or strategies mentioned in this analysis may not be suitable for you. This material does not consider your particular investment objectives, financial situation, or needs and is not intended as a recommendation appropriate for you. You must make an independent decision regarding investments or strategies in this analysis. Upon request, the advisor will provide a list of all recommendations made during the past twelve months. Before acting on information in this analysis, you should consider whether it is suitable for your circumstances and strongly consider seeking advice from your own financial or investment adviser to determine the suitability of any investment.