
Rising Bond Yields Put the S&P 500 Rally at Risk

Please remember to subscribe to my Substack to receive this free daily commentary—which I work very hard to produce—directly in your inbox.
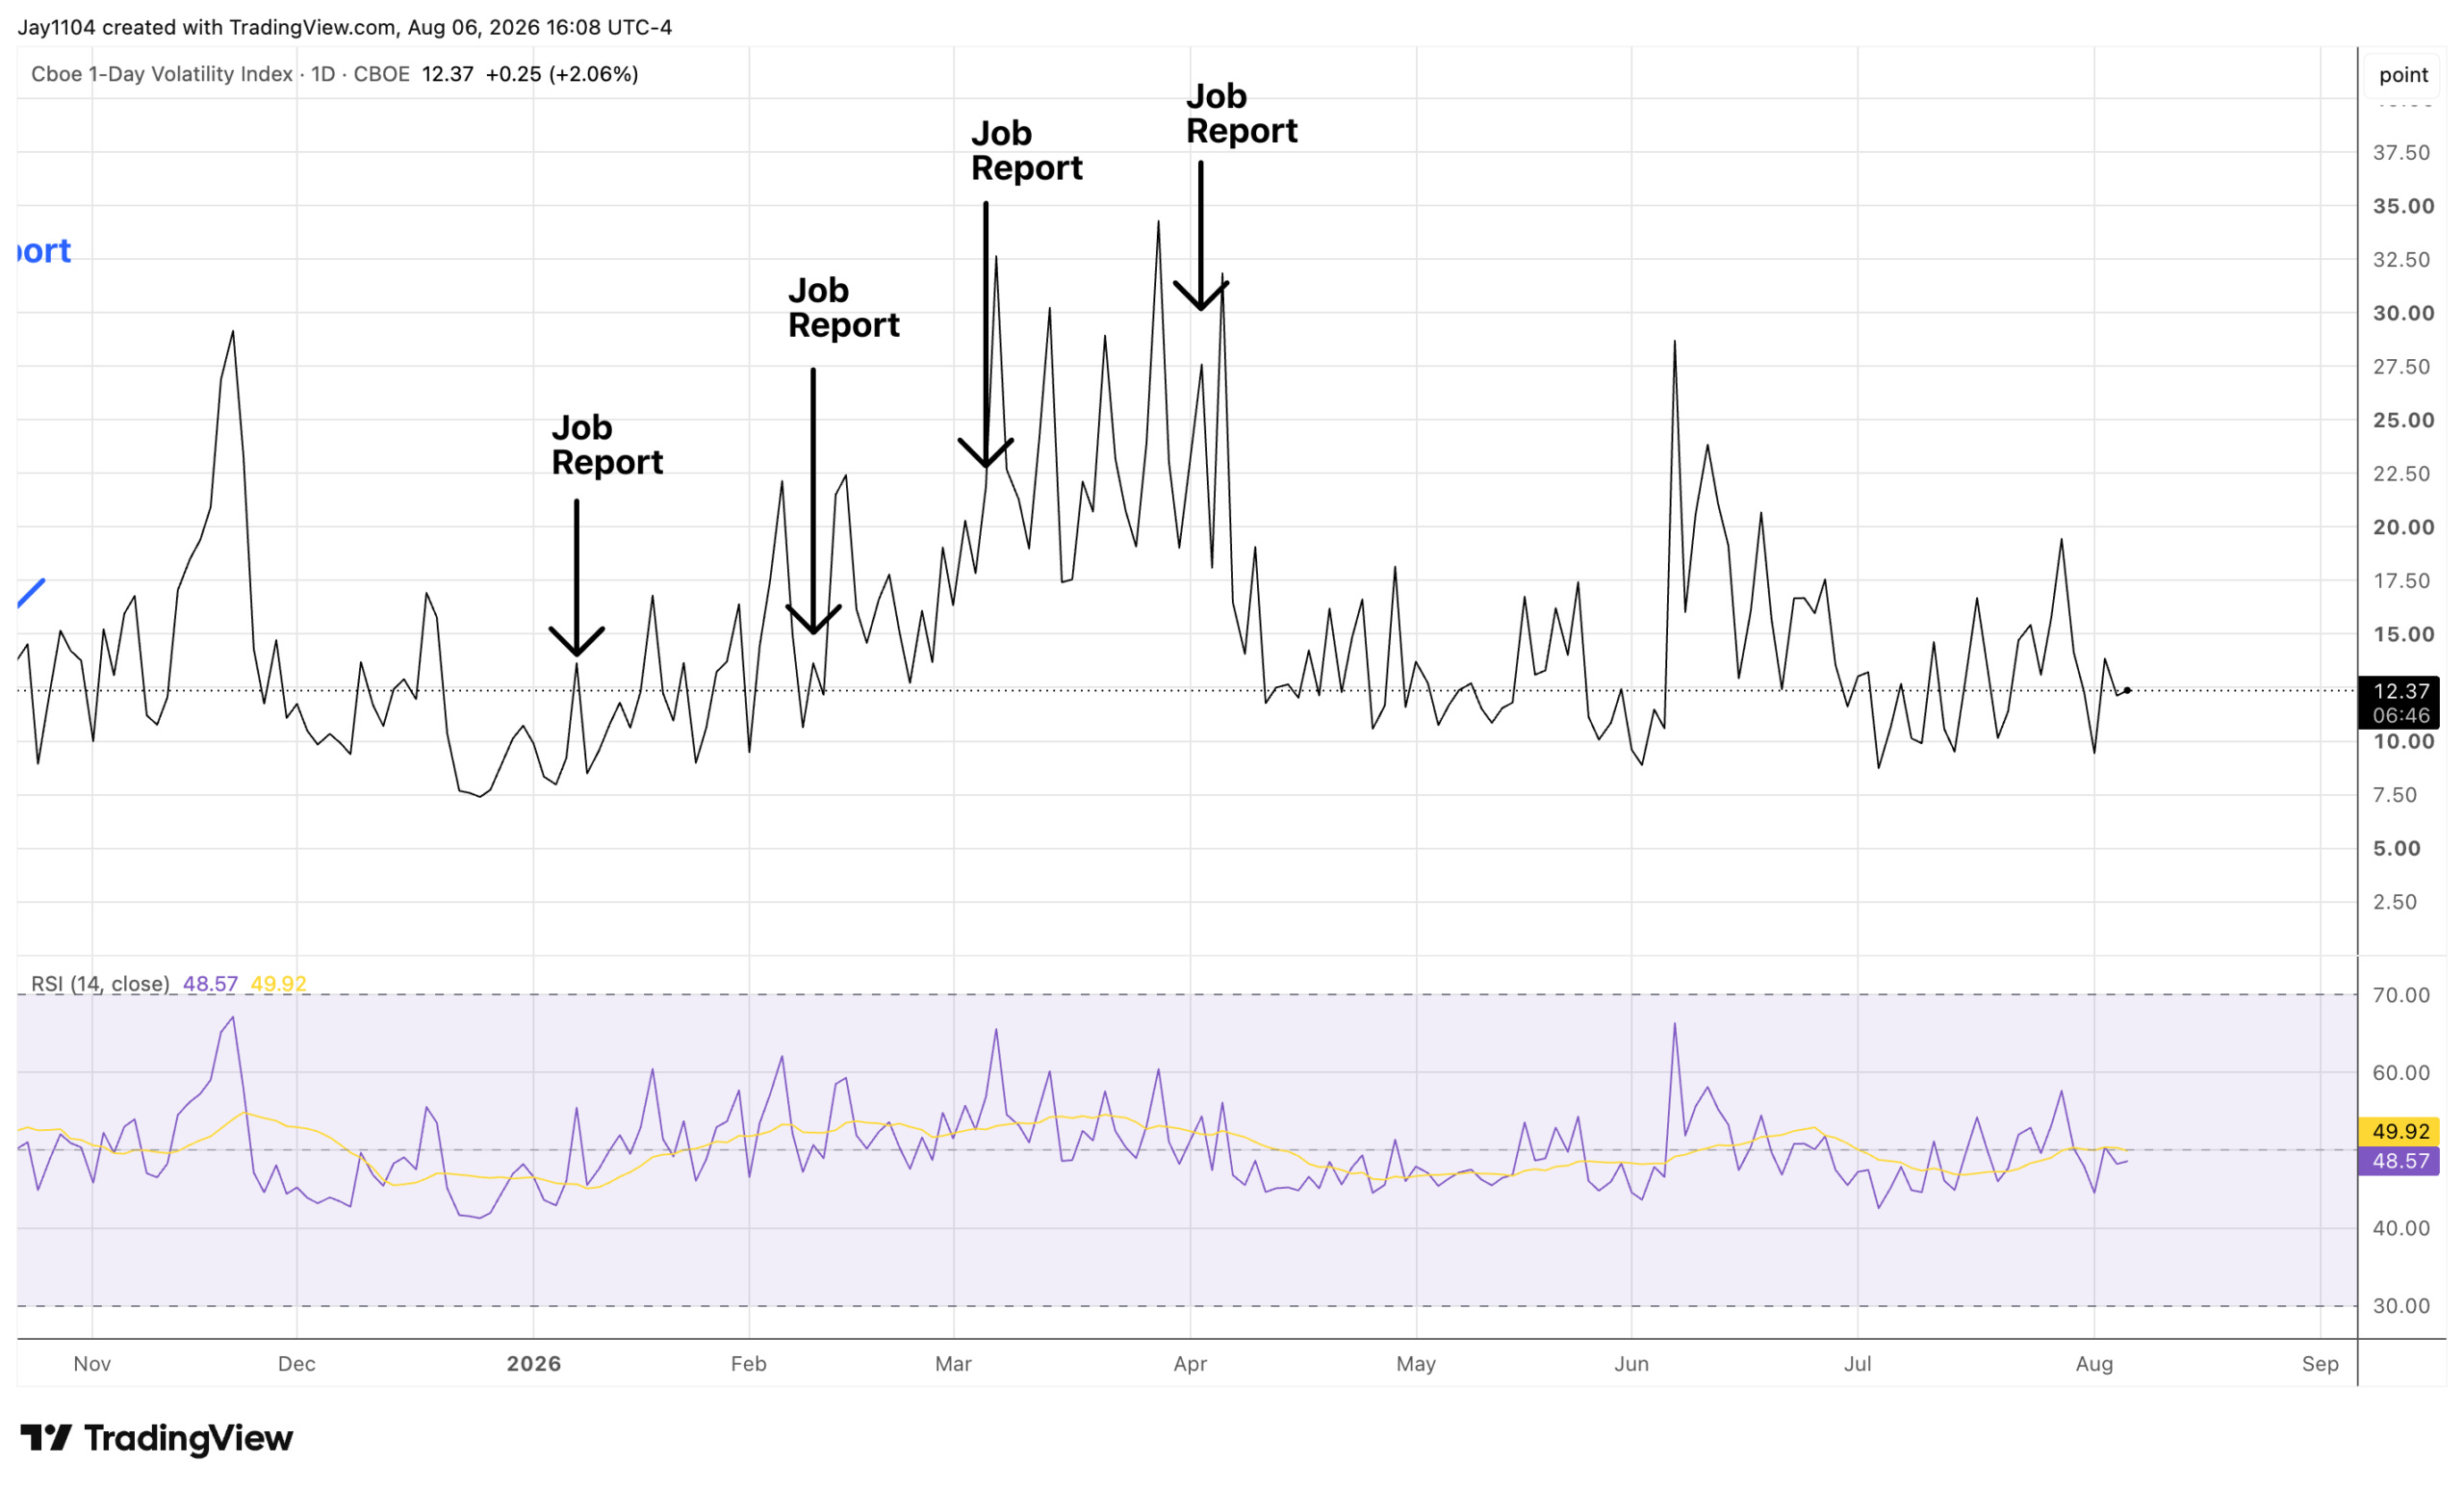
Stocks were mostly lower on August 6, a day ahead of the jobs report. Surprisingly, implied volatility remained rather subdued, with the VIX 1-Day finishing around 12. I would have expected something closer to 15, but we did not get that. That means the odds of a post-NFP volatility crush sending stocks sharply higher are relatively low.
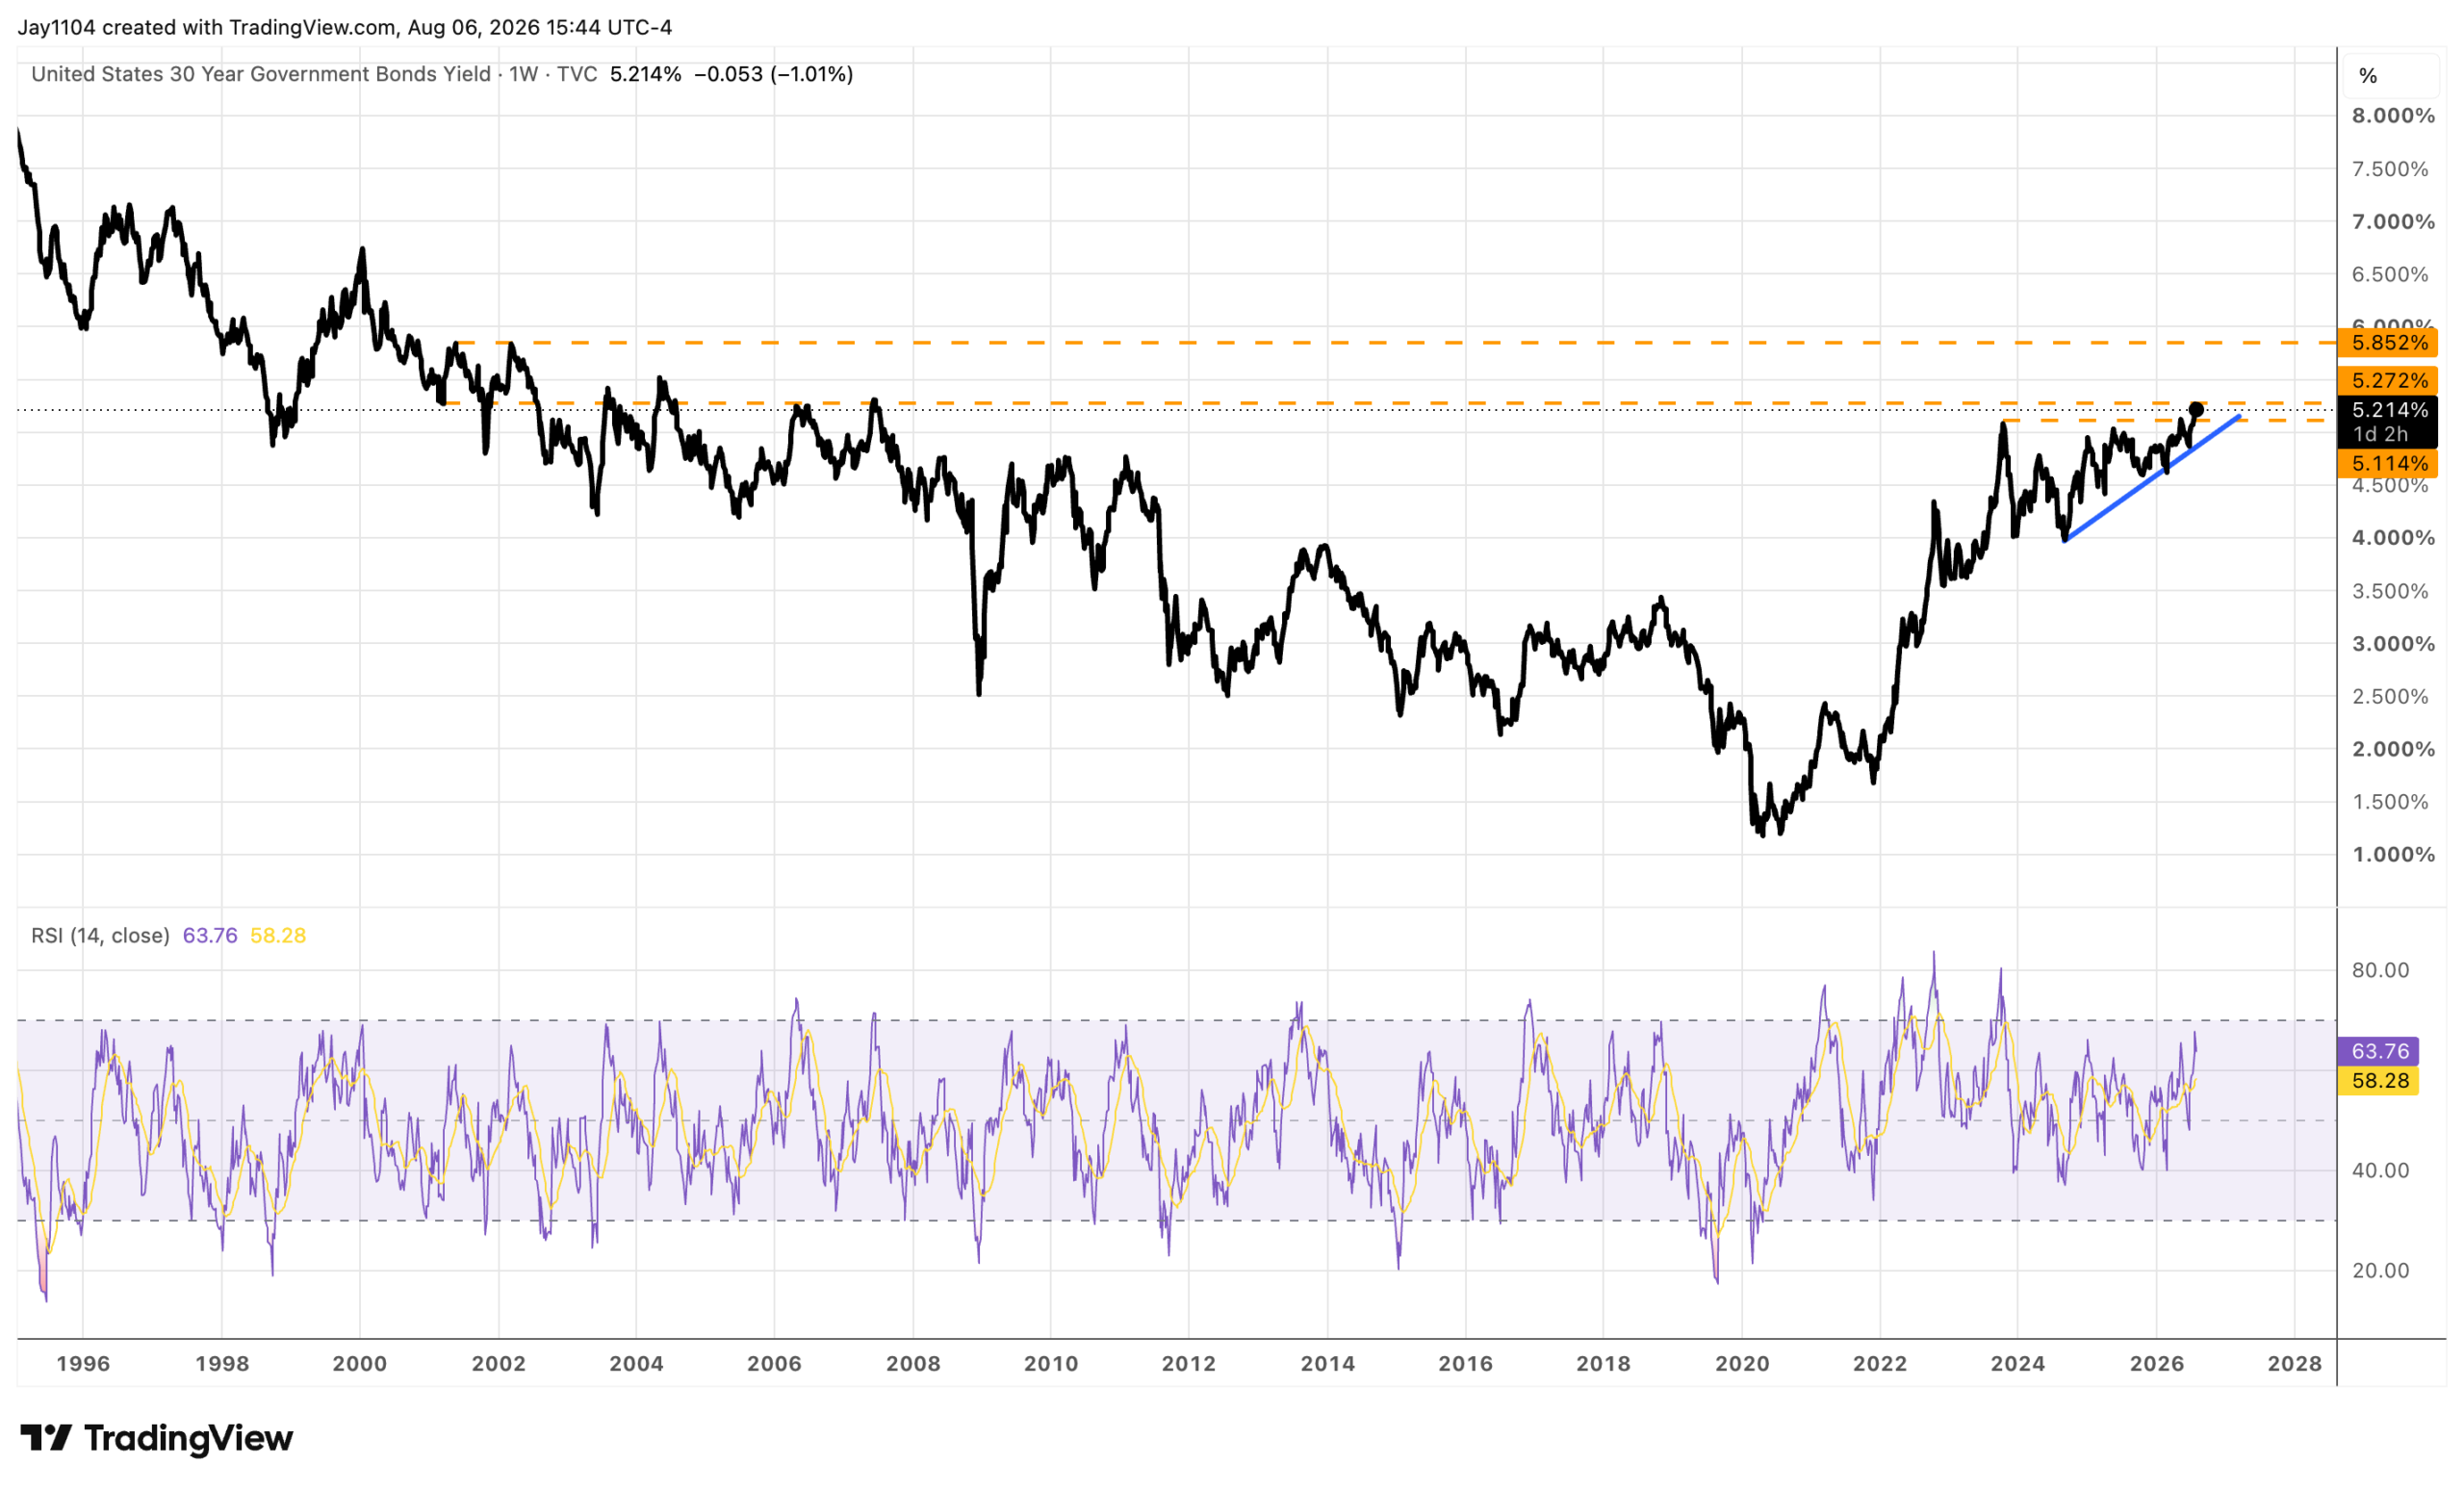
Bond yields, on the other hand, rose on the day, with the 10-year yield climbing nearly 6 bps to 4.67% and the 30-year yield rising 4 bps to 5.21%. The 30-year still appears to me to be in a position to move significantly higher from current levels.
Currently, the 30-year yield is roughly 8 bps below its recent highs, and if it can get through 5.3%, there isn’t much standing in its way from a technical standpoint. That could open the door to 5.5% or even 5.85%. The ascending triangle pattern on the weekly chart paints a pretty convincing picture, in my view.
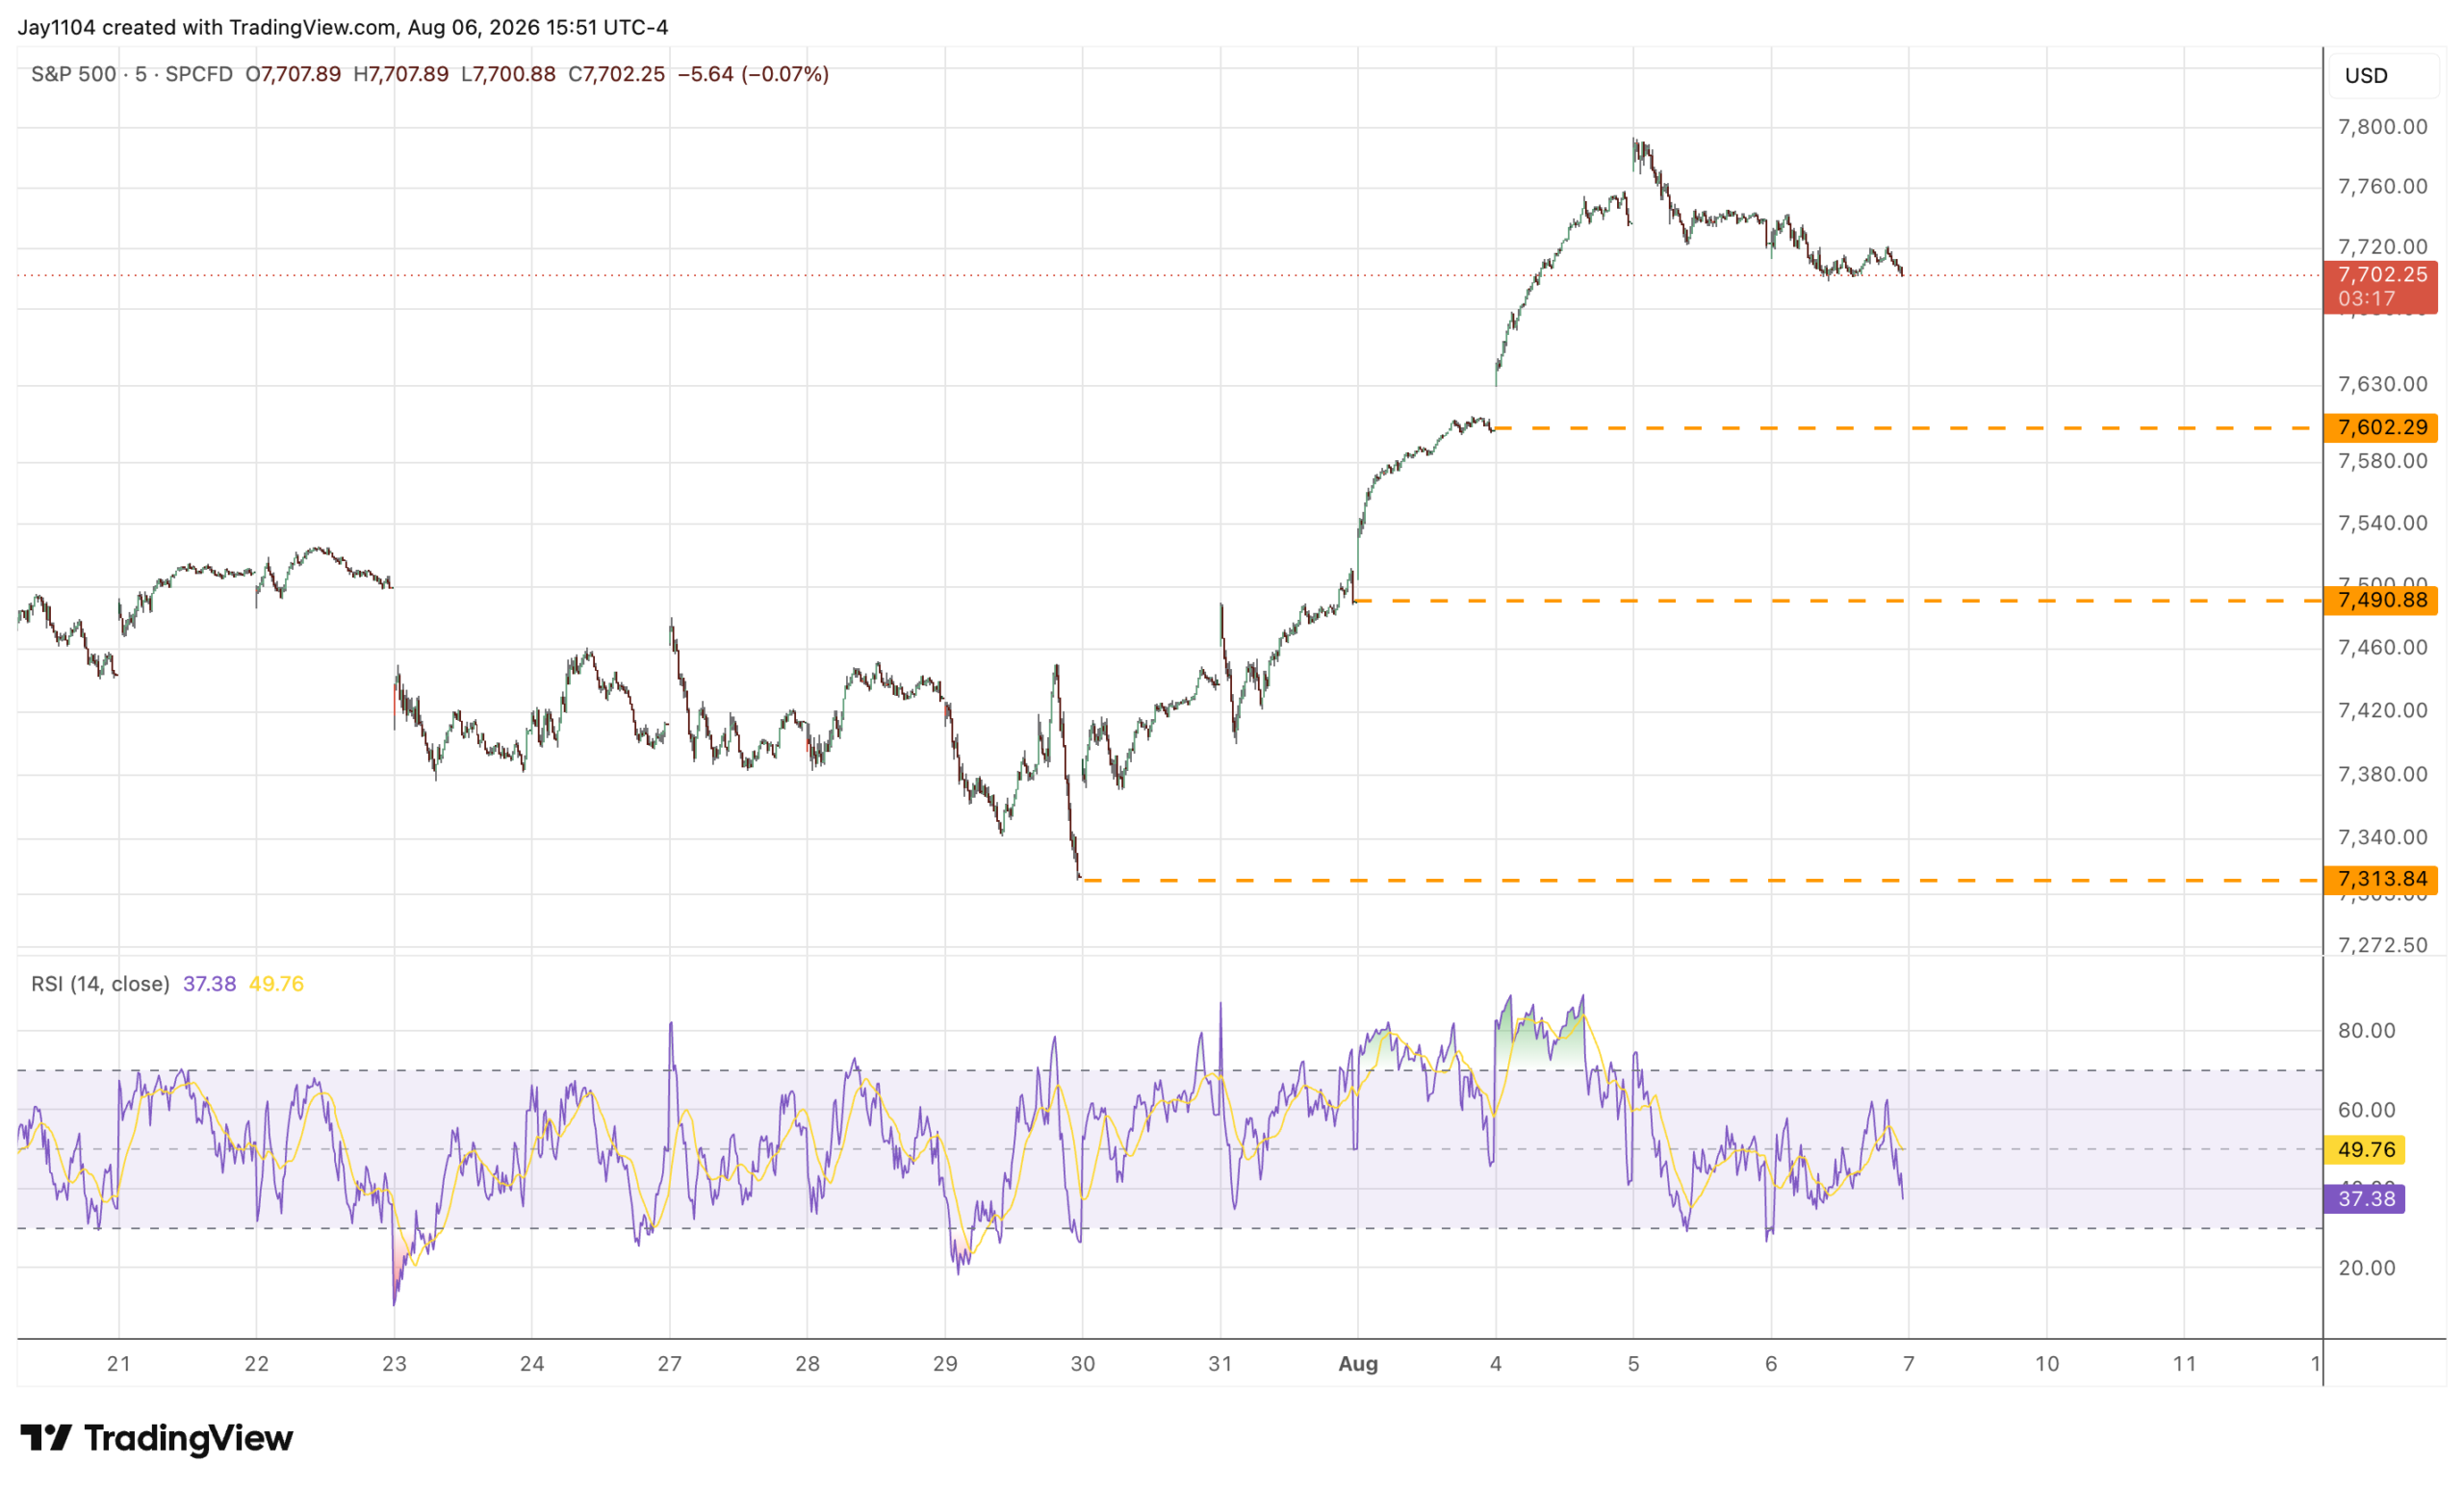
The structure of the rally in the S&P 500 looks fairly flimsy, with several gaps helping to push the index higher, including two that followed sell-offs into the close. I simply do not trust charts where the market sells off into the close and then gaps higher the following day. I find those patterns to be rather unstable, and the gaps tend to fill over time. One could imagine that a negative headline or two may be all that is needed to push the index lower and begin filling those gaps.
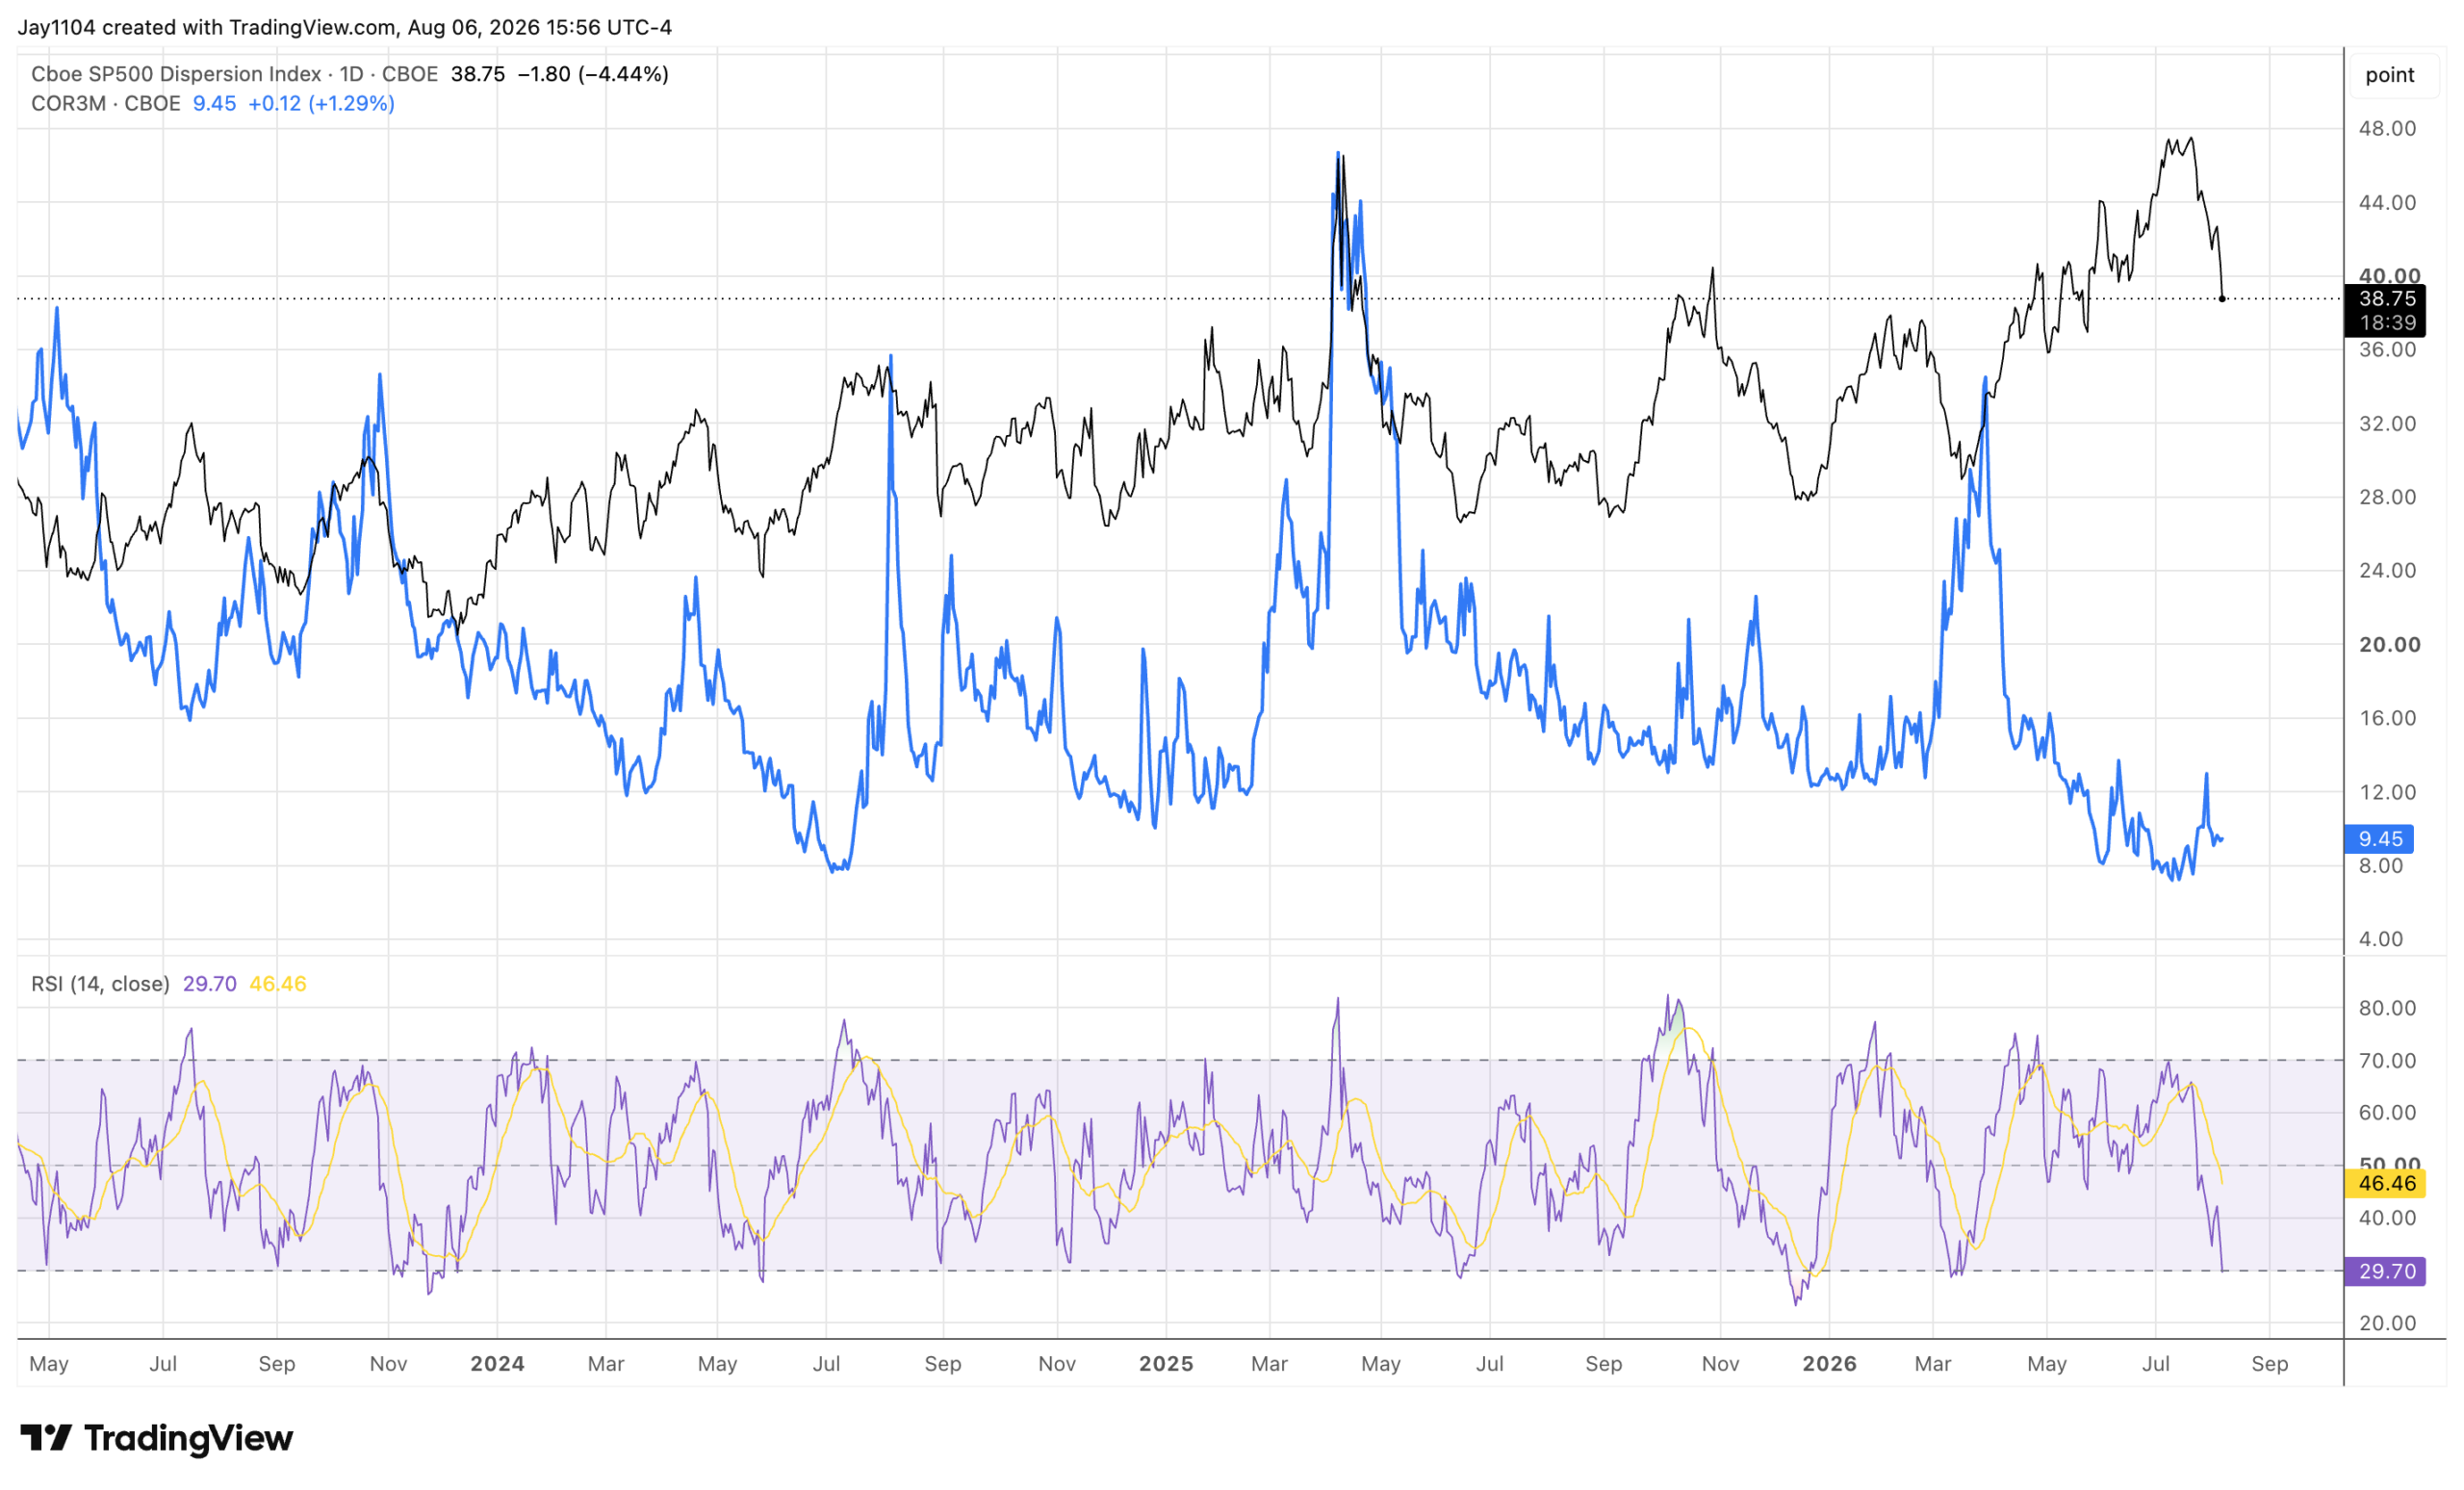
Dispersion is unwinding rather quickly now that earnings season is wrapping up, which means stocks are starting to trade together more often. While dispersion remains elevated, it could have further to unwind. The only thing missing at this point is correlation, which remains very low.
If dispersion continues to decline, one would expect implied correlations to naturally start to rise, bringing the market back to moving more as one again. I’m not sure what headline will move that process along, but the likelihood of the unwind picking up steam should only grow as earnings season comes to an end.
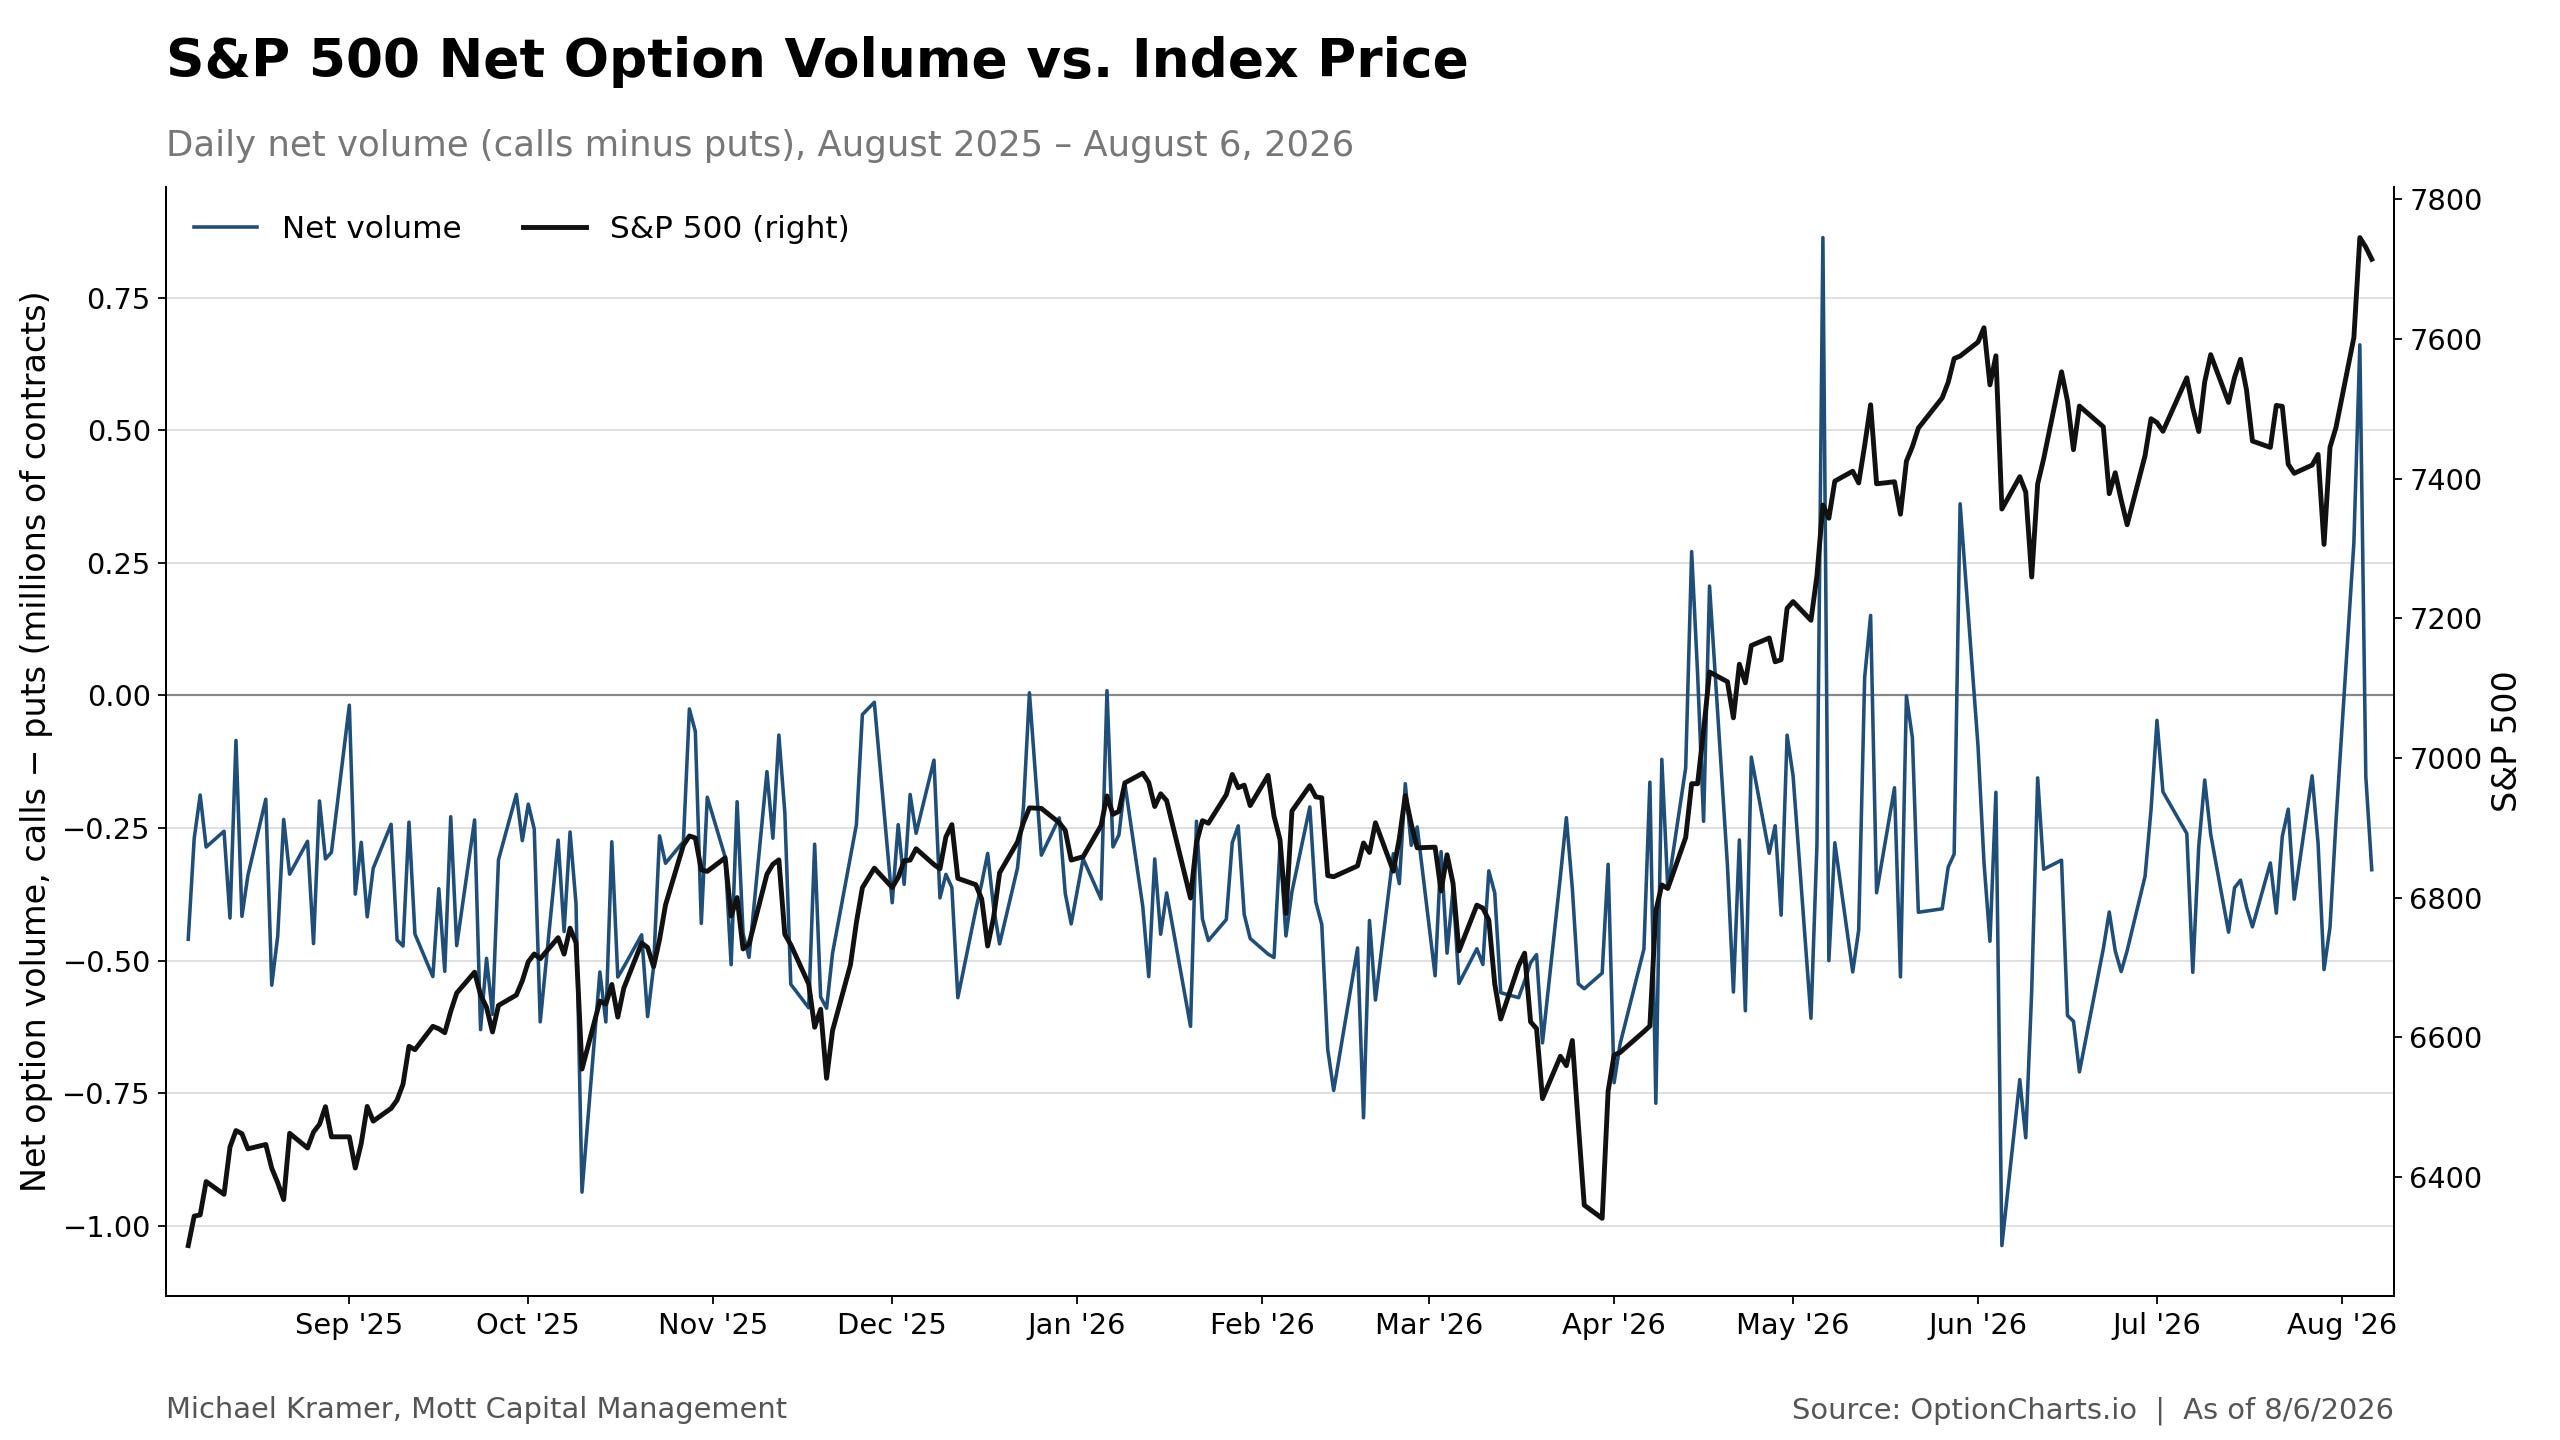
It is no surprise to me that now that call volumes in the S&P 500 have subsided, the move in the index has as well. The gamma squeeze appears to be over.
Glossary by ChatGPT
Ascending Triangle — A bullish technical chart pattern characterized by rising lows converging toward a relatively flat resistance level.
Basis Point (bps) — A unit equal to 0.01 percentage point, commonly used to describe changes in interest rates and bond yields.
Call Volume — The number of call option contracts traded over a specified period.
Correlation — A statistical measure describing the degree to which two or more securities move in relation to one another.
Dispersion — The degree to which individual stock returns differ from one another within an index or market.
Gamma Squeeze — A market dynamic in which options-related hedging activity can accelerate price movements as dealers adjust their exposure.
Implied Correlation — The level of correlation among index constituents implied by the pricing relationship between index and single-stock options.
Implied Volatility — The market’s options-derived expectation for the magnitude of future price movements.
NFP — Nonfarm Payrolls, a key U.S. employment report measuring changes in payroll employment excluding several categories, including farm workers.
Volatility Crush — A rapid decline in implied volatility, often following the resolution of a scheduled event or uncertainty.
VIX 1-Day — The Cboe 1-Day Volatility Index, which measures expected S&P 500 volatility over approximately the next trading day.
Disclosure
This report contains independent commentary to be used for informational and educational purposes only. Michael Kramer is a member and investment adviser representative with Mott Capital Management. Mr. Kramer is not affiliated with this company and does not serve on the board of any related company that issued this stock. All opinions and analyses presented by Michael Kramer in this analysis or market report are solely Michael Kramer’s views. Readers should not treat any opinion, viewpoint, or prediction expressed by Michael Kramer as a specific solicitation or recommendation to buy or sell a particular security or follow a particular strategy. Michael Kramer’s analyses are based upon information and independent research that he considers reliable, but neither Michael Kramer nor Mott Capital Management guarantees its completeness or accuracy, and it should not be relied upon as such. Michael Kramer is not under any obligation to update or correct any information presented in his analyses. Mr. Kramer’s statements, guidance, and opinions are subject to change without notice. Past performance is not indicative of future results. Neither Michael Kramer nor Mott Capital Management guarantees any specific outcome or profit. You should be aware of the real risk of loss in following any strategy or investment commentary presented in this analysis. Strategies or investments discussed may fluctuate in price or value. Investments or strategies mentioned in this analysis may not be suitable for you. This material does not consider your particular investment objectives, financial situation, or needs and is not intended as a recommendation appropriate for you. You must make an independent decision regarding investments or strategies in this analysis. Upon request, the advisor will provide a list of all recommendations made during the past twelve months. Before acting on information in this analysis, you should consider whether it is suitable for your circumstances and strongly consider seeking advice from your own financial or investment adviser to determine the suitability of any investment.