
Record VIXEQ-to-VIX Spread Signals Growing Market Tensions


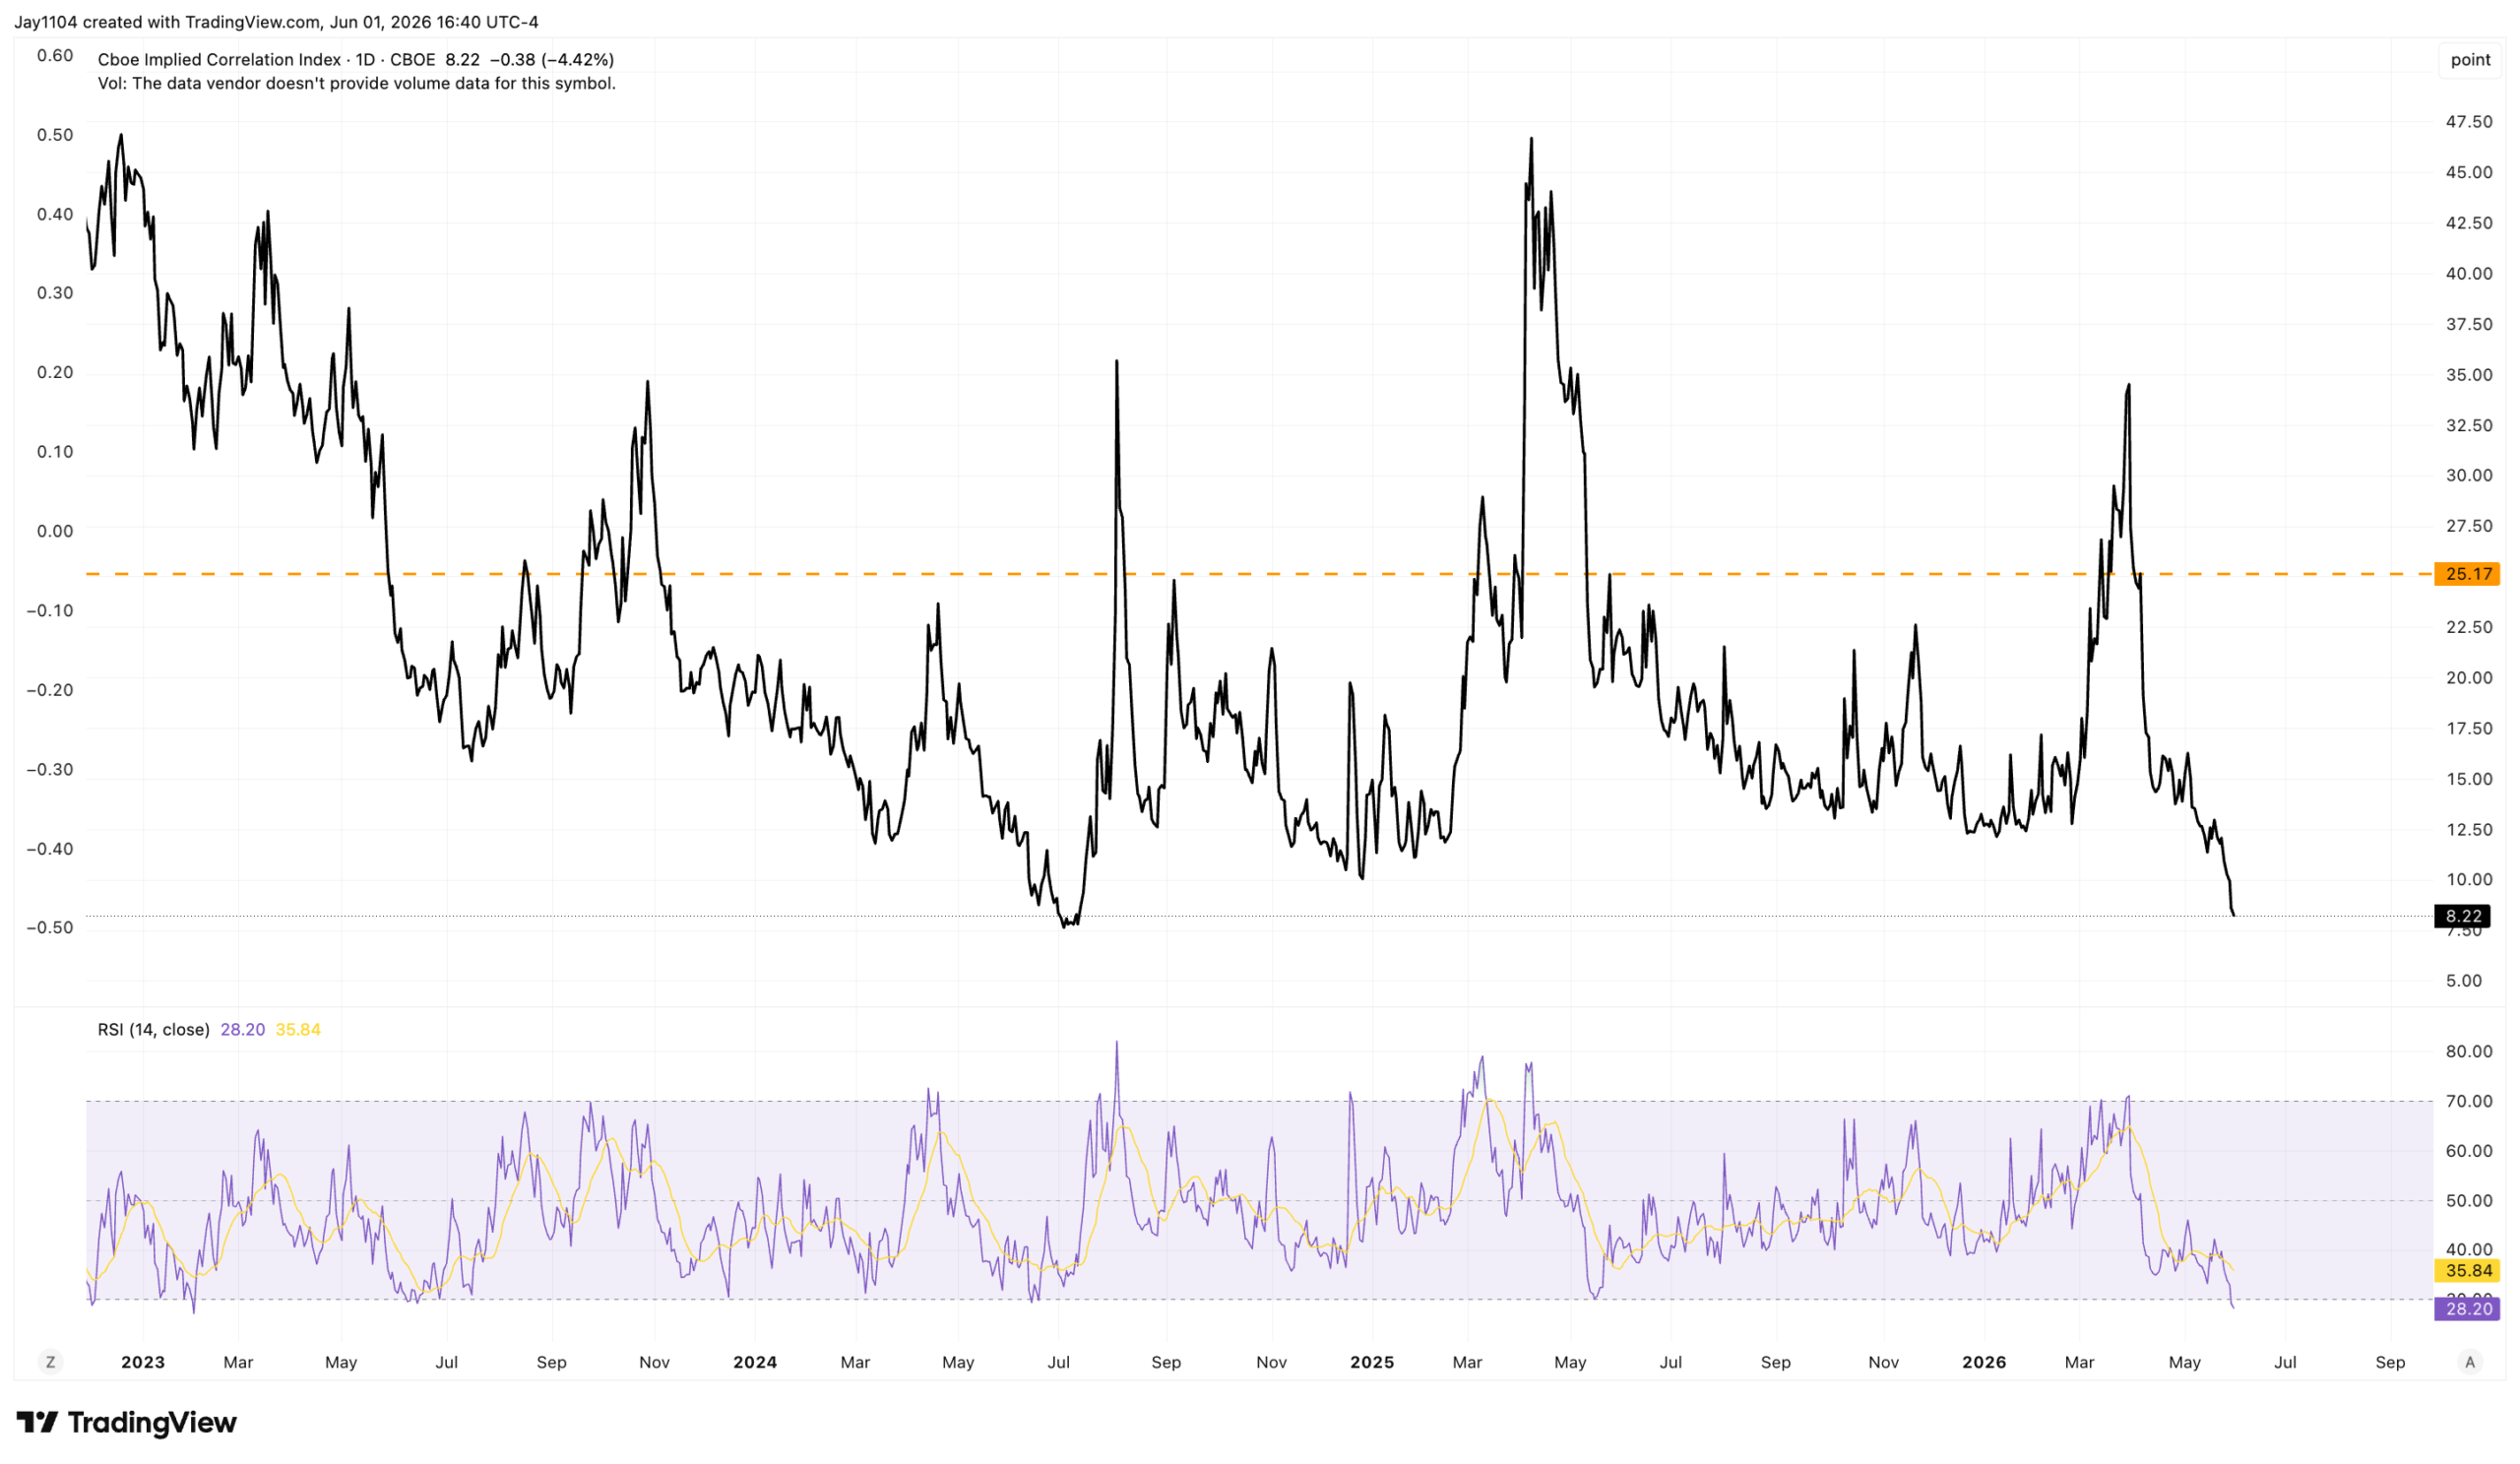
The S&P 500 finished the day higher by around 26 bps, while dispersion continued to rise and correlations moved lower. The 3-month implied correlation index closed at 8.22, its lowest level since July 2024, when it closed at 7.6.
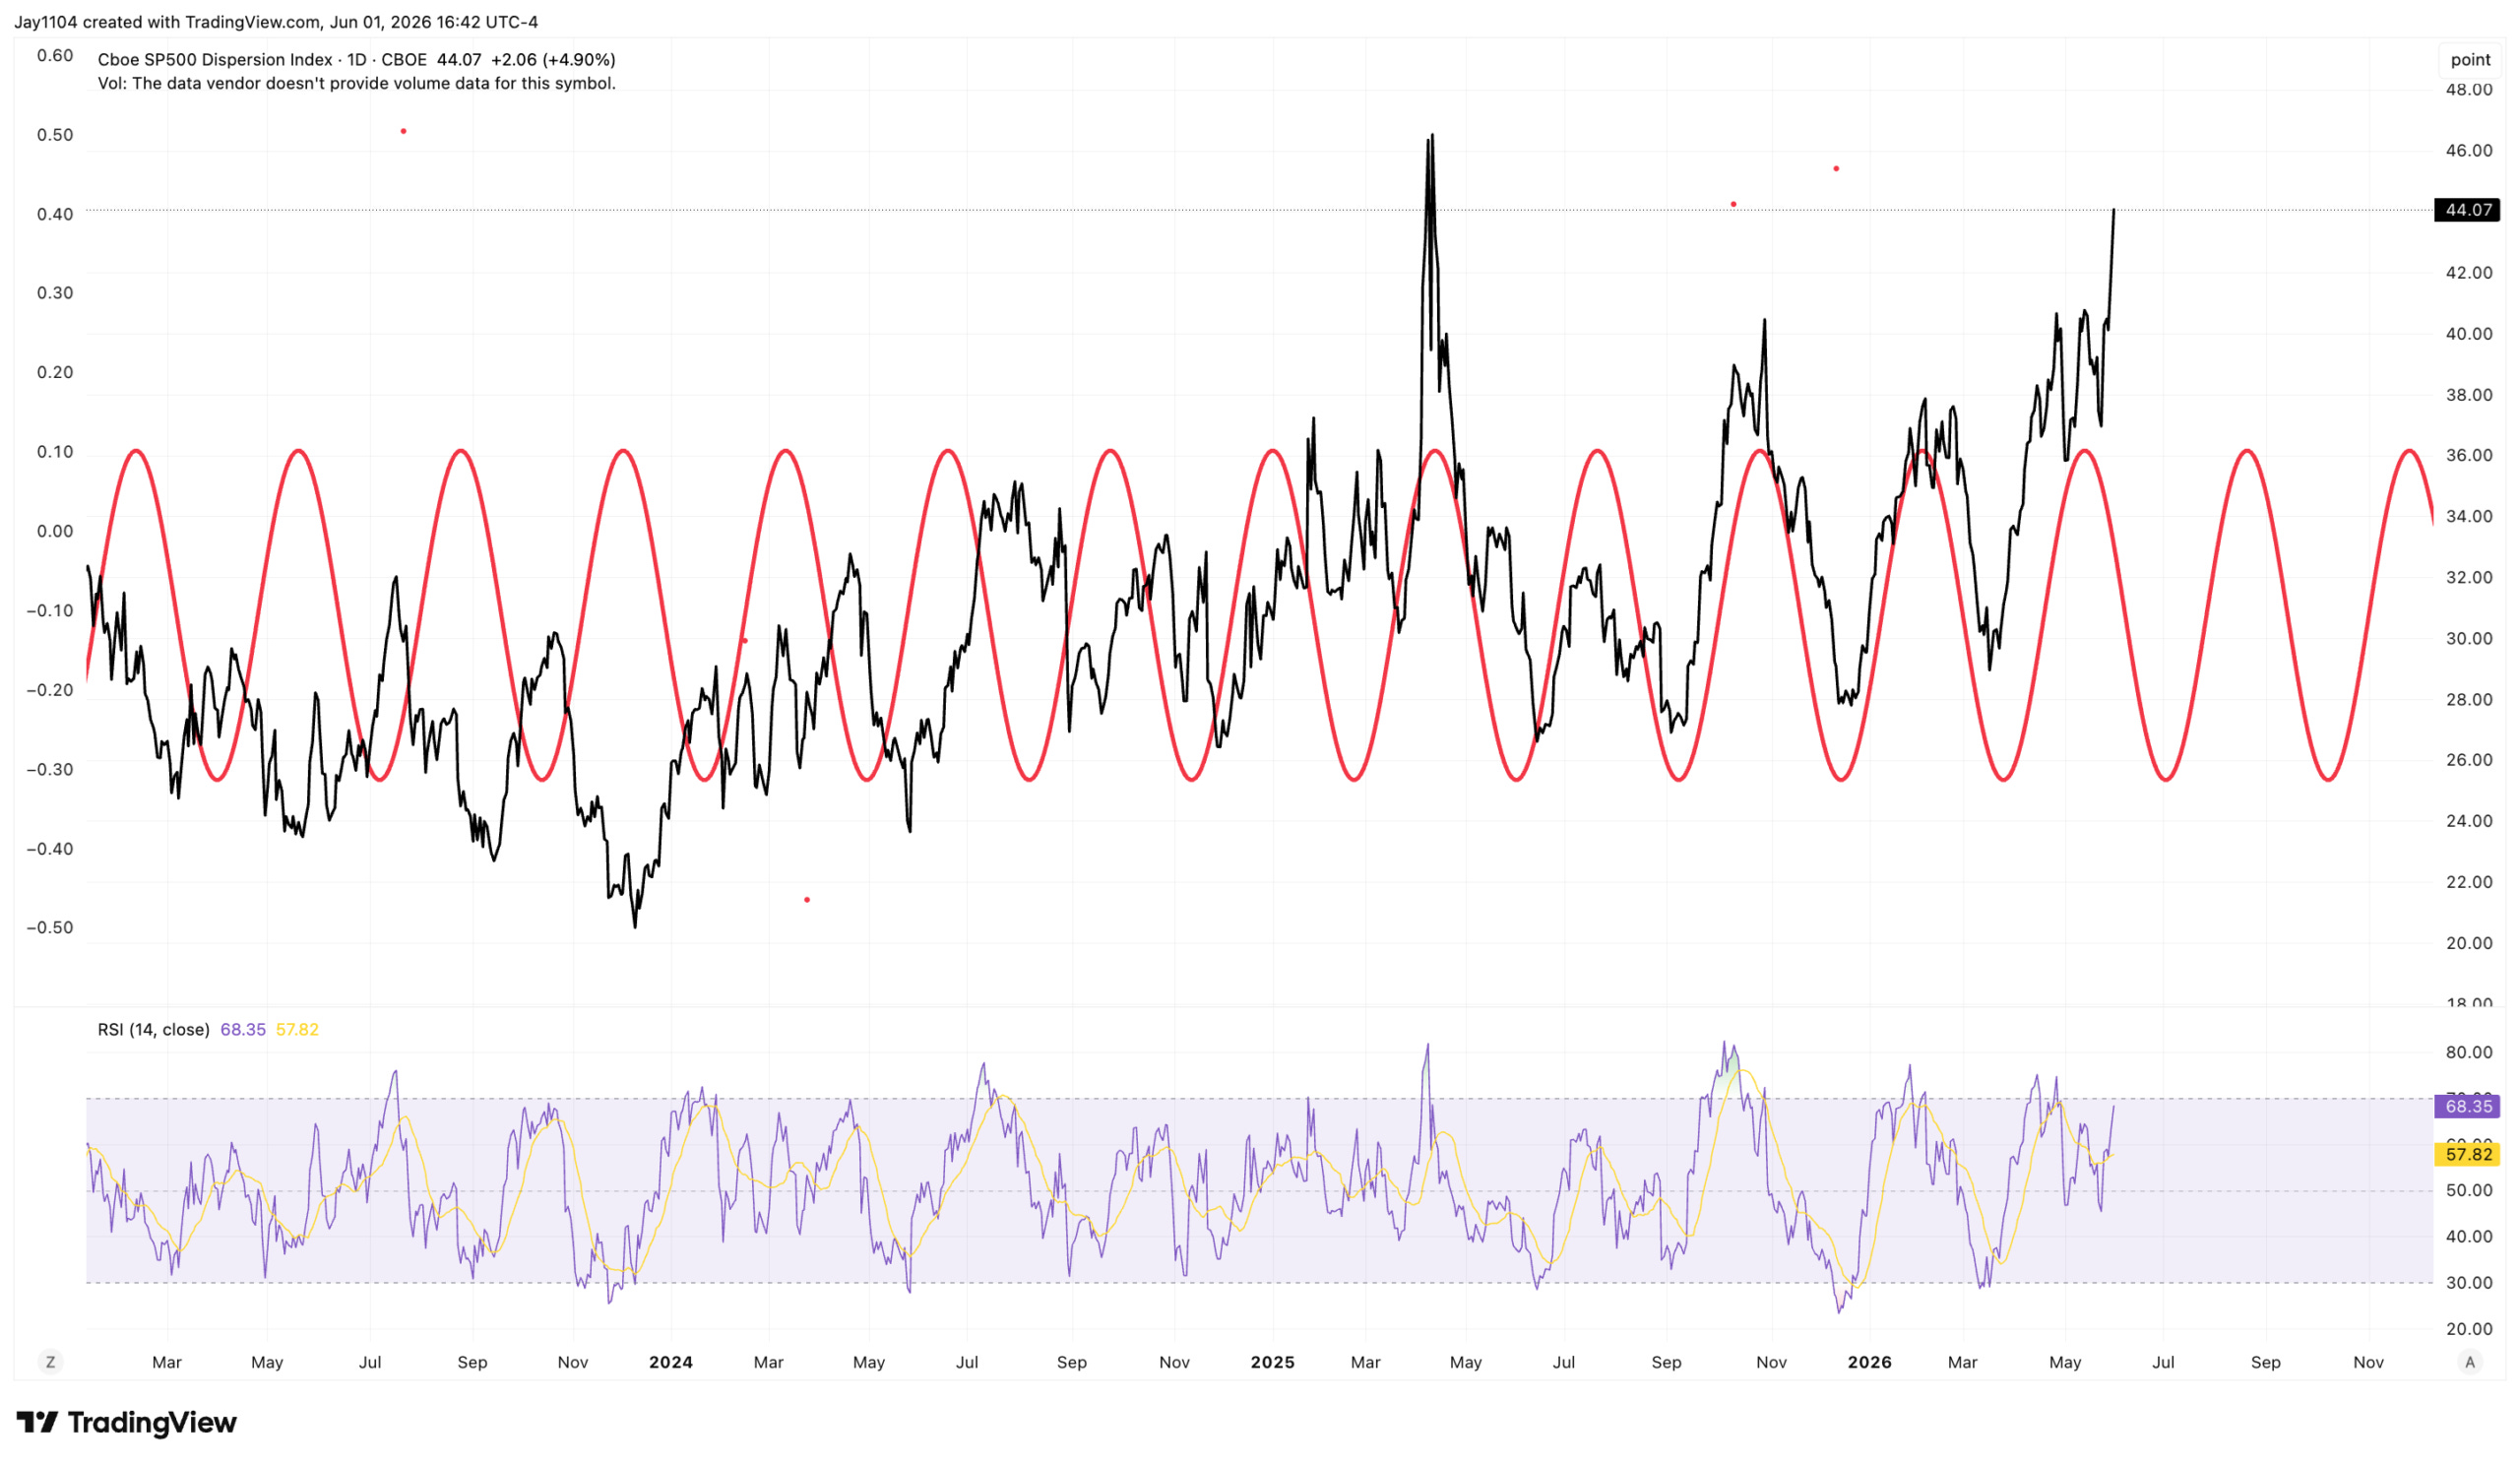
Meanwhile, the dispersion index rose to 44 today, closing at its highest level since April 2025.
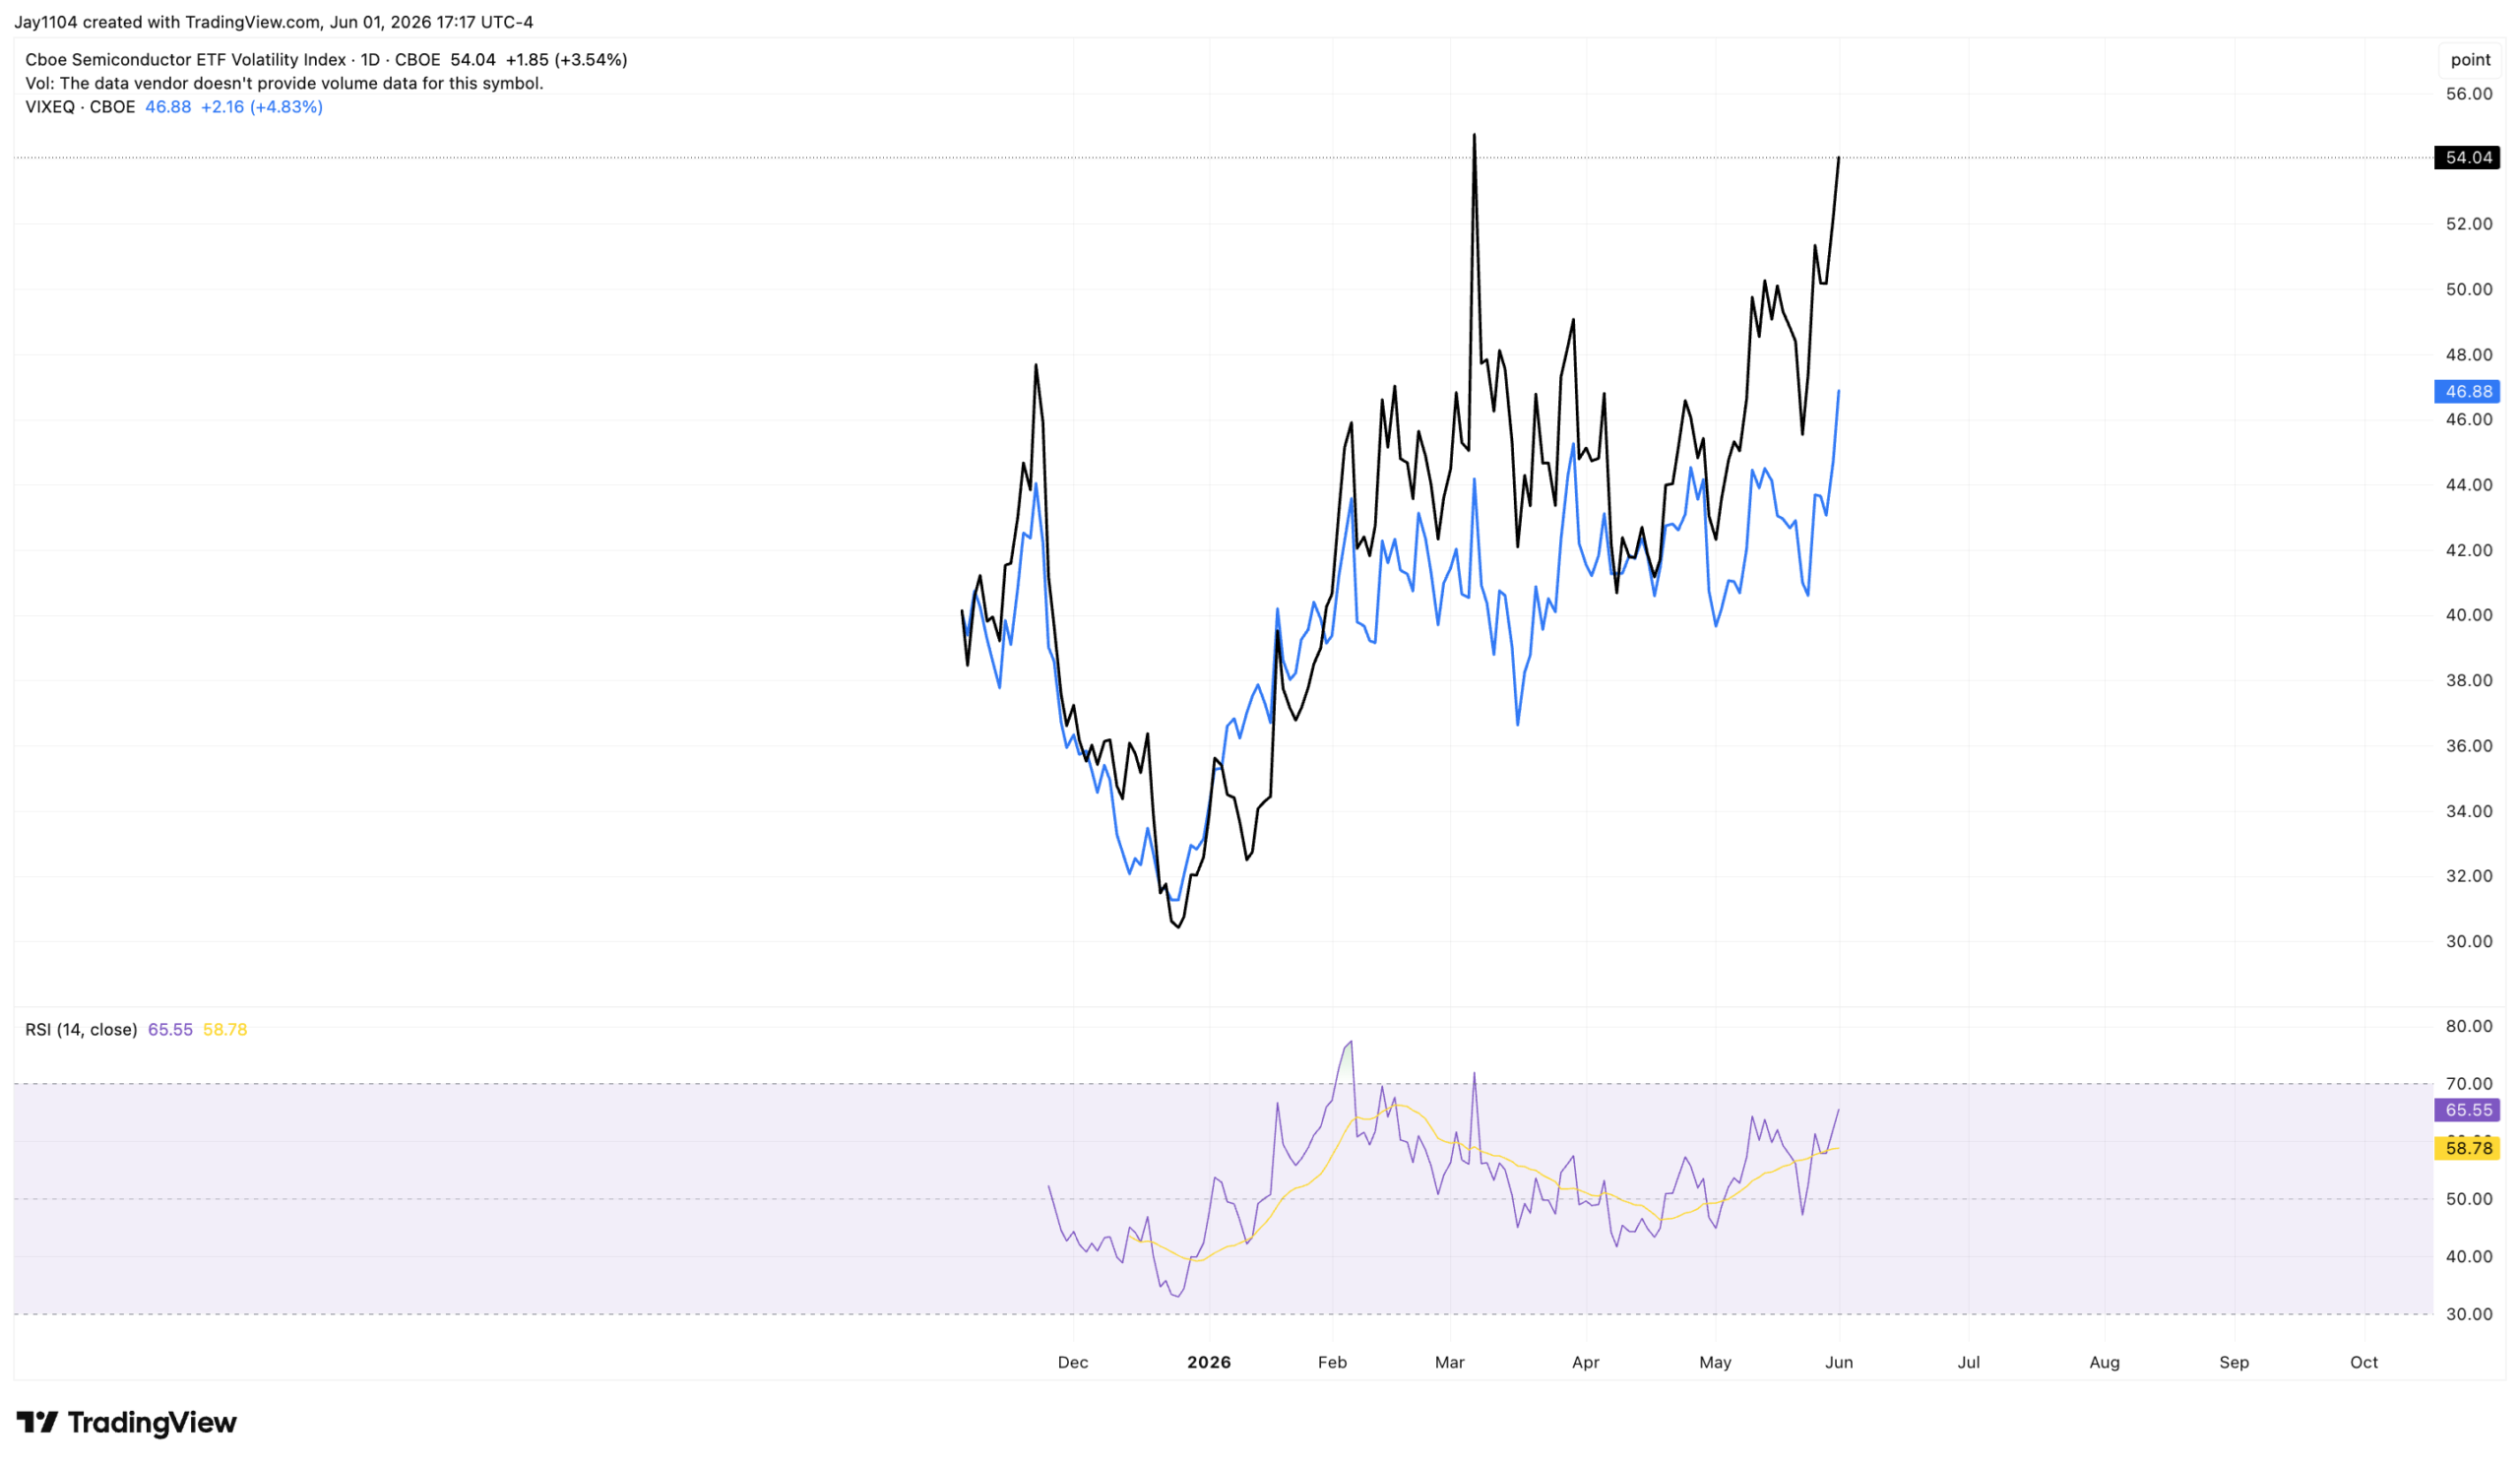
The reason this continues is that single-stock volatility keeps rising, with the spread between the VIXEQ and the VIX now at 30.8, its widest level on record. Historically, spikes in this spread have been associated with fairly sizable market pullbacks.
At some point, the trade will likely reverse, and the long single-stock volatility positions that have helped fuel this move will begin to unwind. When that happens, it could create a meaningful shift in market dynamics, as the index vol side unwinds too.

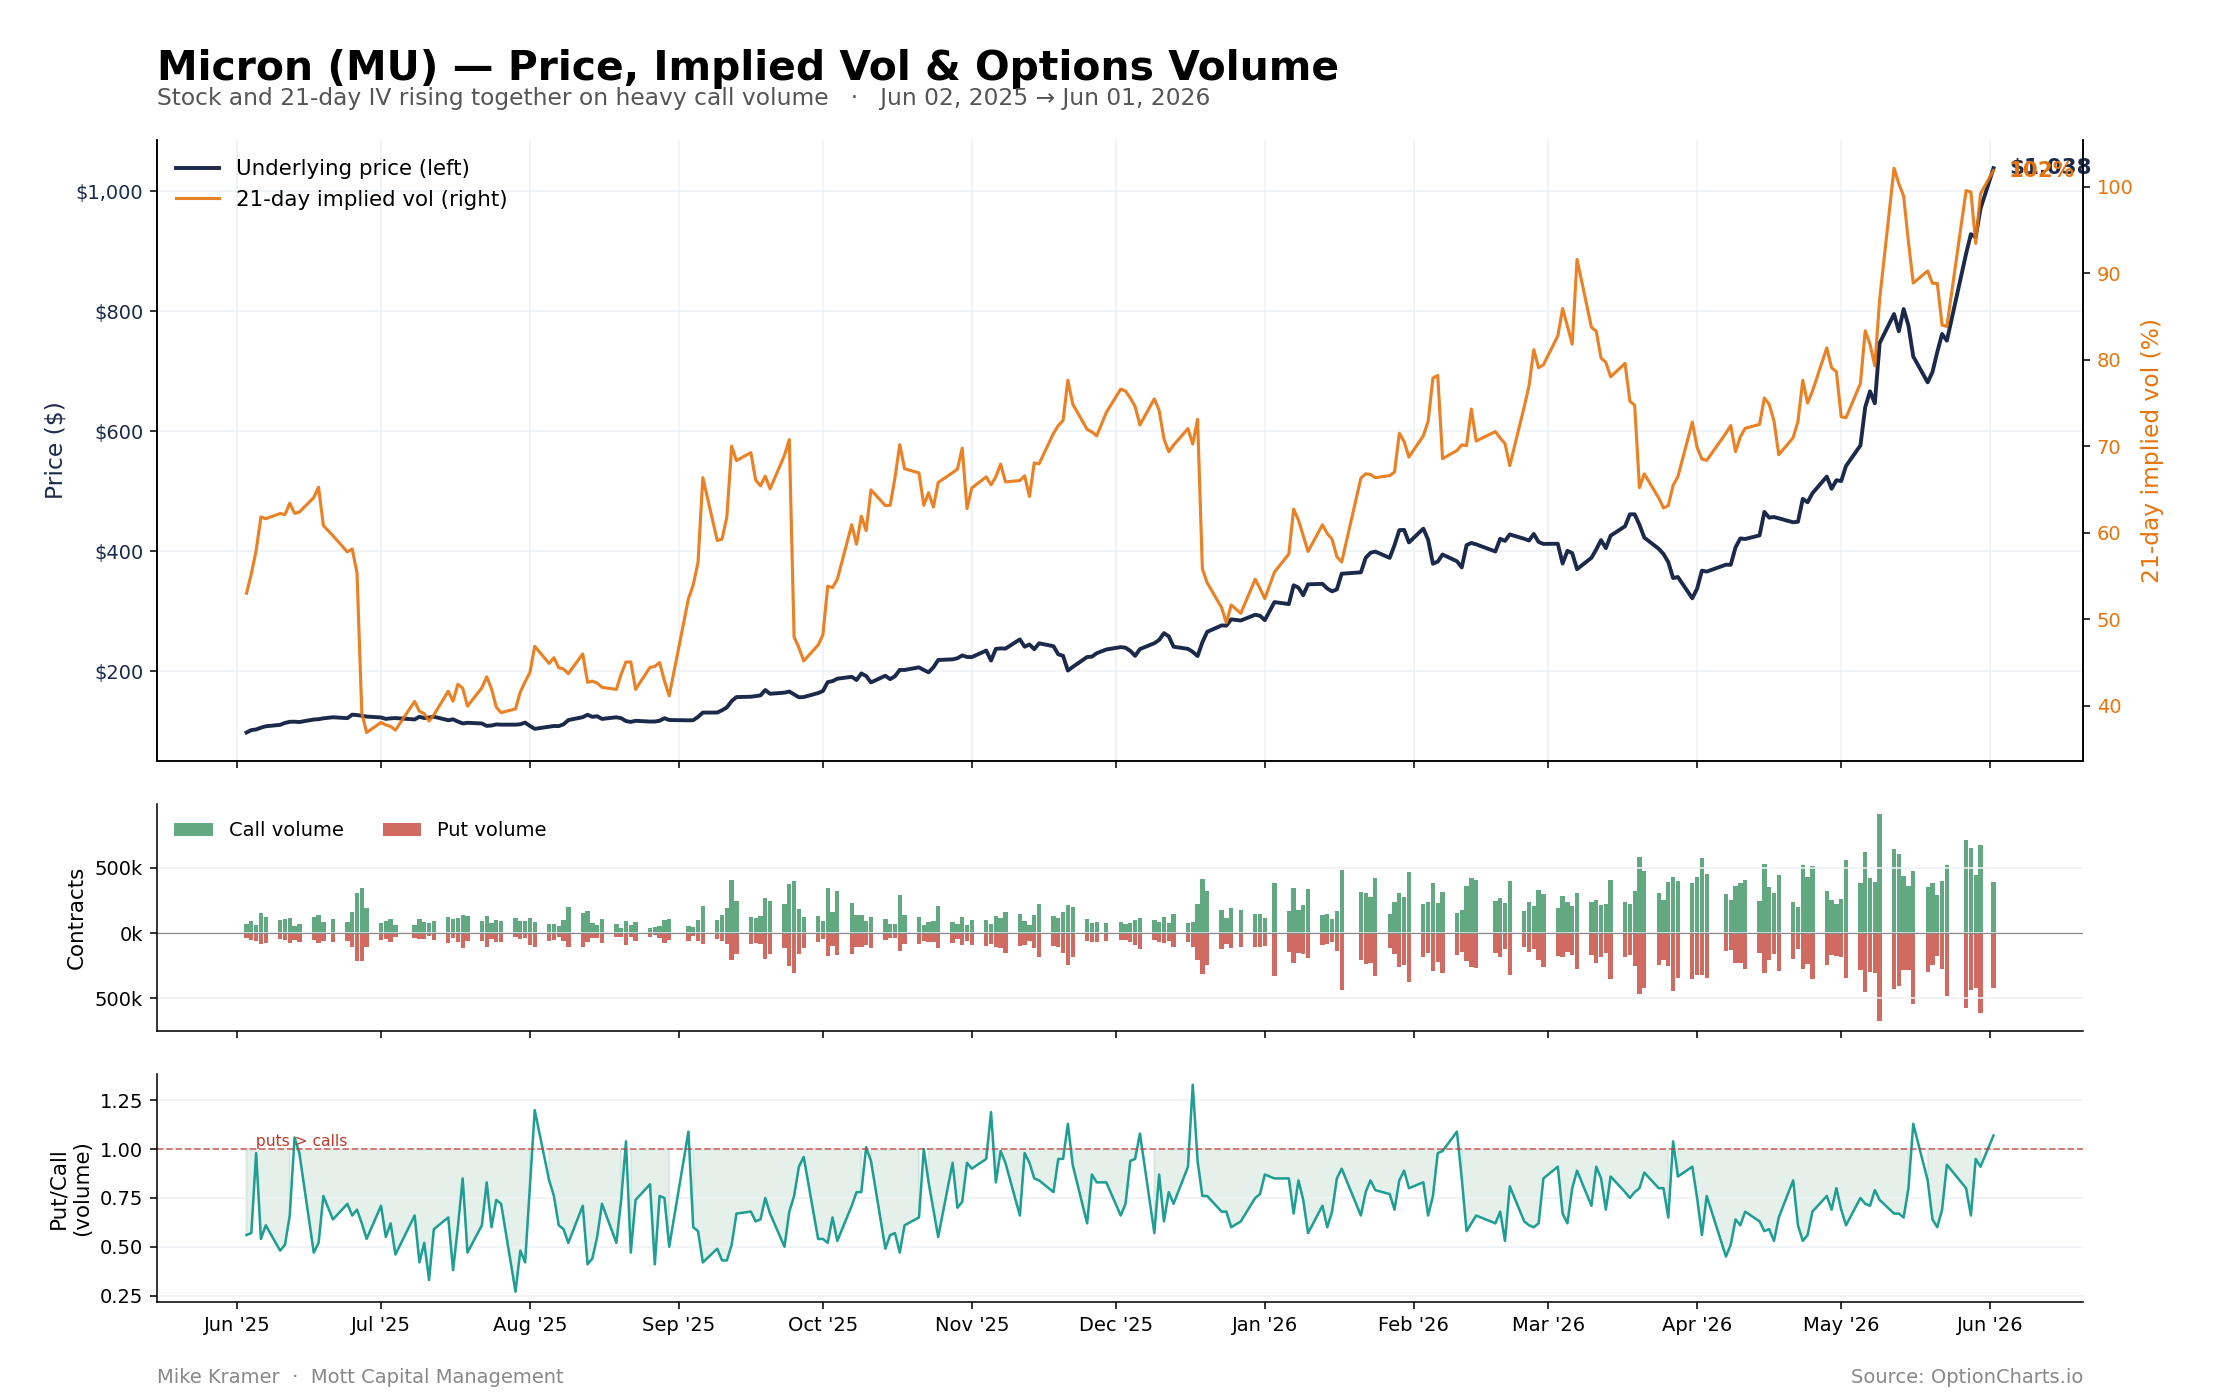
We can see that implied volatility for Micron continued to rise today, with the 21-day implied volatility rising to 101.9%. One thing I found interesting was that the put-to-call ratio rose to 1.07.
Maybe it means something, maybe it doesn’t, but it is the first time in a while that put volume has exceeded call volume. From the looks of the data, call volume was also weaker today than it has been recently. That could matter because, as implied volatility rises, call options become increasingly expensive, and at some point, you would expect demand for calls to begin to subside.
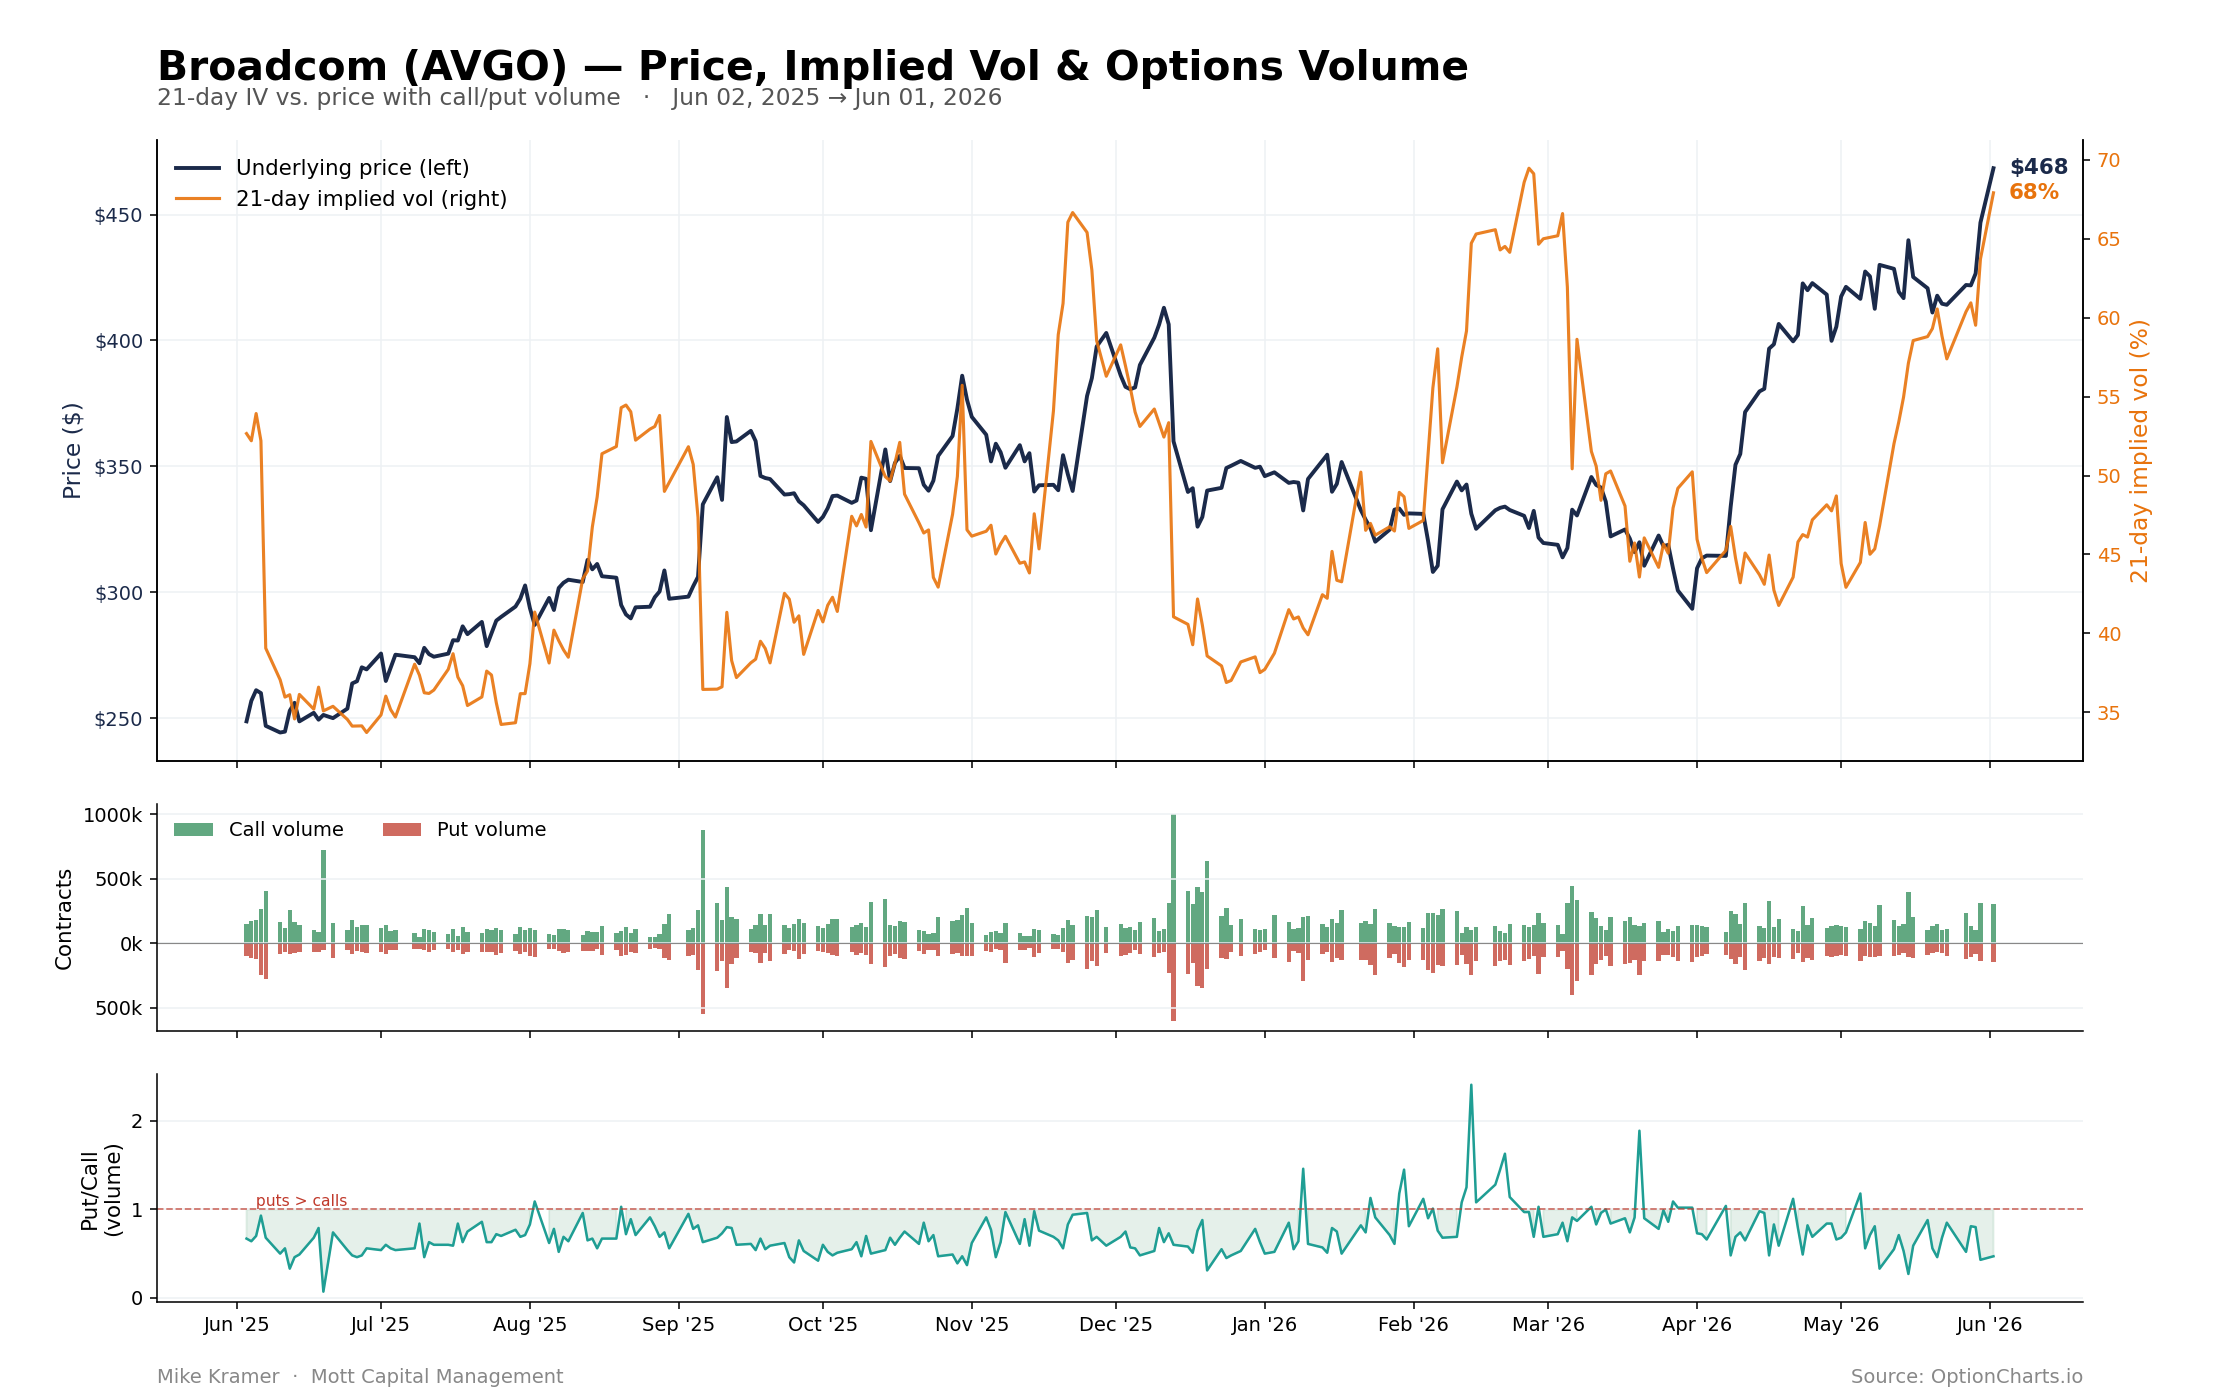
The point is that, with implied volatilities rising across many stocks in the semiconductor space, including names like IBM, this is one reason we continue to see dispersion rise and correlations fall. Broadcom is another stock experiencing a sharp increase in implied volatility, with the key difference being that it is scheduled to report earnings on June 3 after the close.
The thing to watch is what happens after Broadcom reports. Implied volatility should fall sharply following the earnings release. Whether that triggers a broader cascade across the rest of the sector will be something worth monitoring.
The SMH implied volatility index, for which we have a very small sample size, closed at 54. This appears to be the key IV index to watch over the next few days, considering that the VIXEQ and VXSMH have closely followed one another.
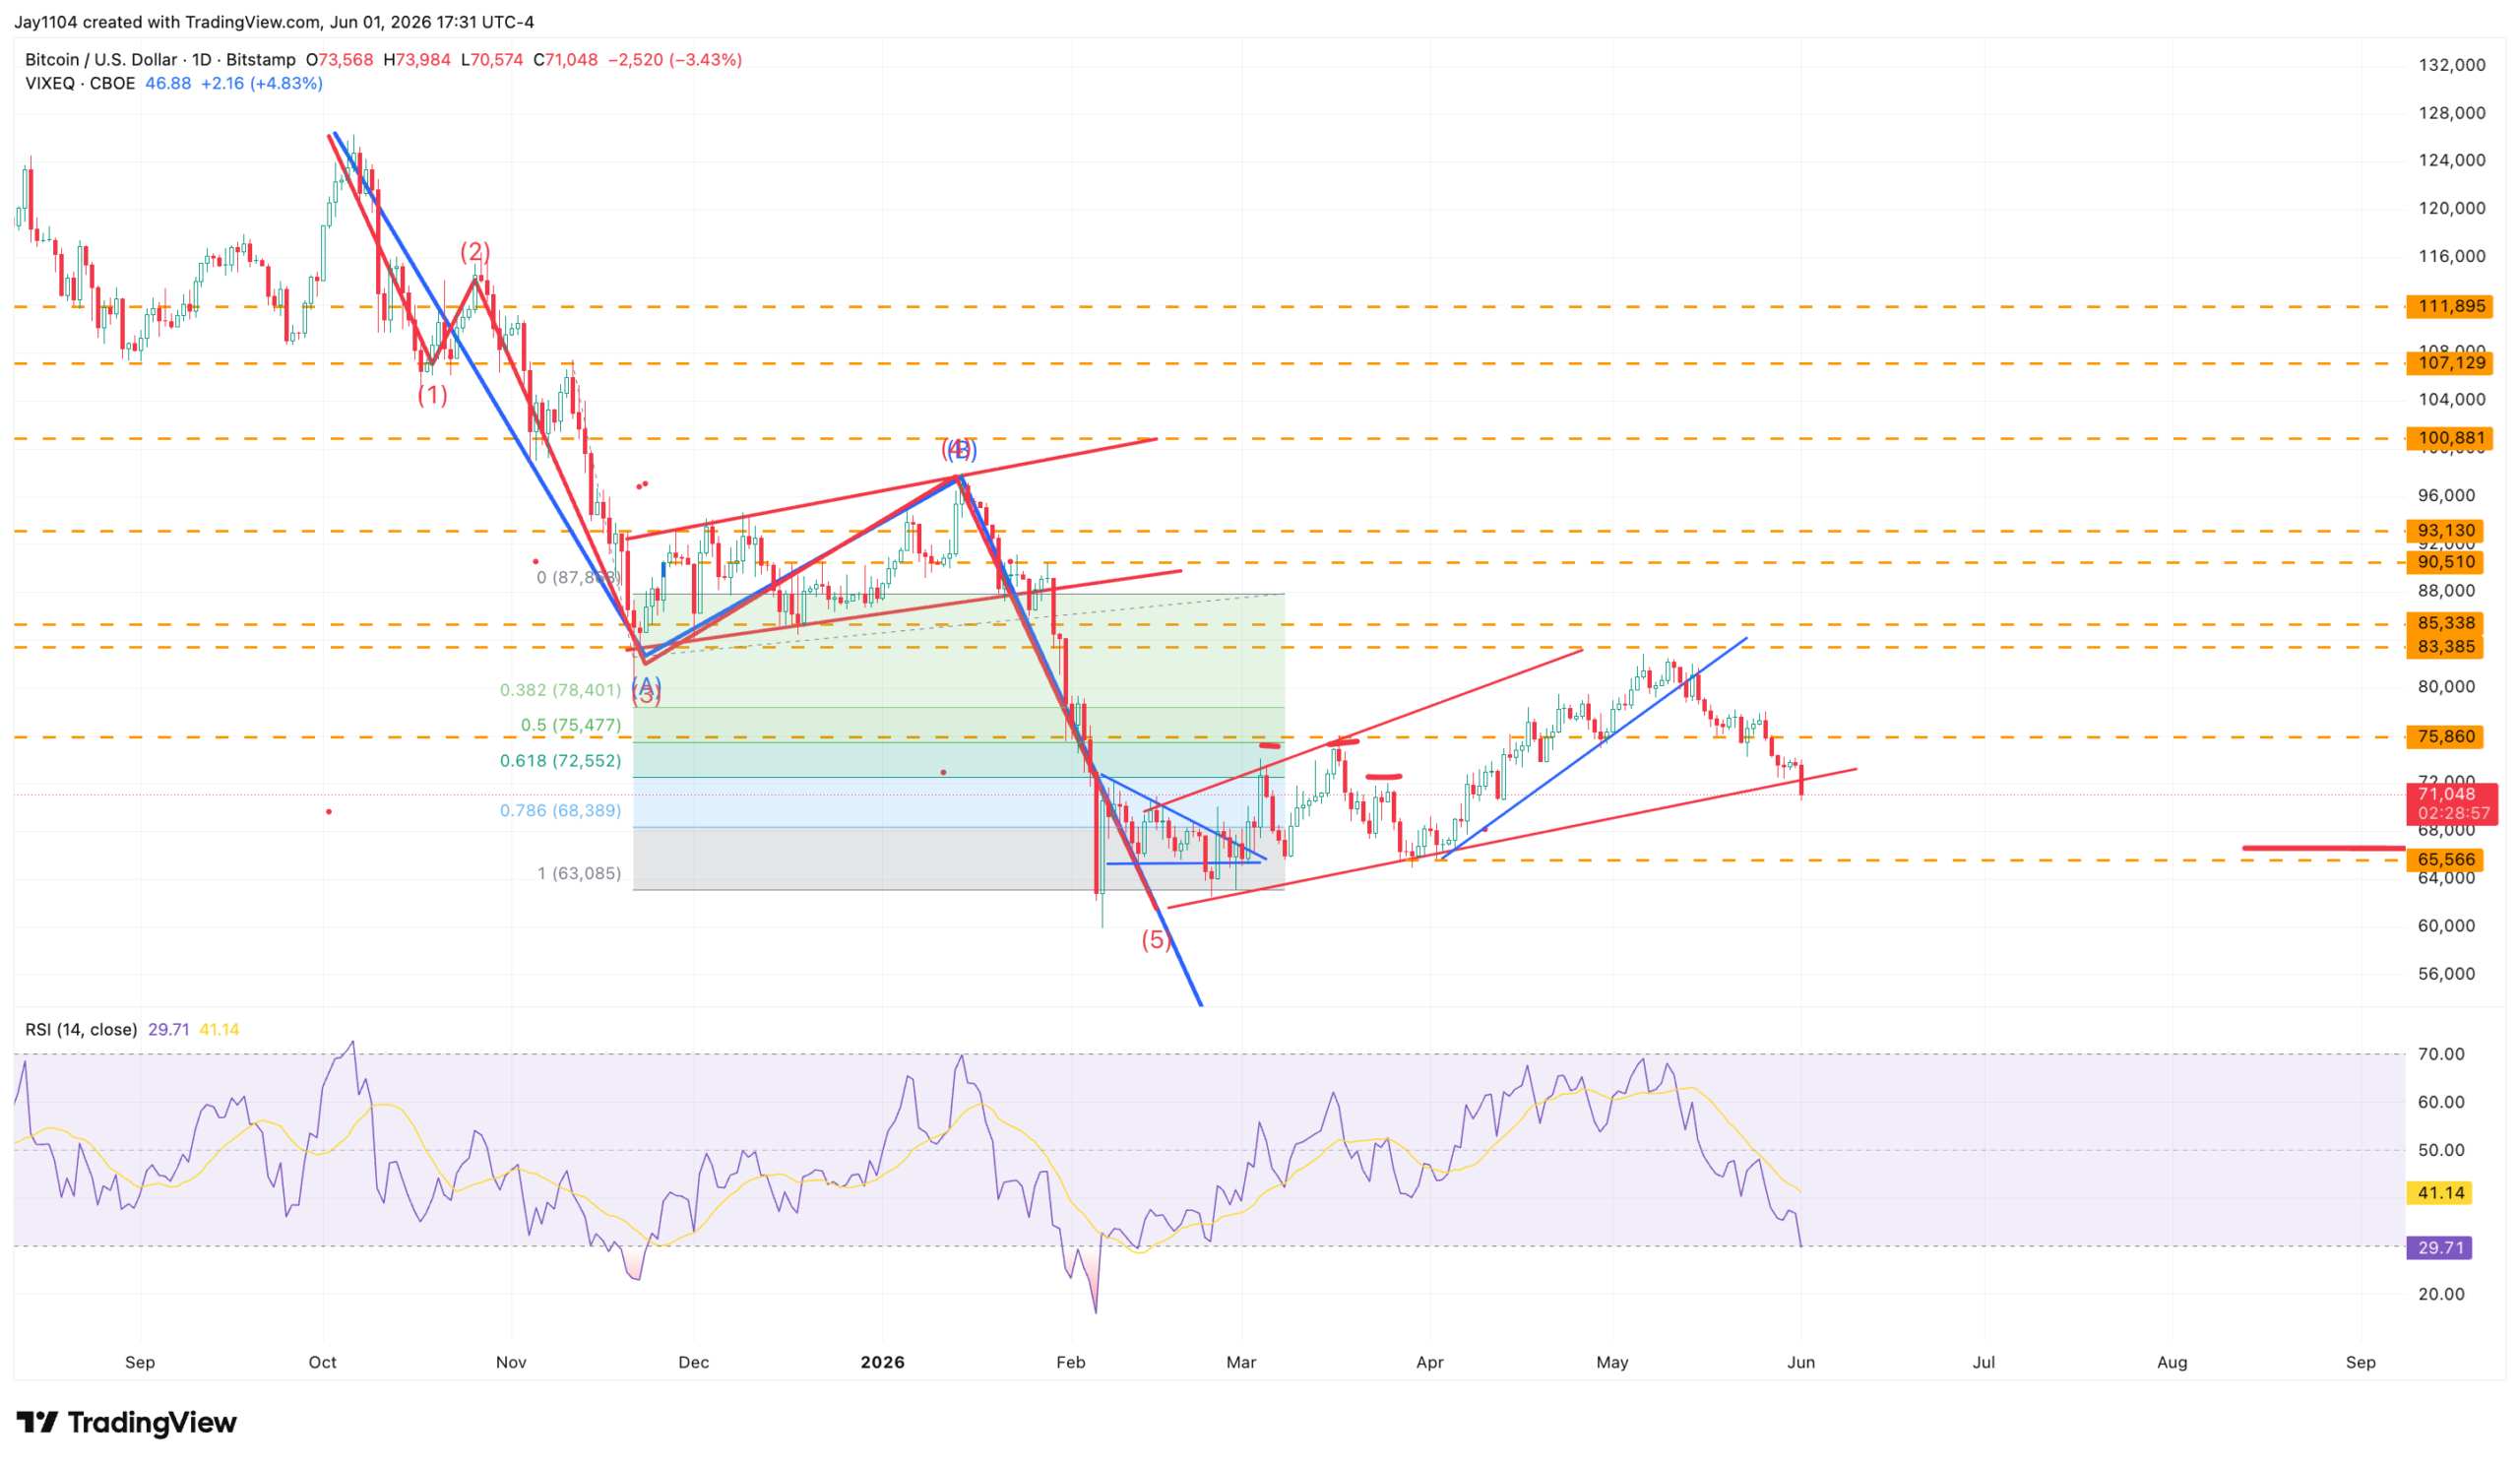
Finally, my preferred liquidity gauge, otherwise known as Bitcoin, fell by more than 3% today and broke below an uptrend around $72,000 that can be traced back to February. I do not think a decline to $66,000 can be ruled out at this point, as that appears to be the next meaningful level of support.
-Mike
Glossary by ChatGPT
Correlation — A statistical measure of how closely securities move in relation to one another.
Dispersion — The degree to which individual stock returns differ from the overall market or from each other.
Implied Correlation Index — A market-derived measure estimating the expected correlation among stocks within an index based on option prices.
Implied Volatility (IV) — The market’s forecast of a security’s future price volatility derived from option prices.
Liquidity Gauge — An asset or indicator used to assess the availability of market liquidity and risk appetite.
Put-to-Call Ratio — The ratio of traded put options to call options, often used to gauge investor sentiment.
Semiconductor Sector — The group of companies involved in the design, manufacture, and sale of semiconductor chips and related technologies.
Single-Stock Volatility — The expected price volatility of an individual stock, typically measured through its options market.
VIX — The CBOE Volatility Index, which measures expected 30-day volatility for the S&P 500.
VIXEQ — An implied volatility index that measures expected volatility across individual S&P 500 constituent stocks.
VXSMH — An implied volatility index tied to the VanEck Semiconductor ETF, reflecting expected volatility in the semiconductor sector.
Disclosure
This report contains independent commentary to be used for informational and educational purposes only. Michael Kramer is a member and investment adviser representative with Mott Capital Management. Mr. Kramer is not affiliated with this company and does not serve on the board of any related company that issued this stock. All opinions and analyses presented by Michael Kramer in this analysis or market report are solely Michael Kramer’s views. Readers should not treat any opinion, viewpoint, or prediction expressed by Michael Kramer as a specific solicitation or recommendation to buy or sell a particular security or follow a particular strategy. Michael Kramer’s analyses are based upon information and independent research that he considers reliable, but neither Michael Kramer nor Mott Capital Management guarantees its completeness or accuracy, and it should not be relied upon as such. Michael Kramer is not under any obligation to update or correct any information presented in his analyses. Mr. Kramer’s statements, guidance, and opinions are subject to change without notice. Past performance is not indicative of future results. Neither Michael Kramer nor Mott Capital Management guarantees any specific outcome or profit. You should be aware of the real risk of loss in following any strategy or investment commentary presented in this analysis. Strategies or investments discussed may fluctuate in price or value. Investments or strategies mentioned in this analysis may not be suitable for you. This material does not consider your particular investment objectives, financial situation, or needs and is not intended as a recommendation appropriate for you. You must make an independent decision regarding investments or strategies in this analysis. Upon request, the advisor will provide a list of all recommendations made during the past twelve months. Before acting on information in this analysis, you should consider whether it is suitable for your circumstances and strongly consider seeking advice from your own financial or investment adviser to determine the suitability of any investment.