
Options Markets Reflect Growing Macro Risk

The S&P 500 finished slightly higher on the day, rising by around 13 bps. The index continues to churn beneath the surface, with semiconductors leading the charge. Over the last 30 trading days, the XLK ETF has outperformed the S&P 500 by 21.2%, while every other sector has lagged the index.
Of course, this is nothing new, as it has been the case since the March lows. However, I think it once again highlights the disparity within the index.
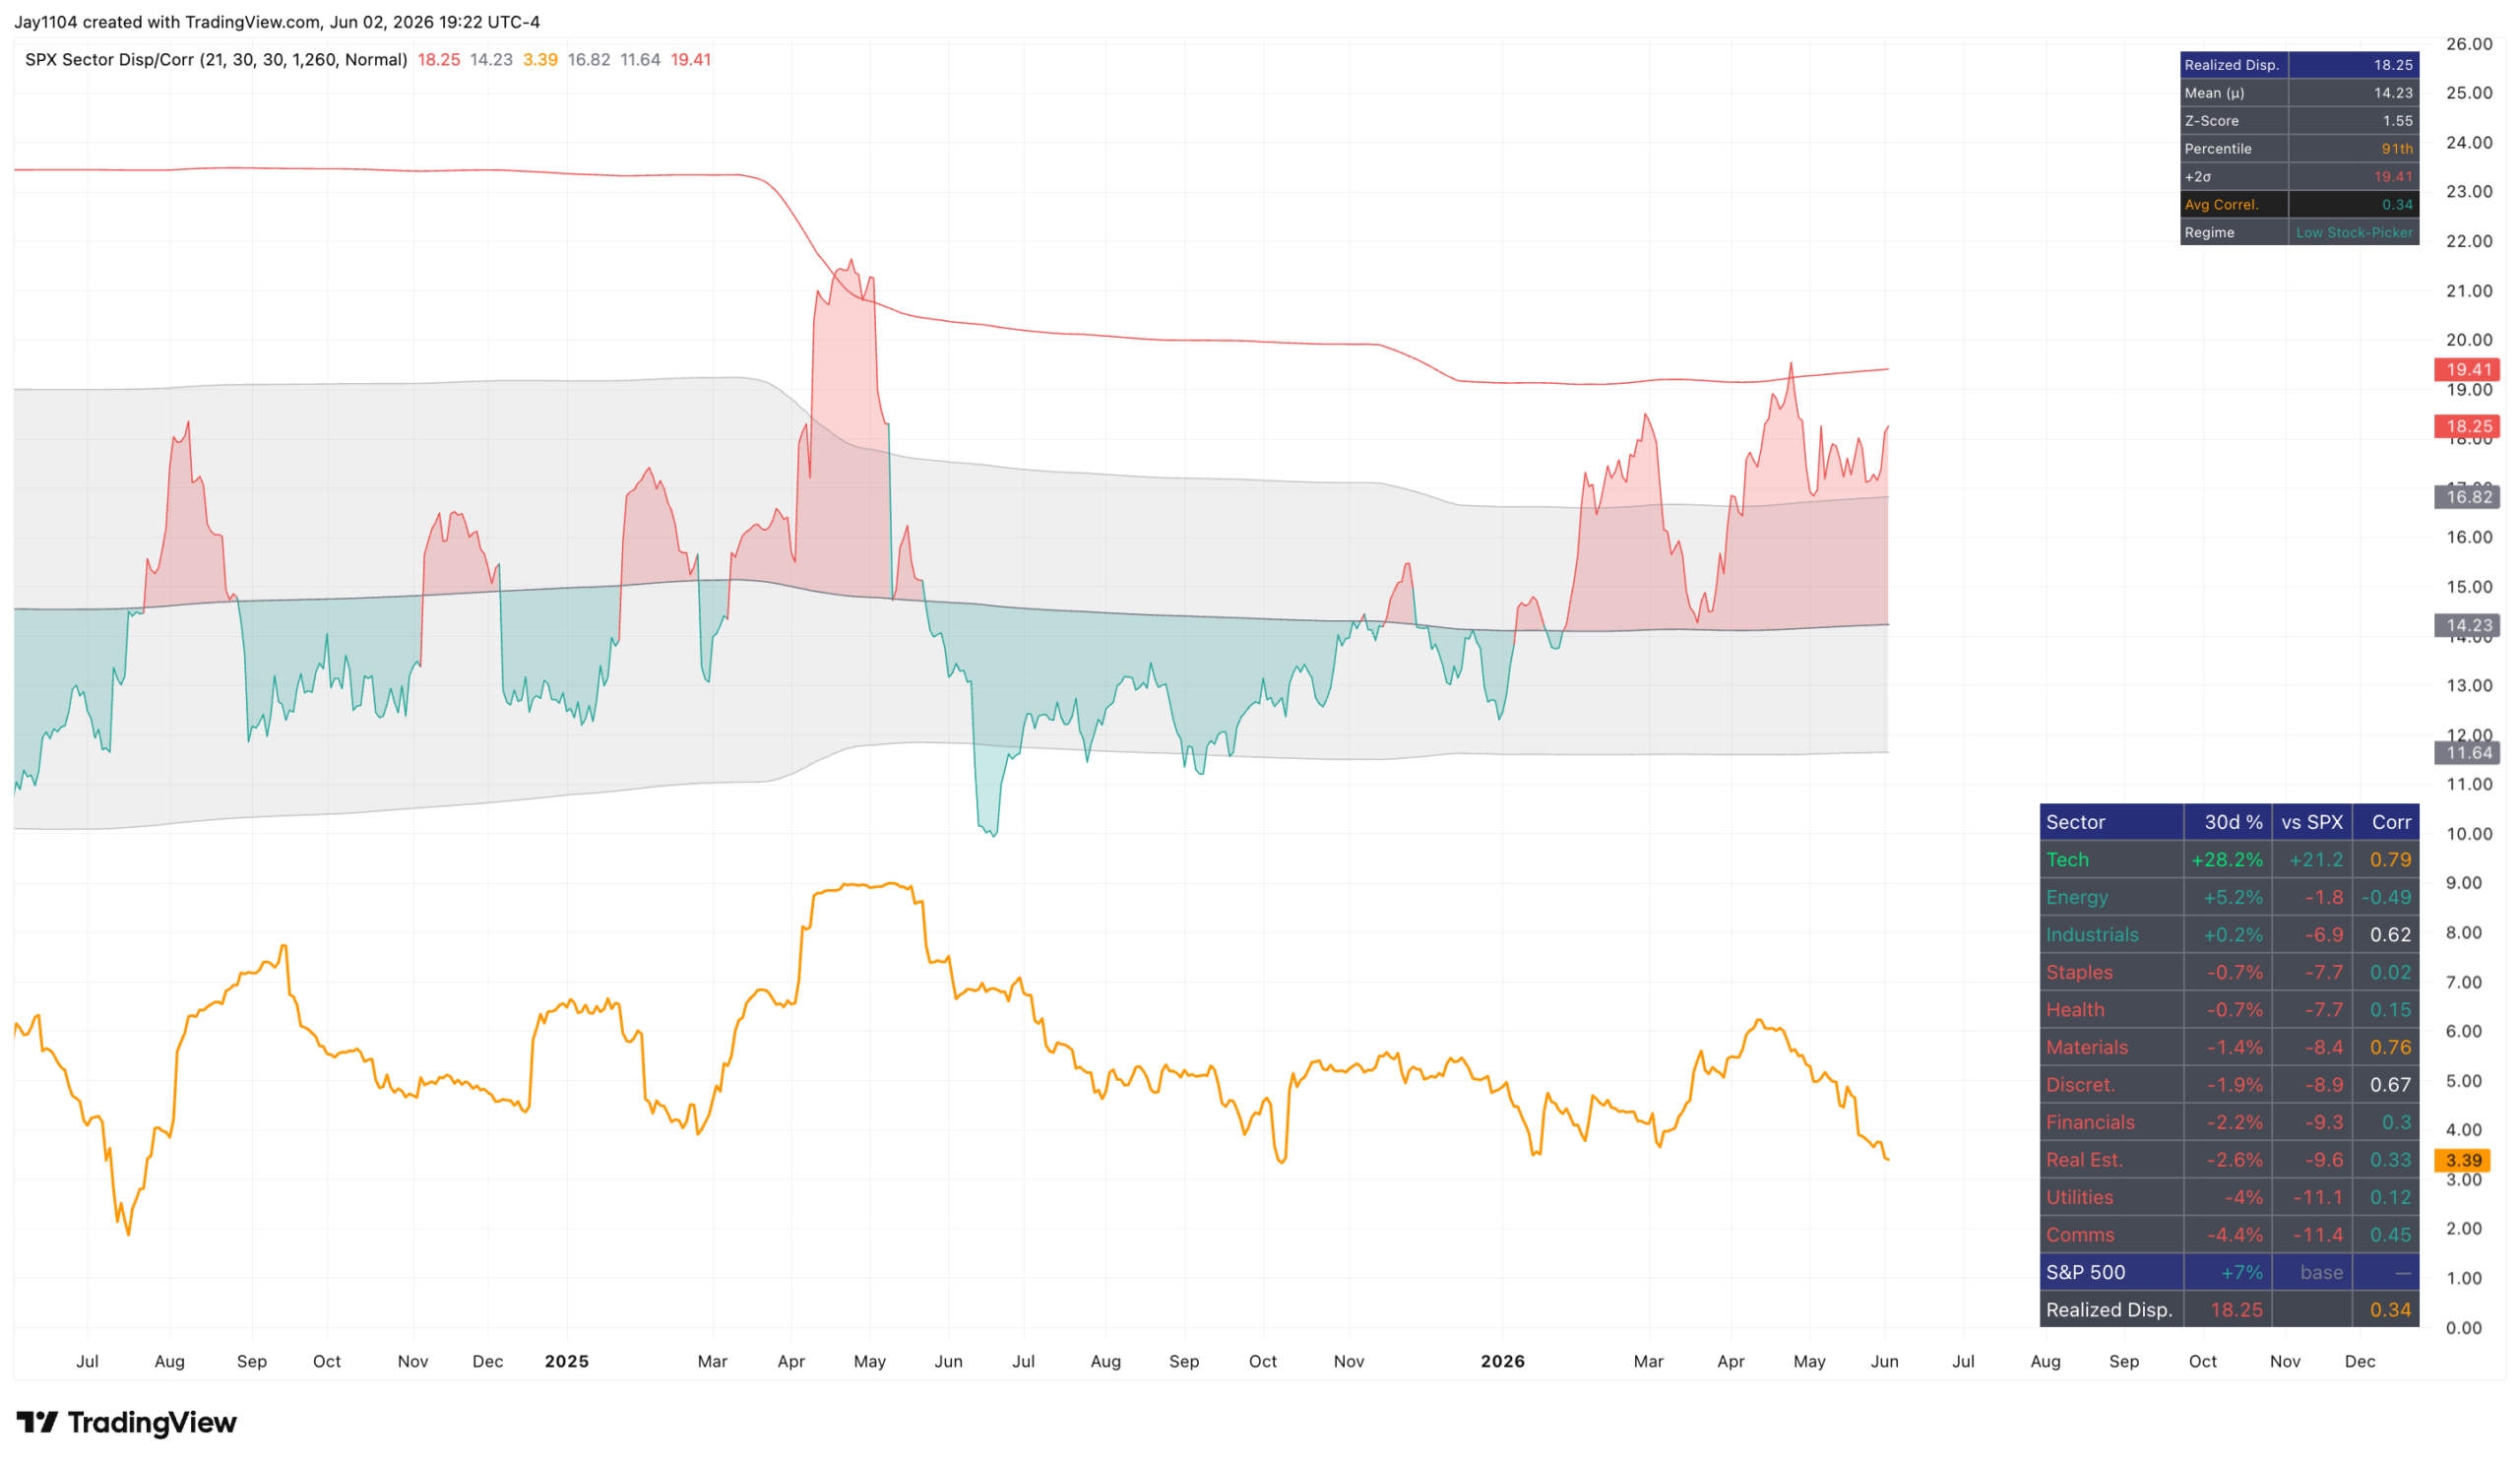
That is probably why the S&P 500 Dispersion Index is trading at levels not seen since the COVID crash and the tariff tantrum. However, the dispersion index declined slightly today. Given how elevated it has become, it seems well overdue for a rollover.
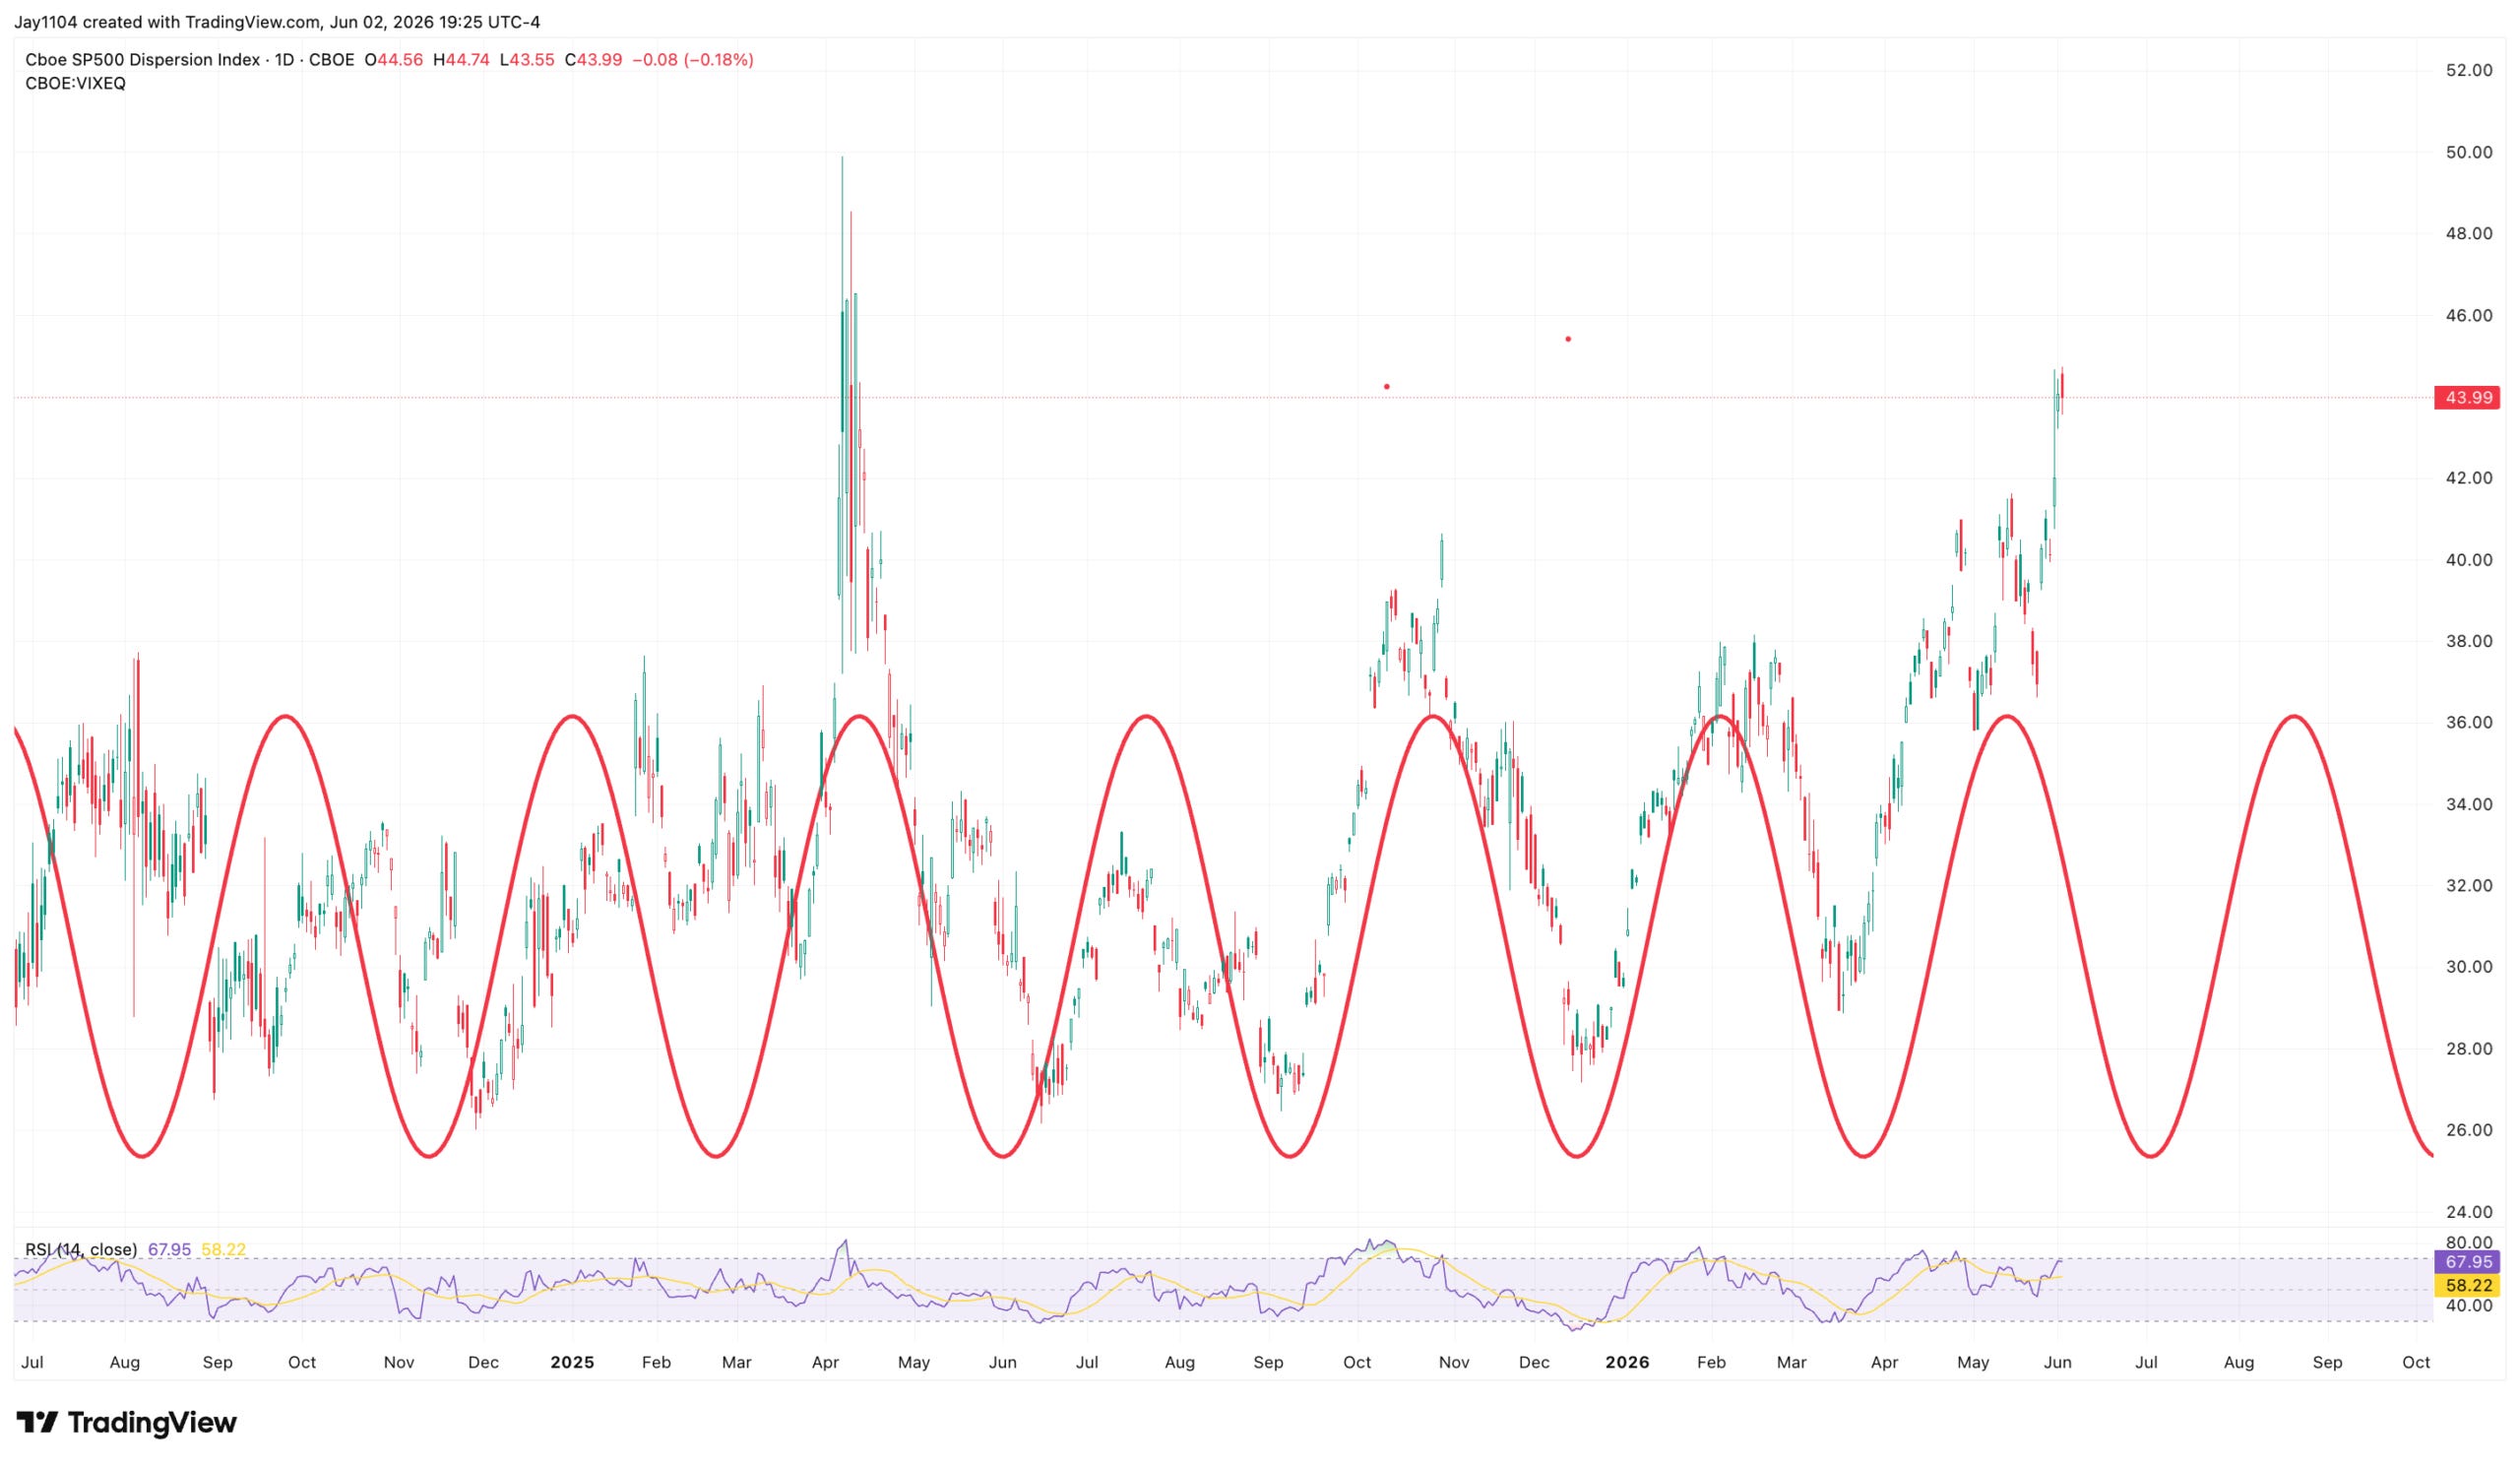
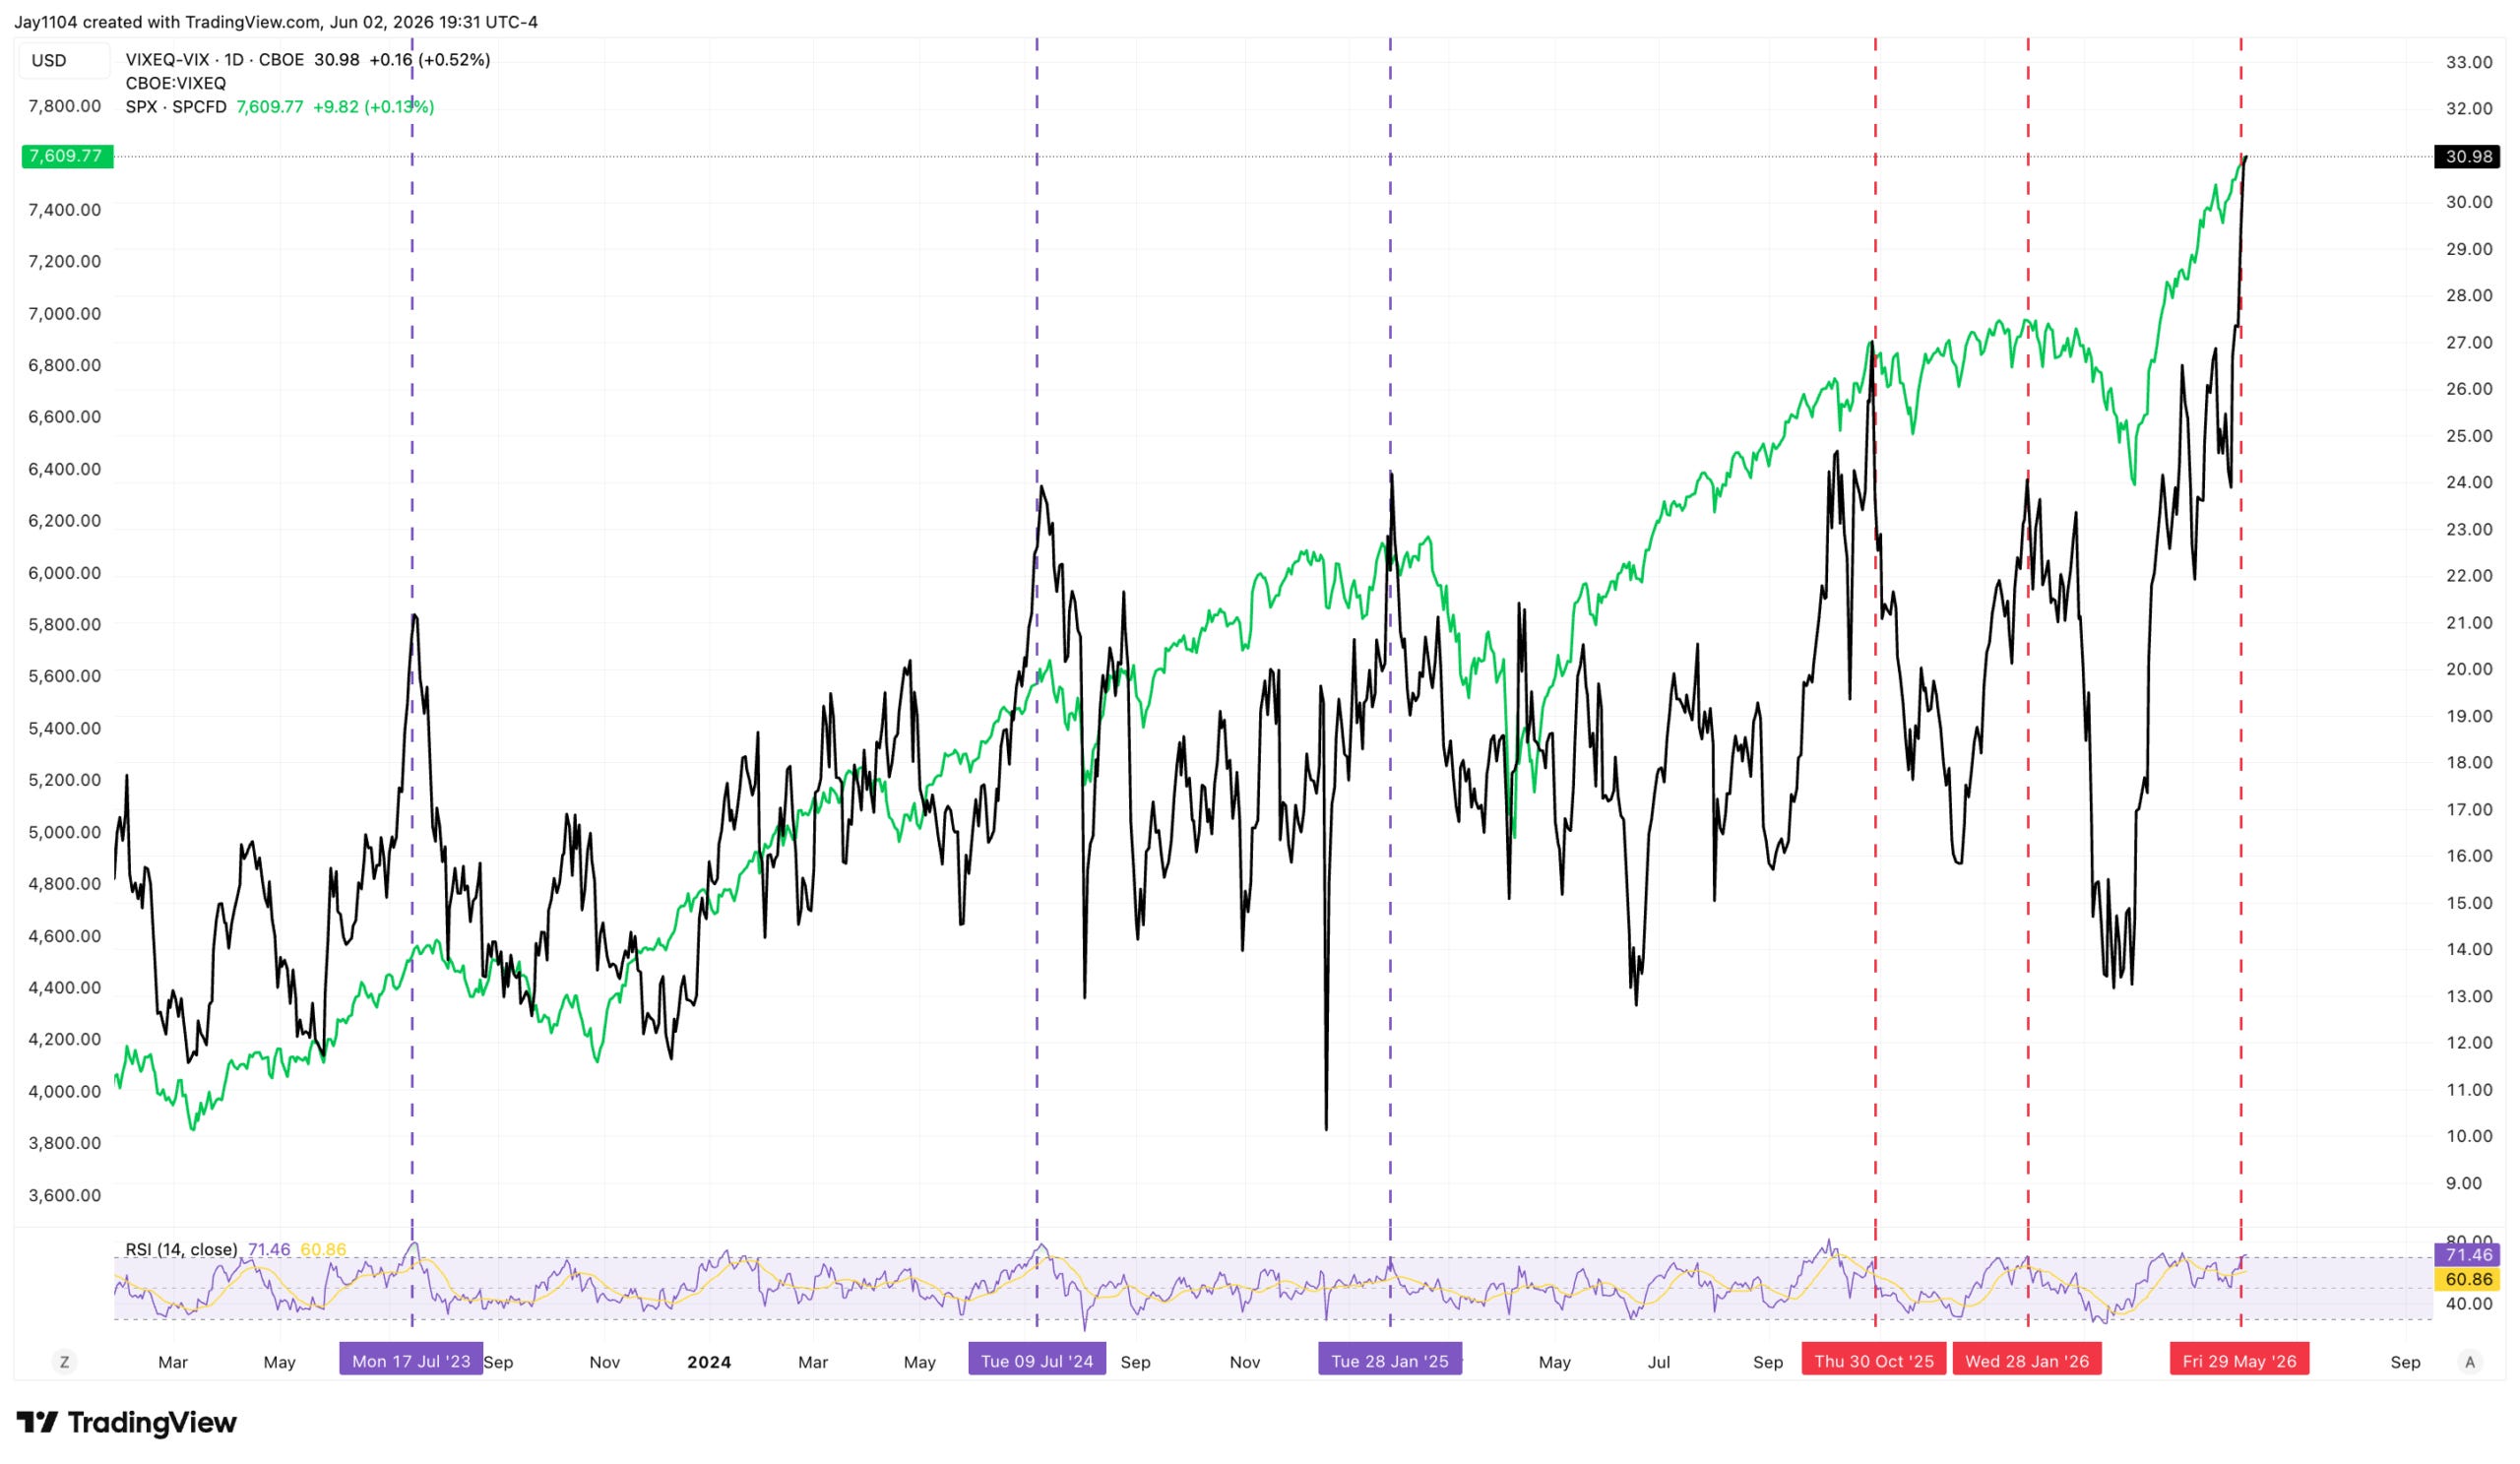
The decline in the dispersion index was driven by a drop in implied volatility across single stocks, as reflected in the VIXEQ. Even so, VIXEQ remains extremely elevated, and the spread between single-stock volatility and index volatility remains exceptionally wide.
In fact, that spread widened further today because the VIX fell more than the VIXEQ. Historically, these extreme divergences between single-stock and index volatility do not tend to persist for long and often retrace fairly quickly.
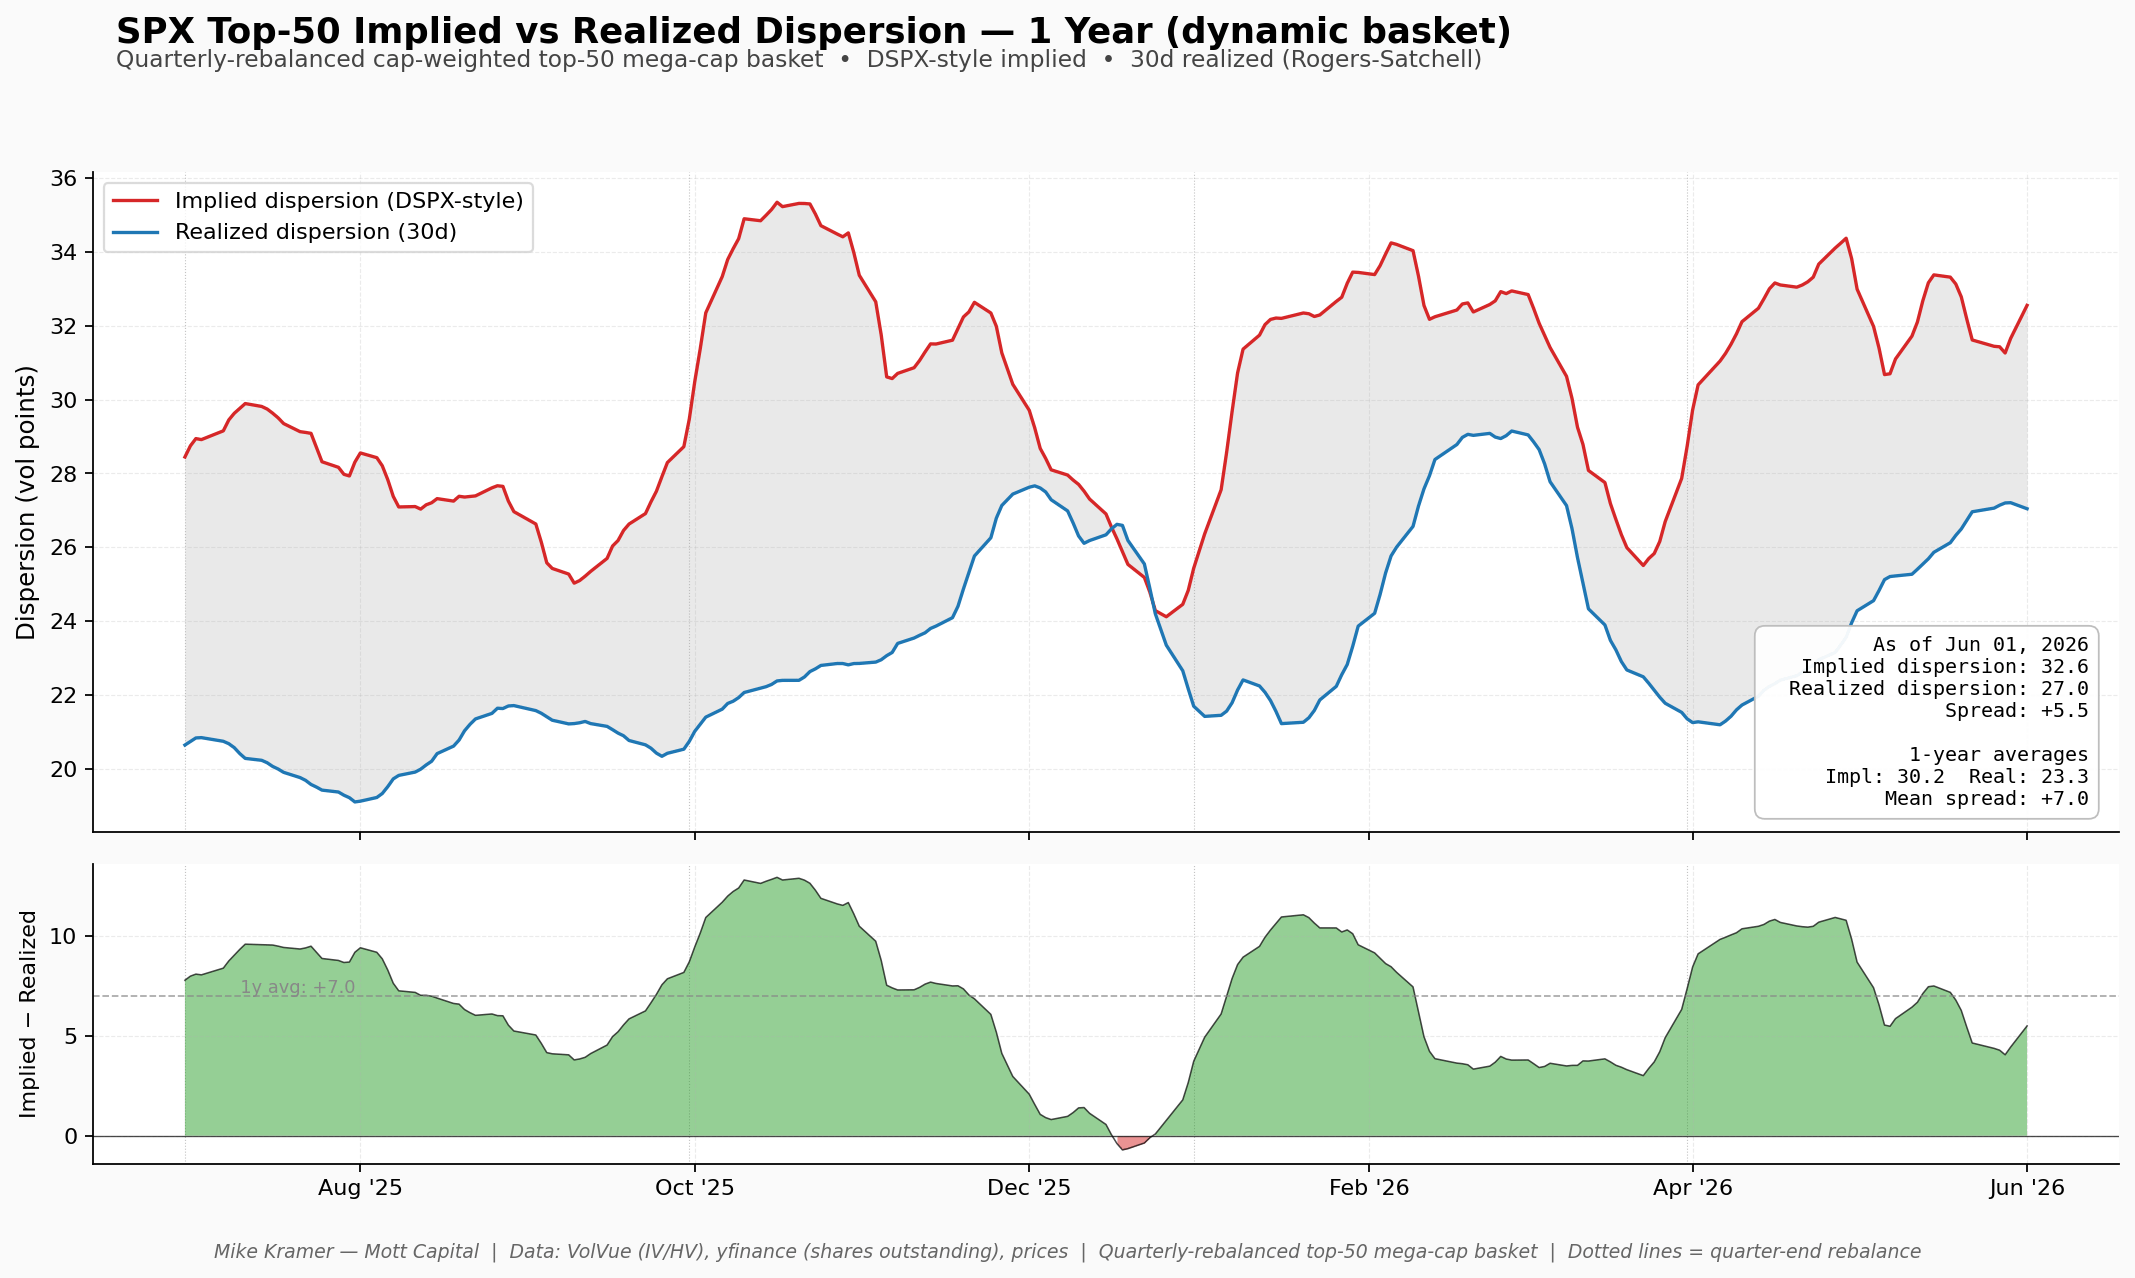
Maybe I have too much time on my hands, or maybe I just feel there is a point that needs to be proven. Whatever the case, I worked with Claude Code today to create my own dynamic implied correlation and implied dispersion indexes that can be measured against realized values for the top 50 stocks in the S&P 500. Both the correlation and dispersion proxy measures appear to track the official indexes fairly closely in terms of trend.
The CBOE dispersion index is actually curving higher than my measure at this point, but for the most part, the results look pretty solid.
 vs CBOE DSPX over the past year. As of Jun 1, 2026, ours is 32.6 vs CBOE's 41.4, a gap of -8.8 vol pts. The 1-year average difference is -3.3, with series correlation of 0.92. Both series track closely but CBOE DSPX consistently runs higher, with the gap widening sharply in mid-2026")
Meanwhile, the 1-month implied correlation proxy also appears to track fairly well, although the actual reading is currently trending somewhat lower.
The point is that the one-year average dispersion spread is around 7 points, whereas today it is only about 5.5 points. As a result, implied dispersion is probably fairly valued, or perhaps even slightly cheap compared to realized.
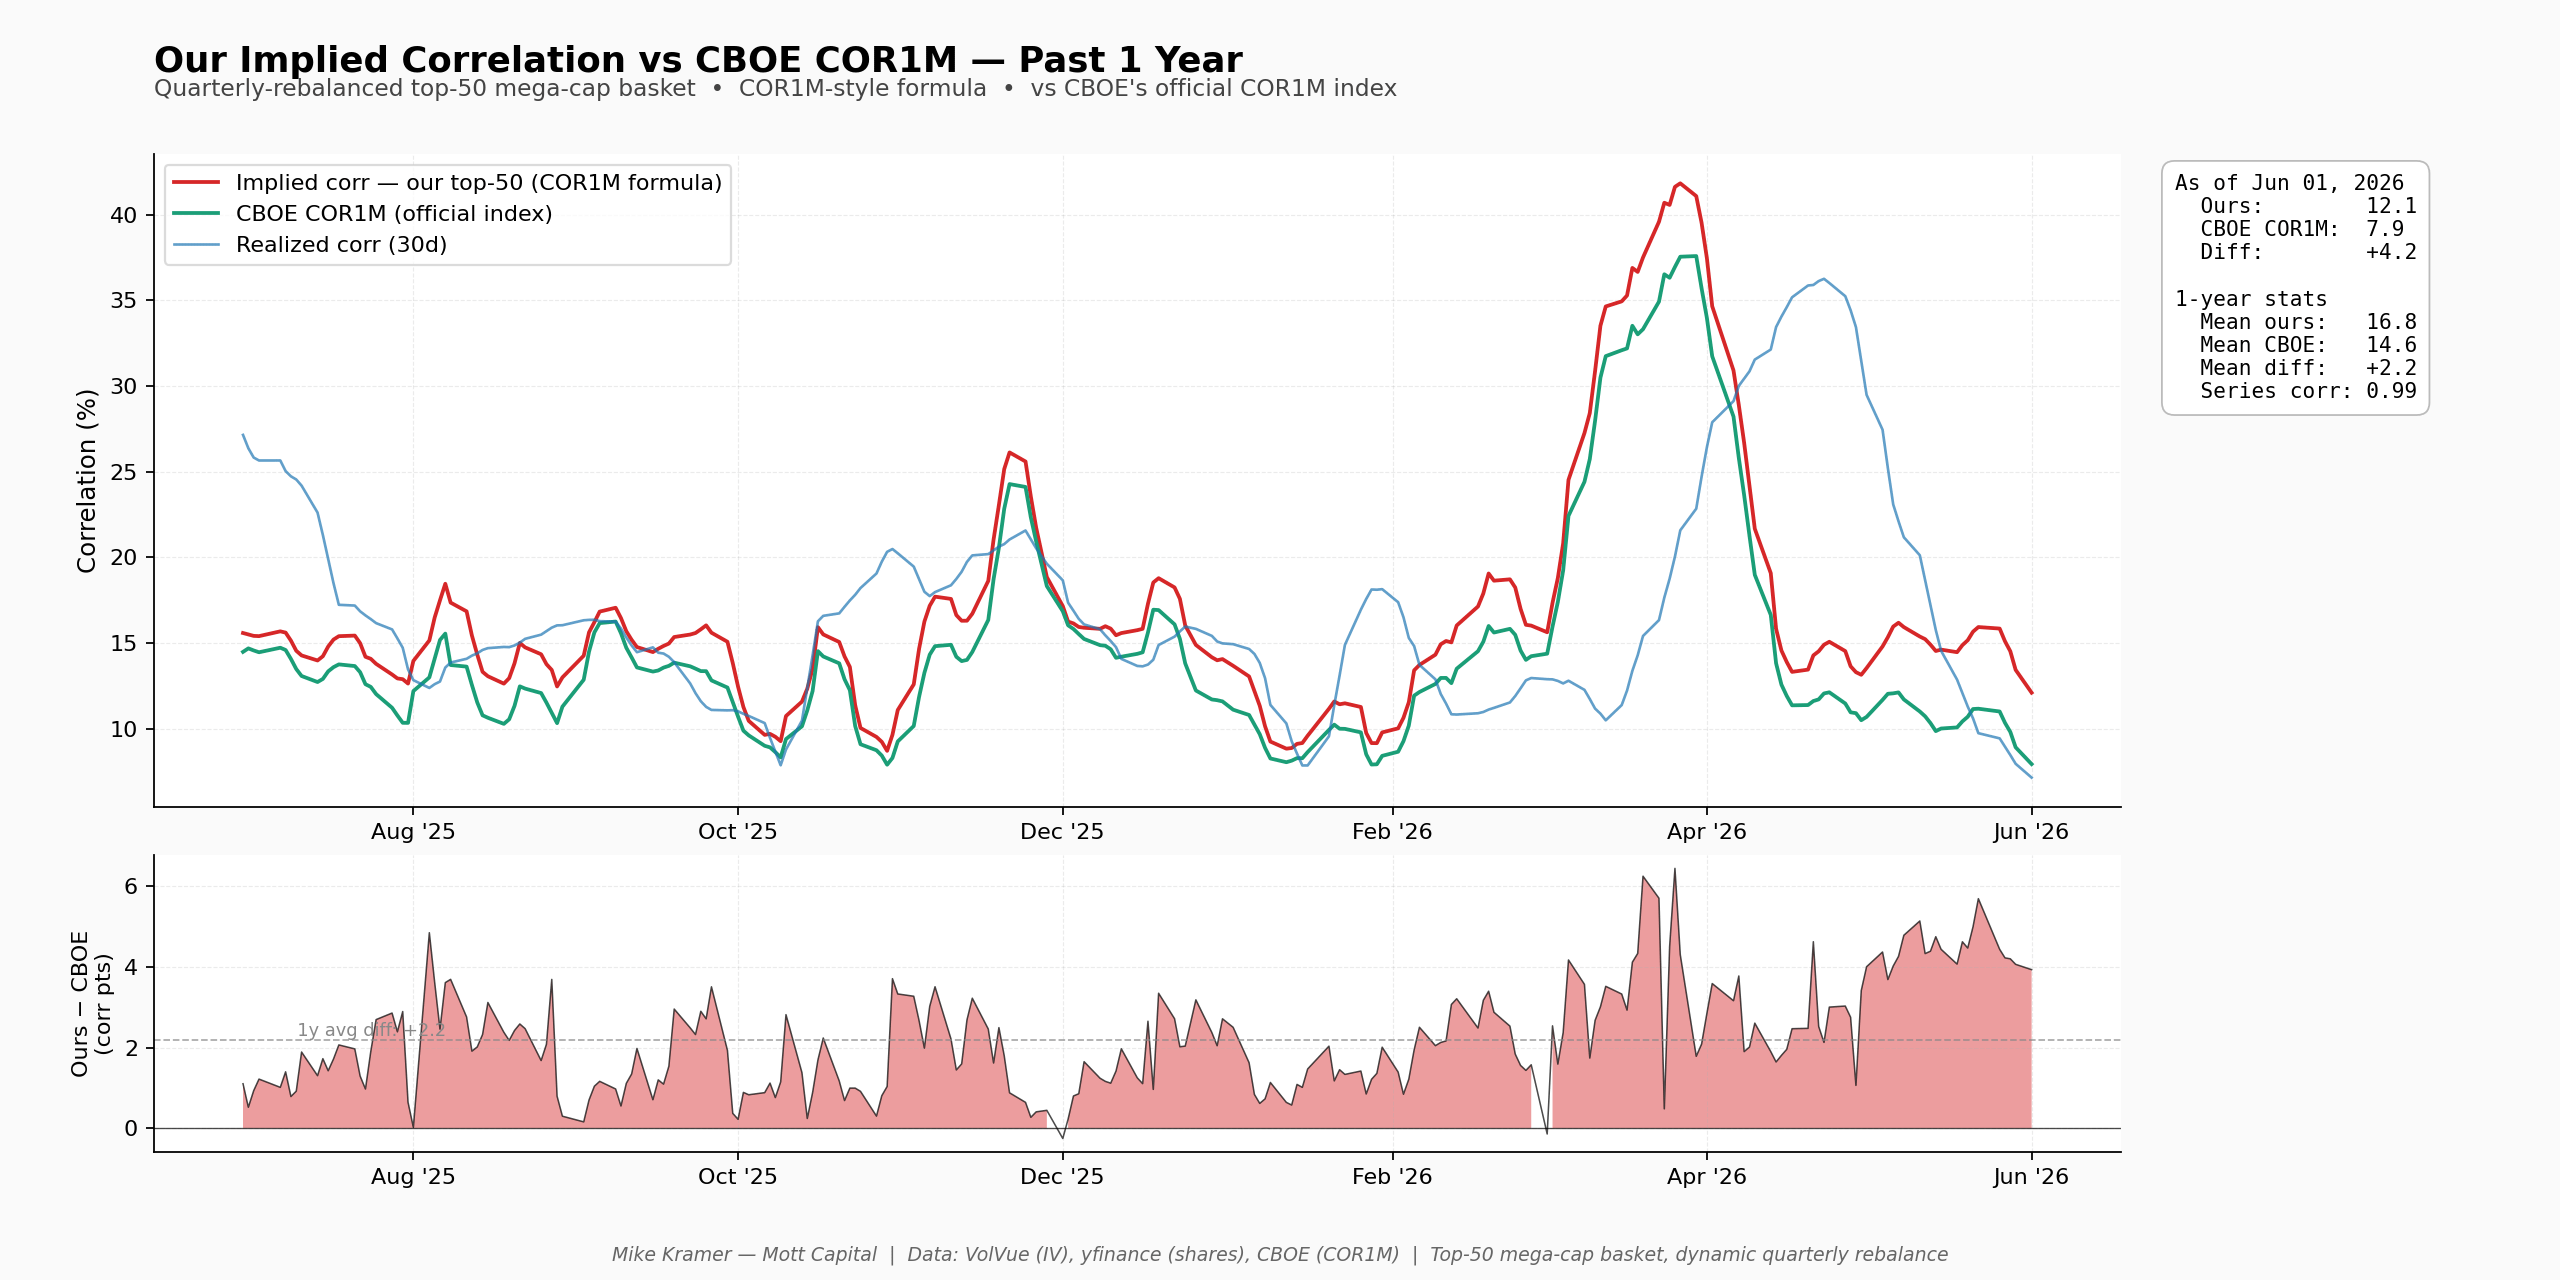
The spread between correlations is wider by +5 points than the average of around 0.3 over the past year. This is very wide when comparing implied versus realised, and implied is more expensive.
 sits above realized (7.1) as of June 1, 2026, with a +5.0 spread after spiking near 42% implied in early April 2026")
So, if I am thinking about this within the correct framework, the options market is pricing the current market environment appropriately with respect to dispersion. However, the concern appears to be around correlation snapping back higher, meaning stocks suddenly begin trading together again.
Generally, when stocks sell off sharply, correlations tend to rise as investors react to the same macro forces. In fact, a macro shock would likely drive index-level volatility higher, narrowing the gap between index and single-stock volatility and causing dispersion to decline.
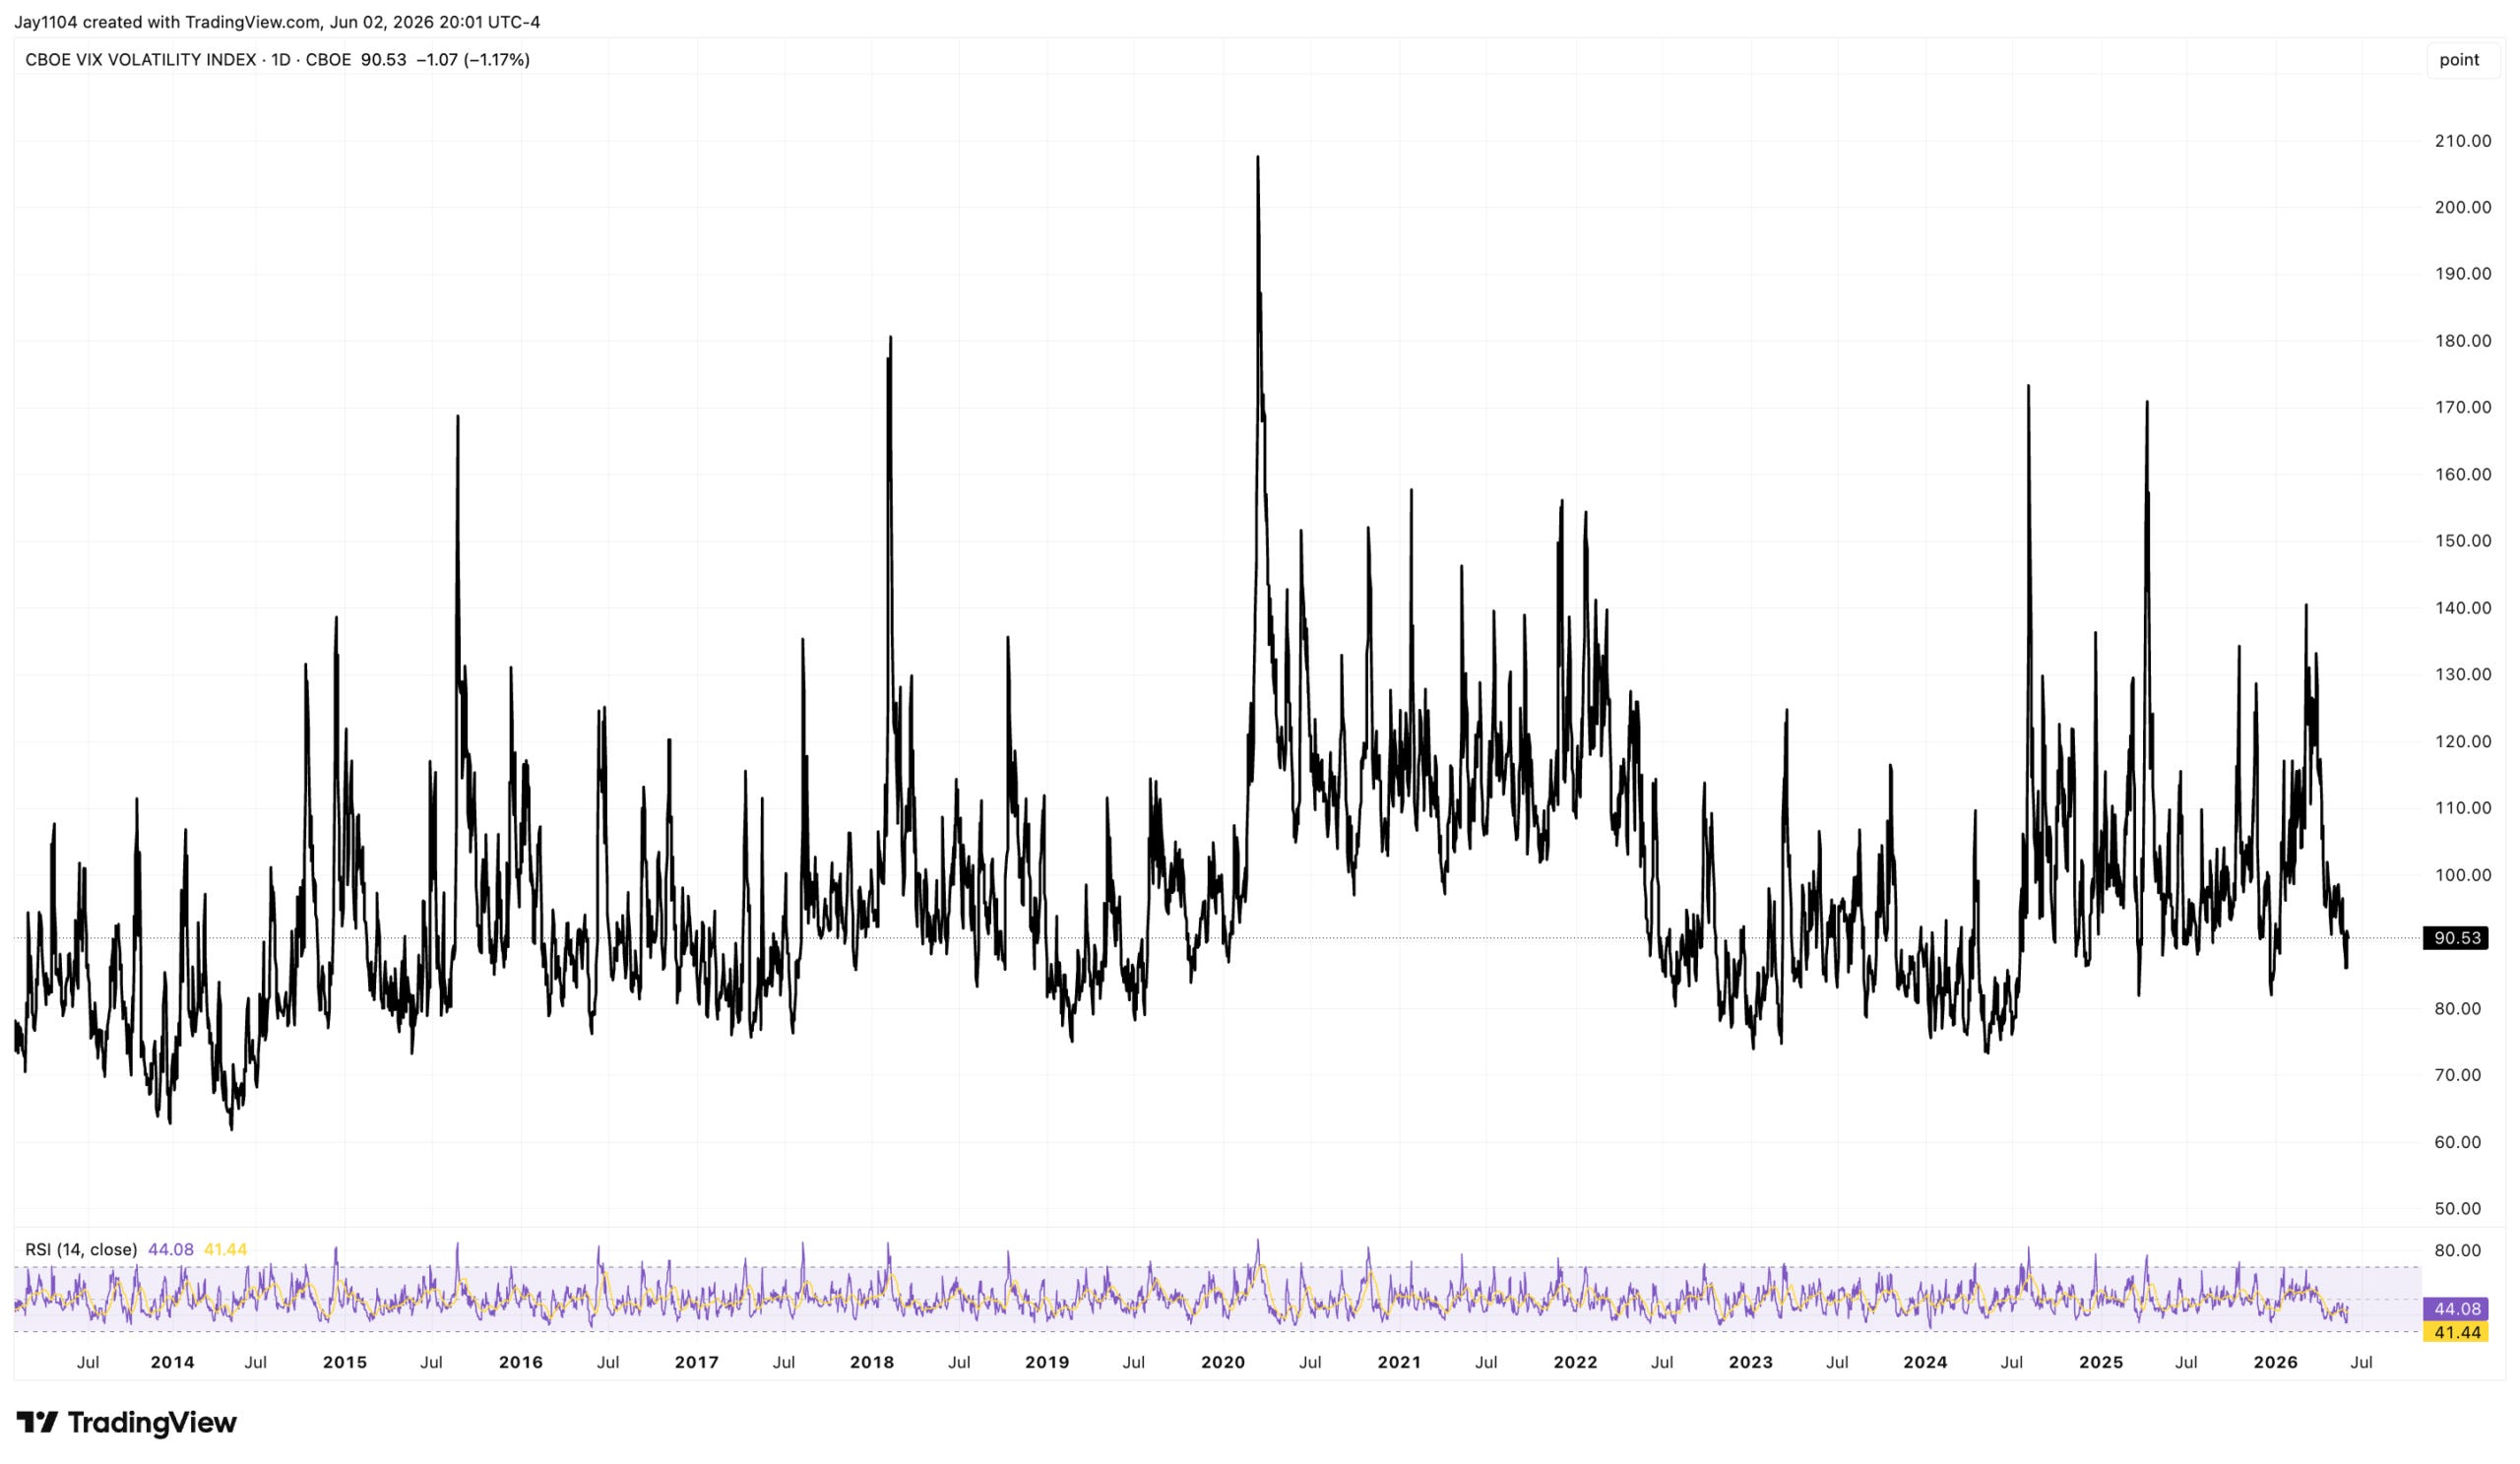
In essence, this suggests that index volatility remains relatively cheap. The VVIX at 90.5 is essentially sending the same message.
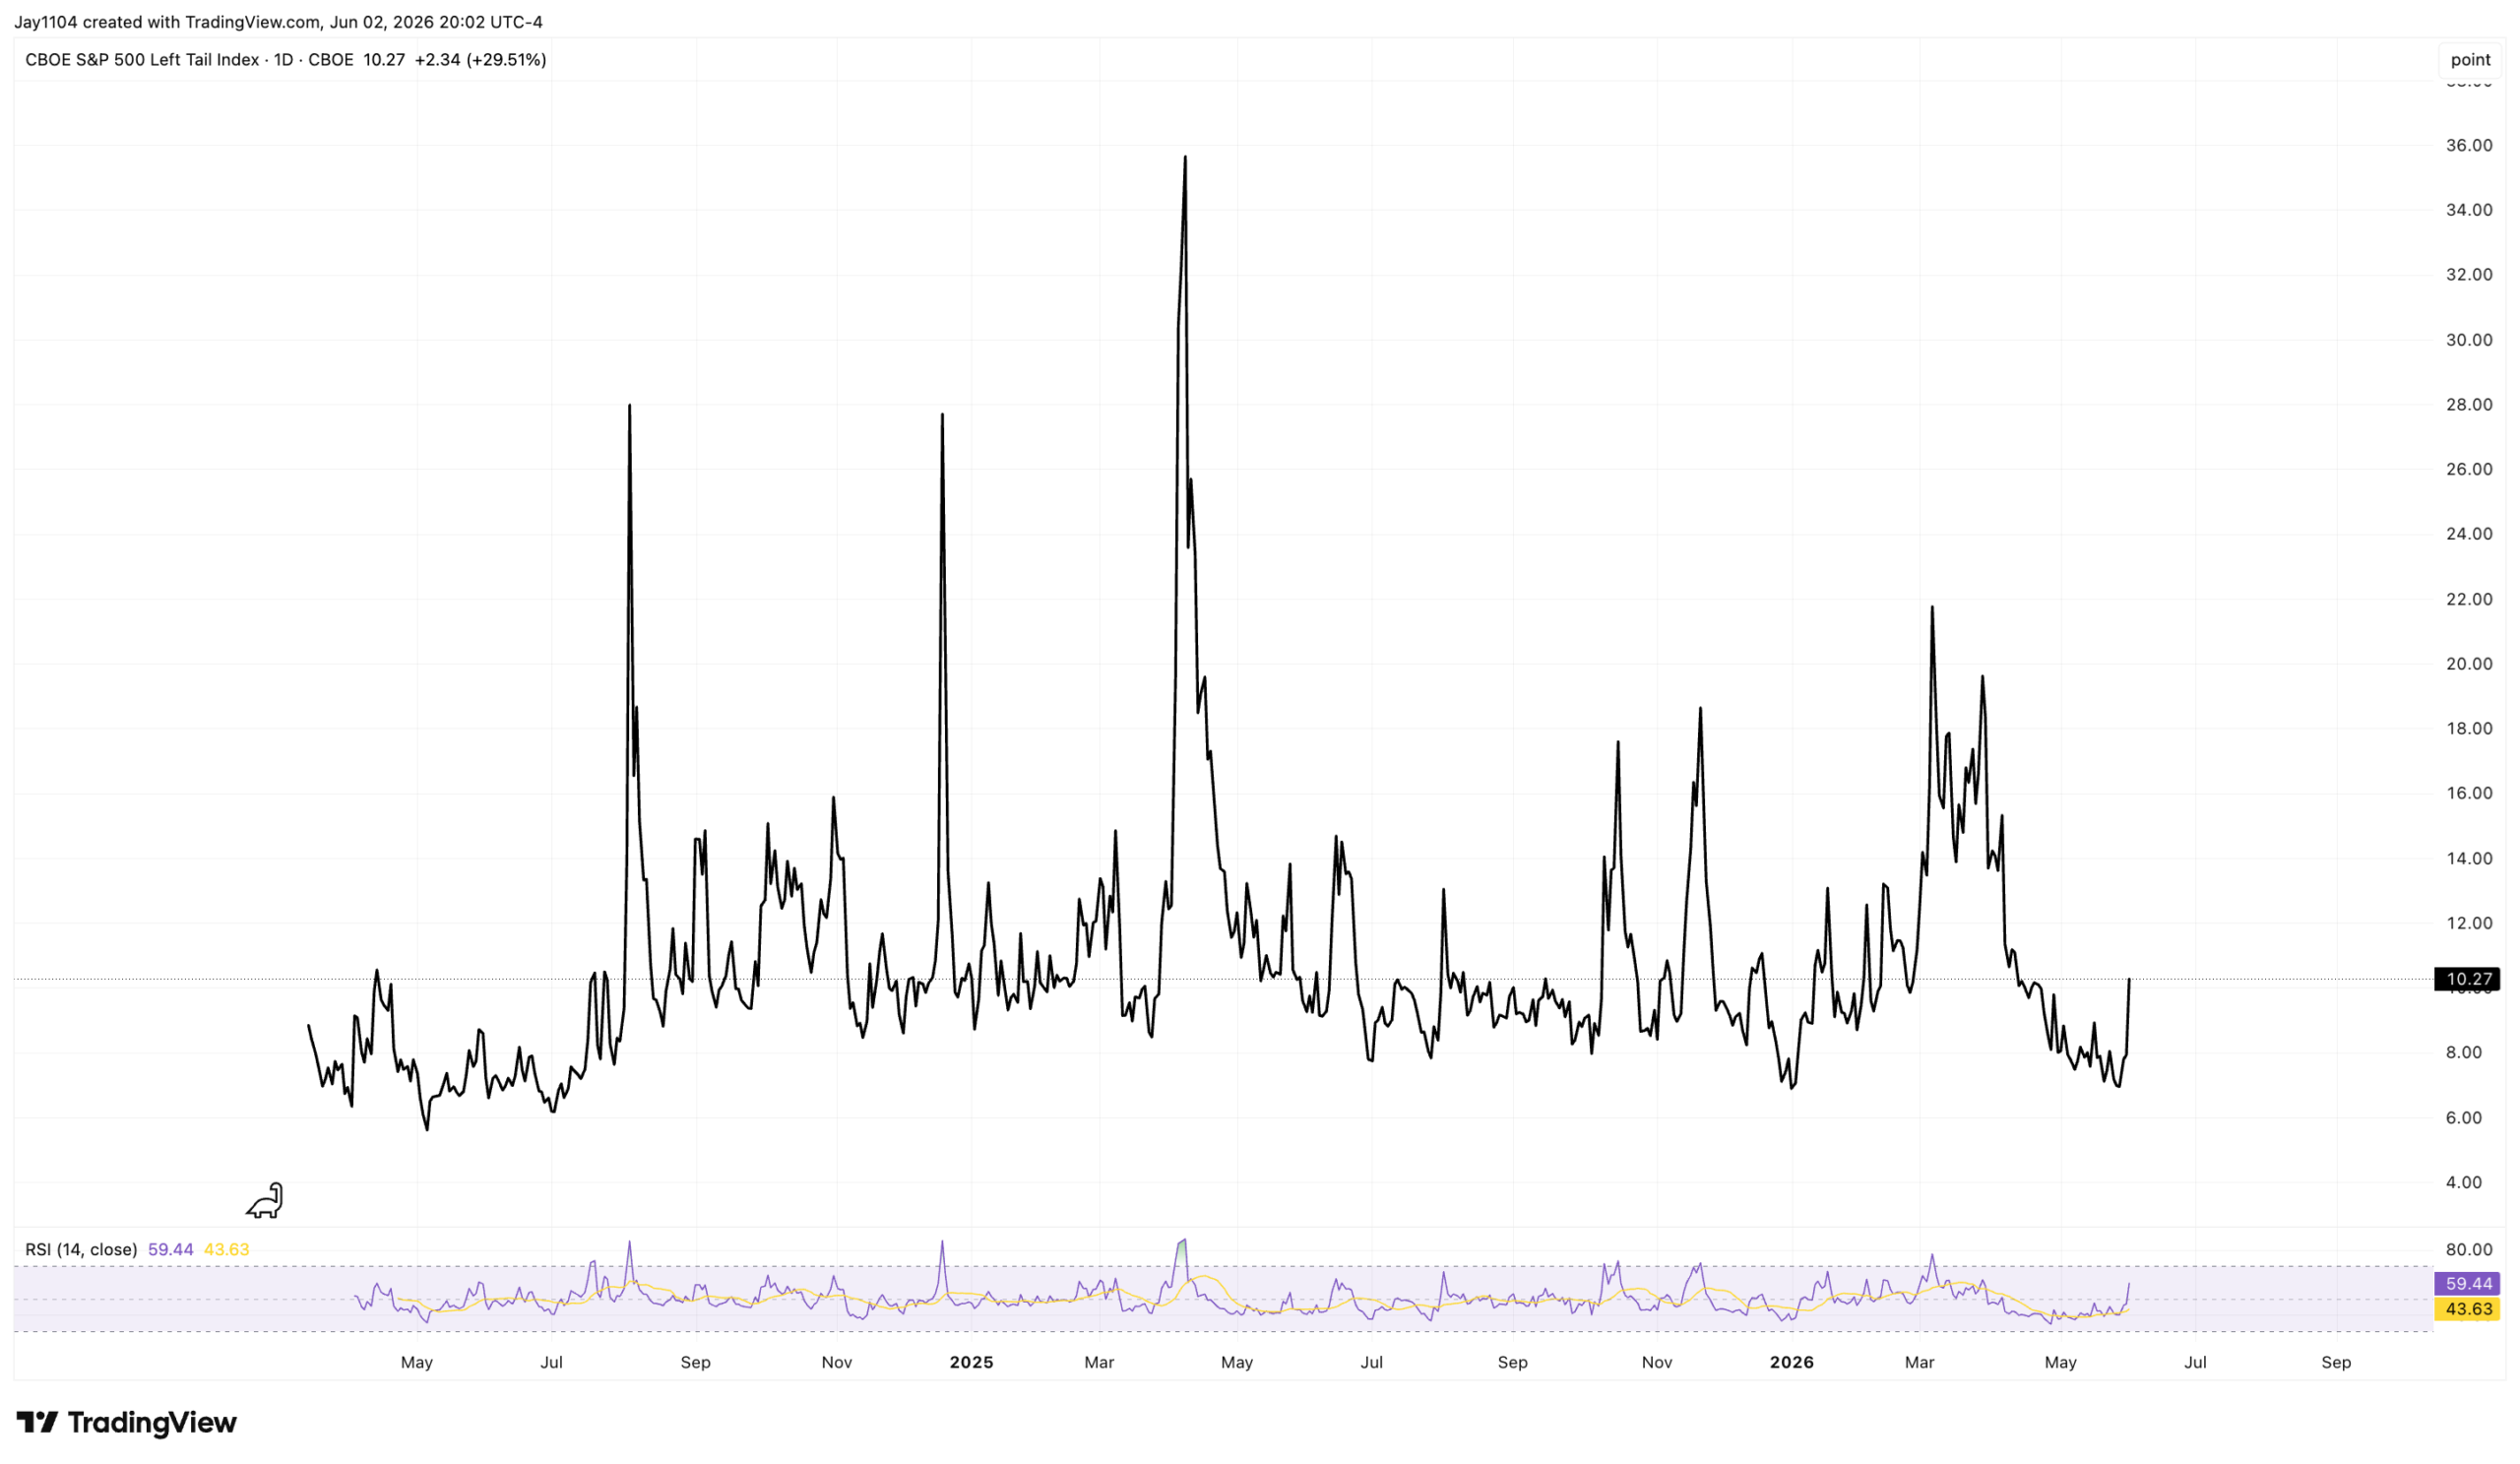
Someone is paying attention because today the Left Tail Index jumped 29% to 10.3.
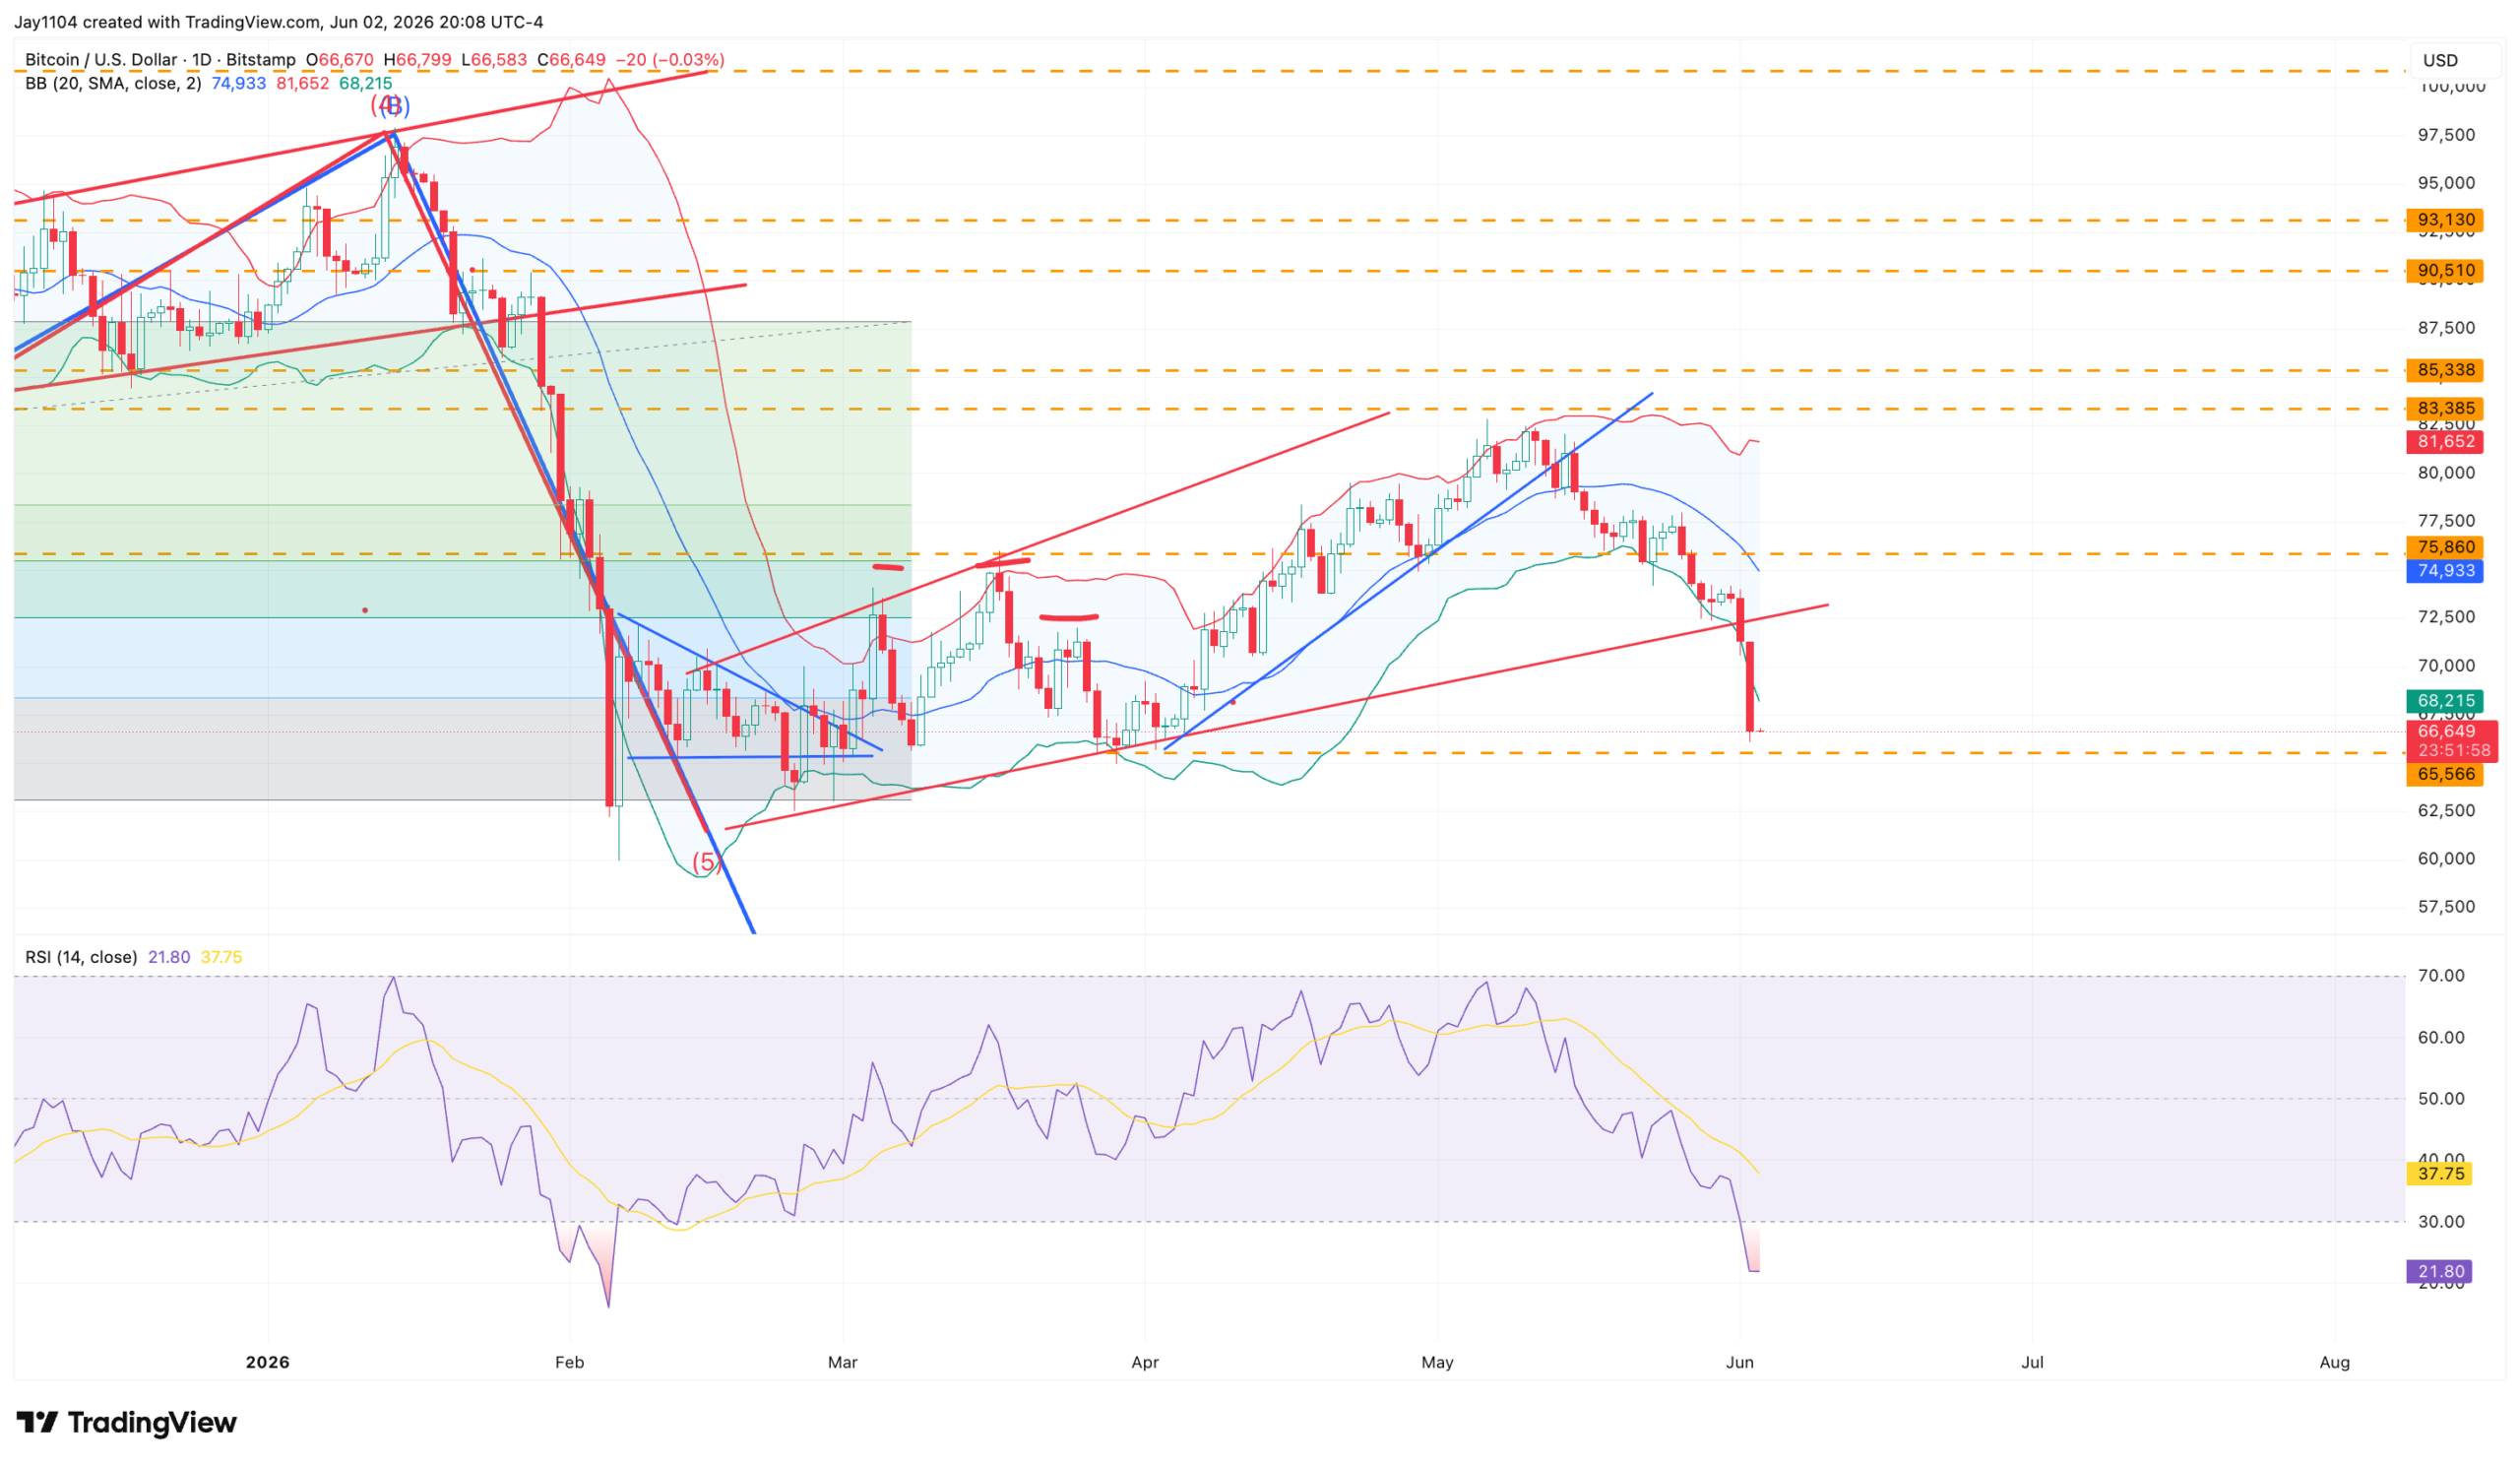
Today was a settlement day, and to no one’s surprise, Bitcoin fell 6.5%. It likely has further downside for now, with more liquidity set to leave the market on Thursday. A break below support at $65,000 would likely push it beneath the February lows near $62,000.
-Mike
Glossary by ChatGPT
CBOE Dispersion Index — An options-based measure of the expected difference in performance among stocks within an index.
Correlation — A statistical measure showing how closely different securities move in relation to one another.
Dispersion — The degree to which individual stock returns differ from the overall index return.
Implied Correlation — The level of correlation between stocks inferred from options prices rather than historical data.
Implied Volatility — The market’s forecast of future price fluctuations derived from options pricing.
Left Tail Index — A measure designed to track the market’s pricing of extreme downside risk scenarios.
Realized Correlation — The actual observed correlation between securities over a historical period.
Realized Volatility — The actual historical volatility experienced by an asset over a specific timeframe.
Settlement Day — The date when options, futures, or other derivative contracts are finalized and obligations are fulfilled.
VIX — The CBOE Volatility Index, which measures expected 30-day volatility for the S&P 500 based on options prices.
VIXEQ — An index measuring implied volatility for individual S&P 500 constituent stocks.
VVIX — The volatility of the VIX itself, often viewed as a measure of volatility-of-volatility risk.
XLK ETF — The Technology Select Sector SPDR Fund, an exchange-traded fund that tracks technology stocks within the S&P 500.
Disclosure
This report contains independent commentary to be used for informational and educational purposes only. Michael Kramer is a member and investment adviser representative with Mott Capital Management. Mr. Kramer is not affiliated with this company and does not serve on the board of any related company that issued this stock. All opinions and analyses presented by Michael Kramer in this analysis or market report are solely Michael Kramer’s views. Readers should not treat any opinion, viewpoint, or prediction expressed by Michael Kramer as a specific solicitation or recommendation to buy or sell a particular security or follow a particular strategy. Michael Kramer’s analyses are based upon information and independent research that he considers reliable, but neither Michael Kramer nor Mott Capital Management guarantees its completeness or accuracy, and it should not be relied upon as such. Michael Kramer is not under any obligation to update or correct any information presented in his analyses. Mr. Kramer’s statements, guidance, and opinions are subject to change without notice. Past performance is not indicative of future results. Neither Michael Kramer nor Mott Capital Management guarantees any specific outcome or profit. You should be aware of the real risk of loss in following any strategy or investment commentary presented in this analysis. Strategies or investments discussed may fluctuate in price or value. Investments or strategies mentioned in this analysis may not be suitable for you. This material does not consider your particular investment objectives, financial situation, or needs and is not intended as a recommendation appropriate for you. You must make an independent decision regarding investments or strategies in this analysis. Upon request, the advisor will provide a list of all recommendations made during the past twelve months. Before acting on information in this analysis, you should consider whether it is suitable for your circumstances and strongly consider seeking advice from your own financial or investment adviser to determine the suitability of any investment.