
Oil Volatility and Broadcom Selloff Pressure Markets

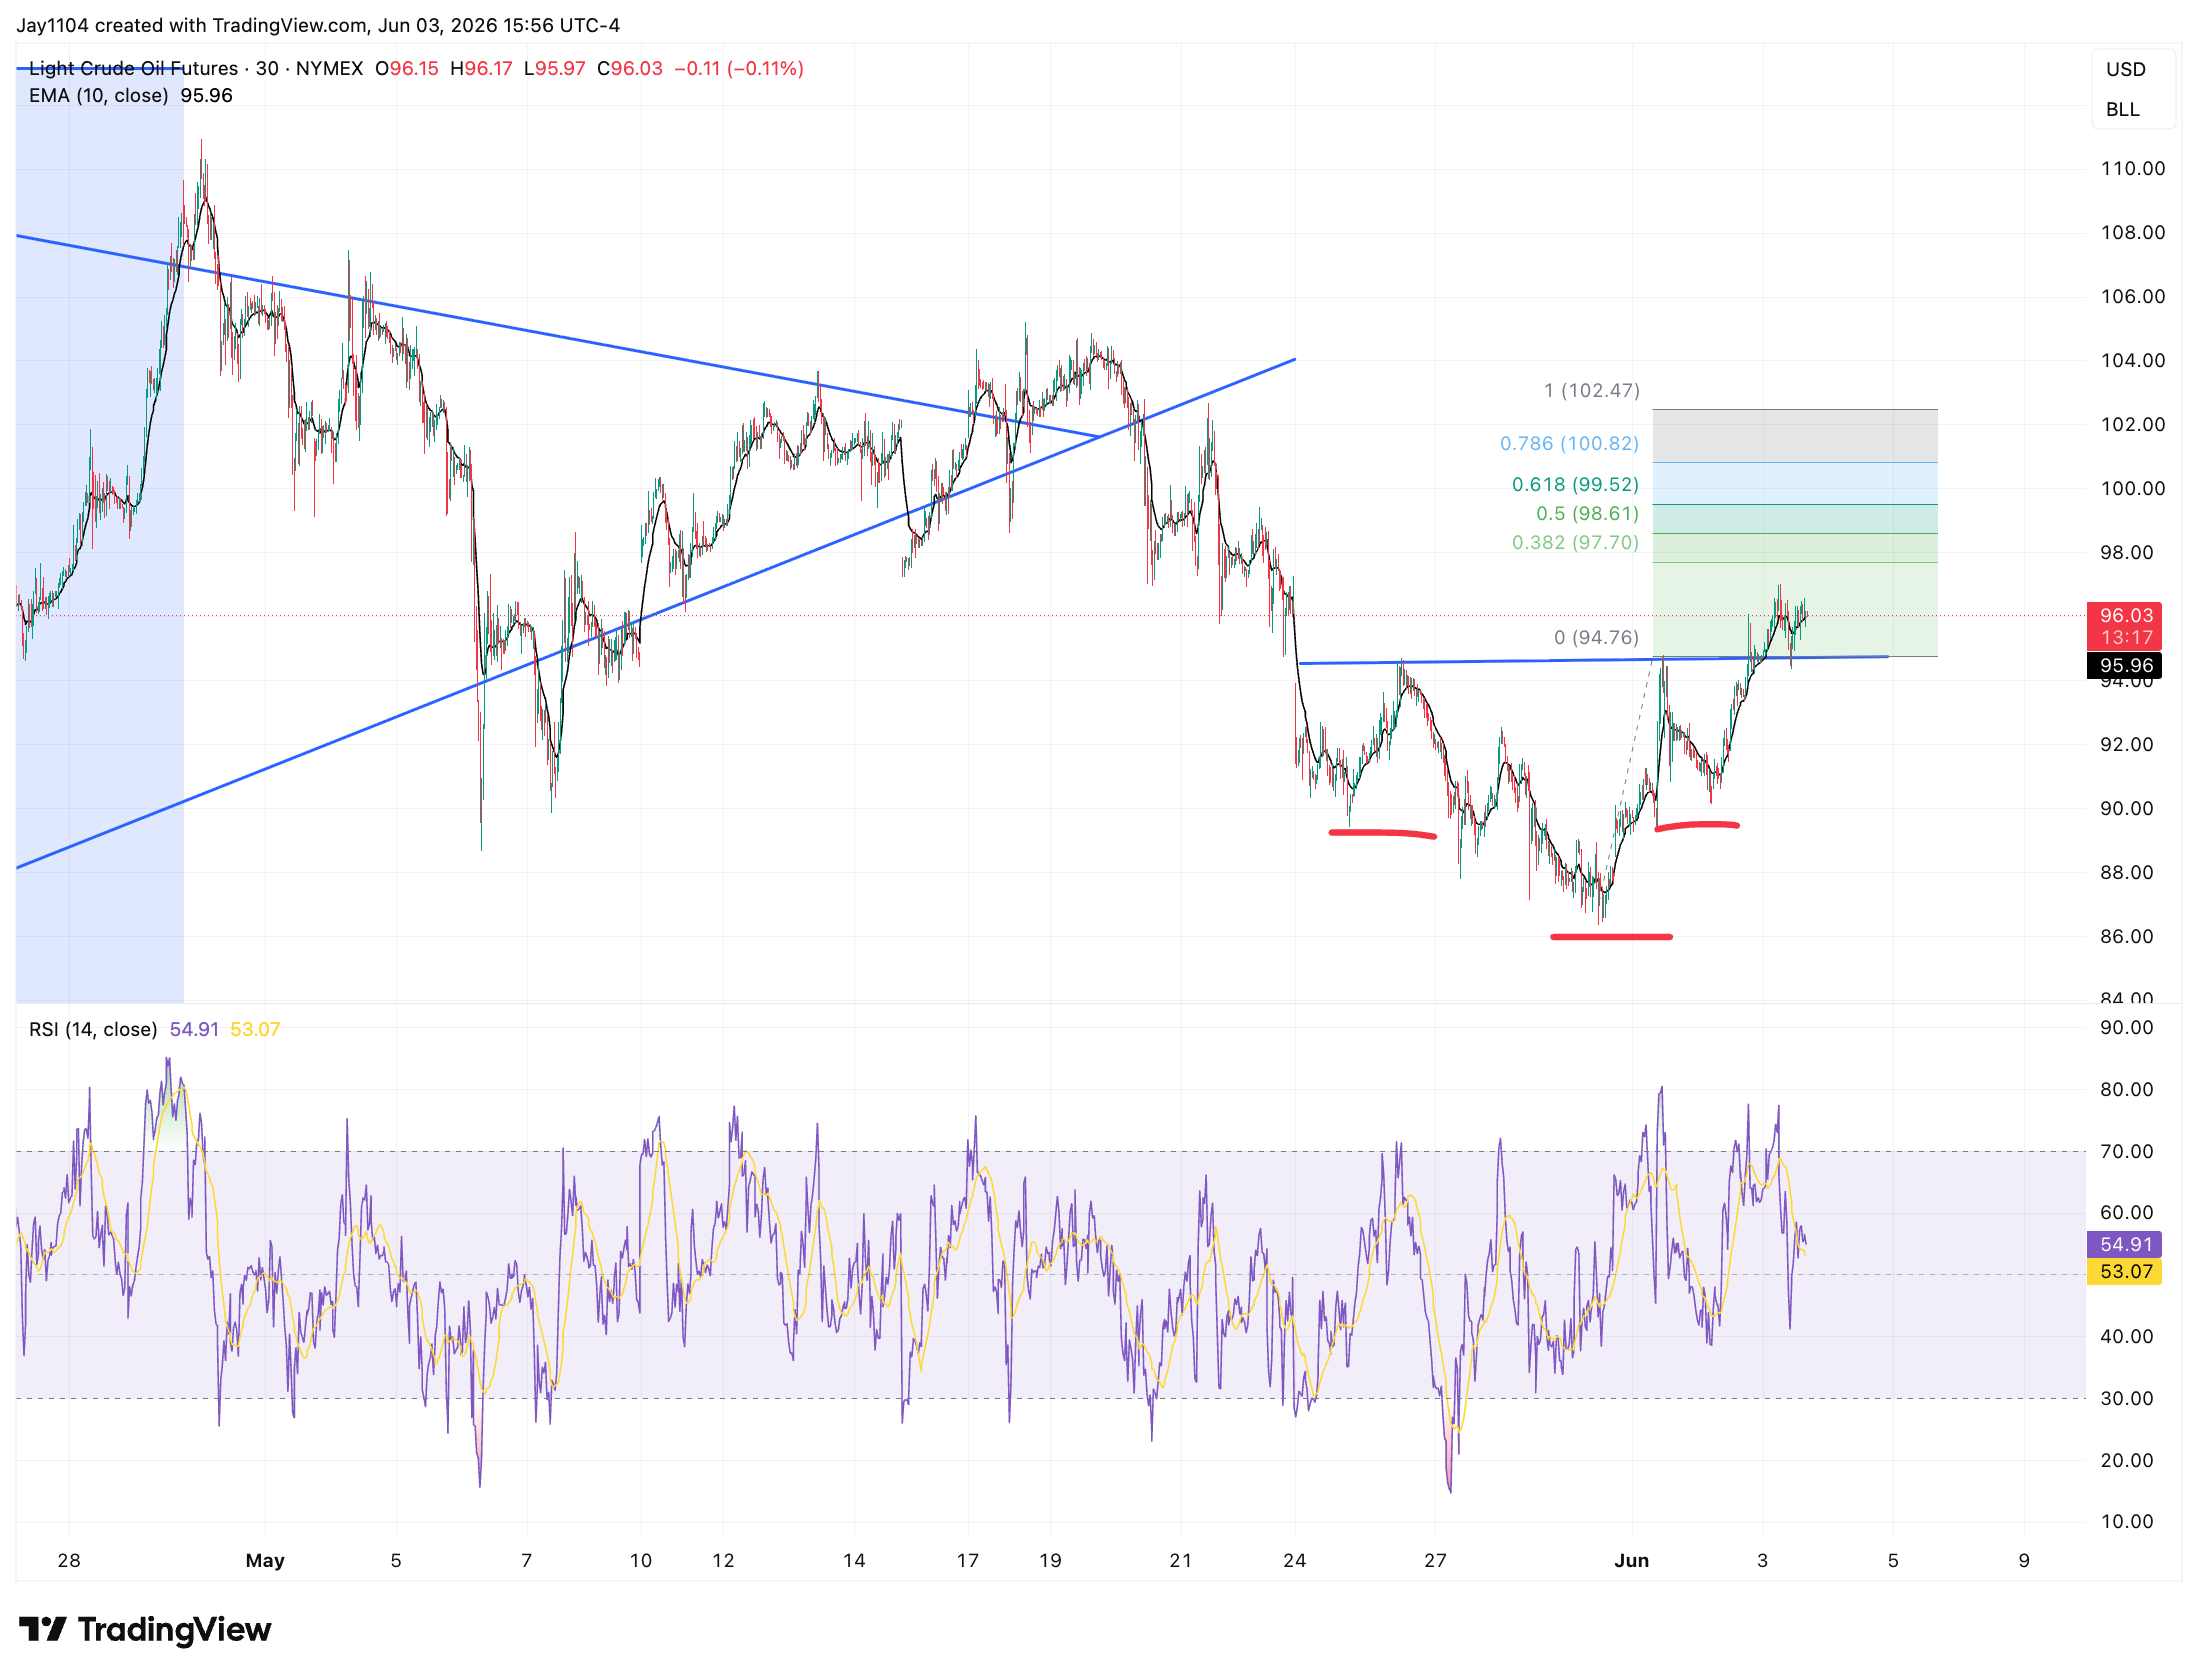
The S&P 500 finished the day lower by roughly 60 basis points, while oil prices rose by more than 2%. WTI appears to be forming an inverse head-and-shoulders pattern and, more importantly, has already broken above its neckline. If the pattern completes, it would suggest that oil prices could rise to around $102.
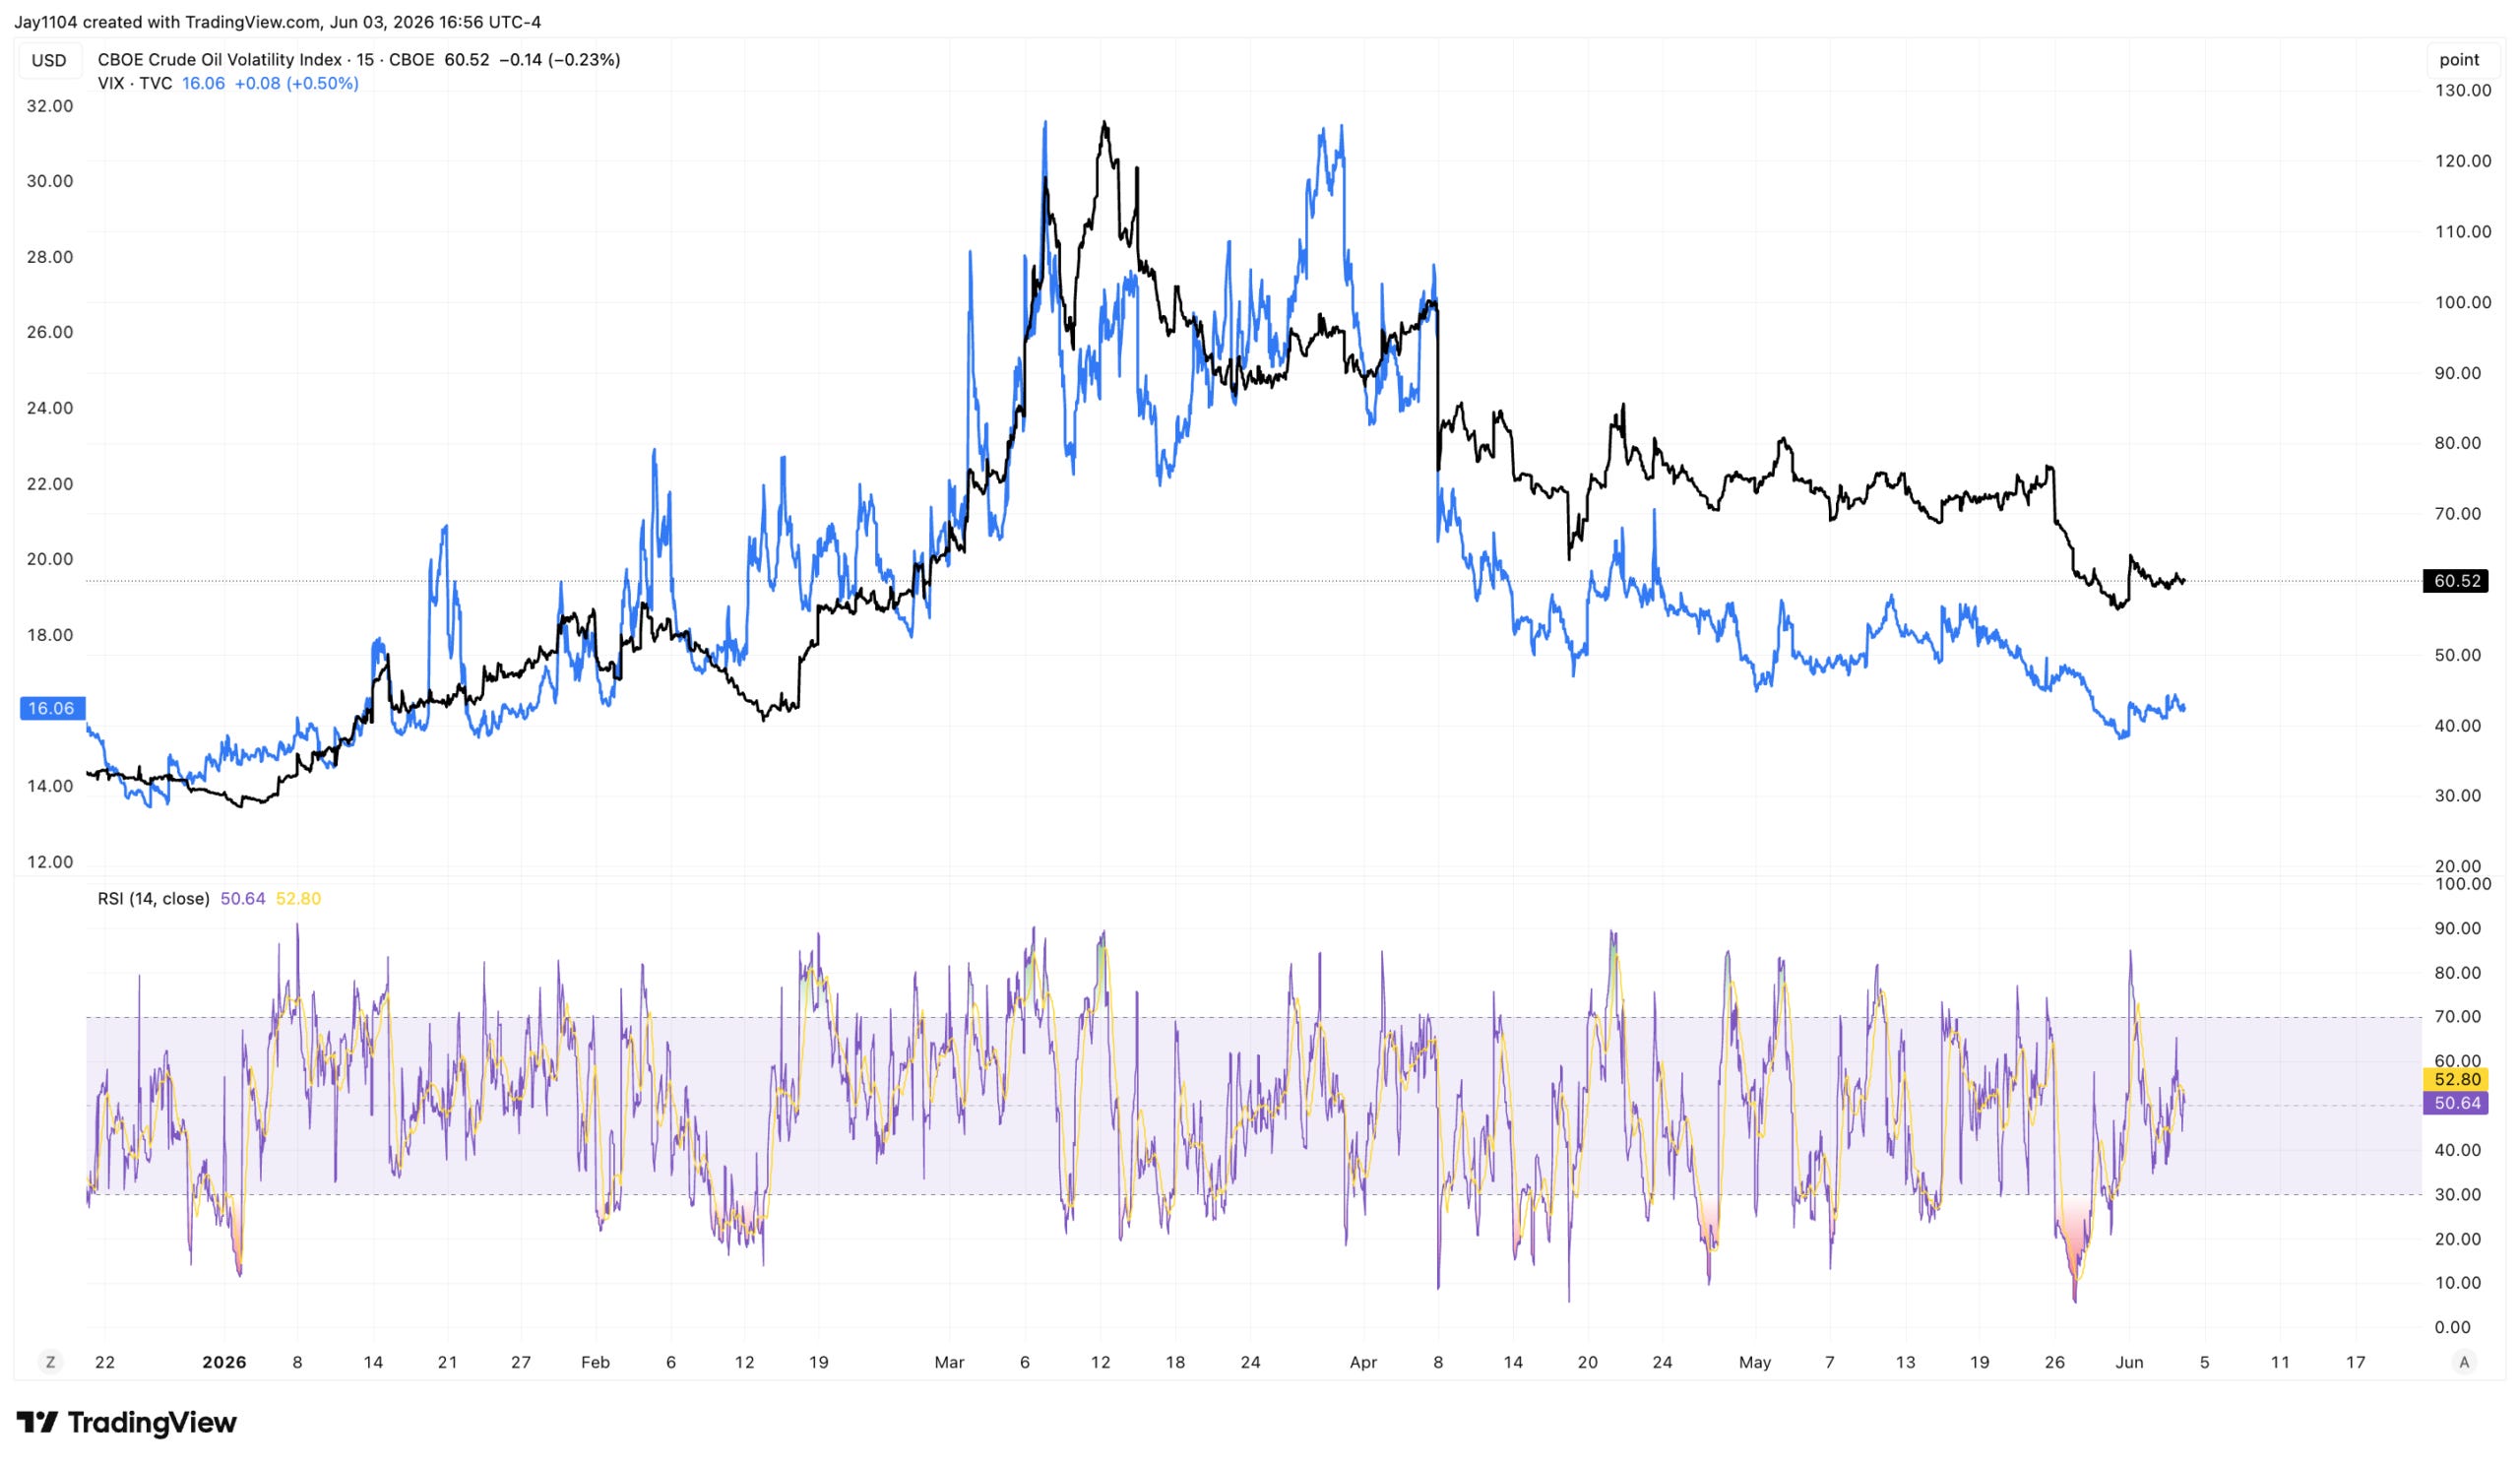
Meanwhile, volatility did not change much overall, even though the VIX rose slightly and the VIXEQ declined somewhat. However, we did see implied volatility in oil increase modestly today, though it remains stubbornly elevated.
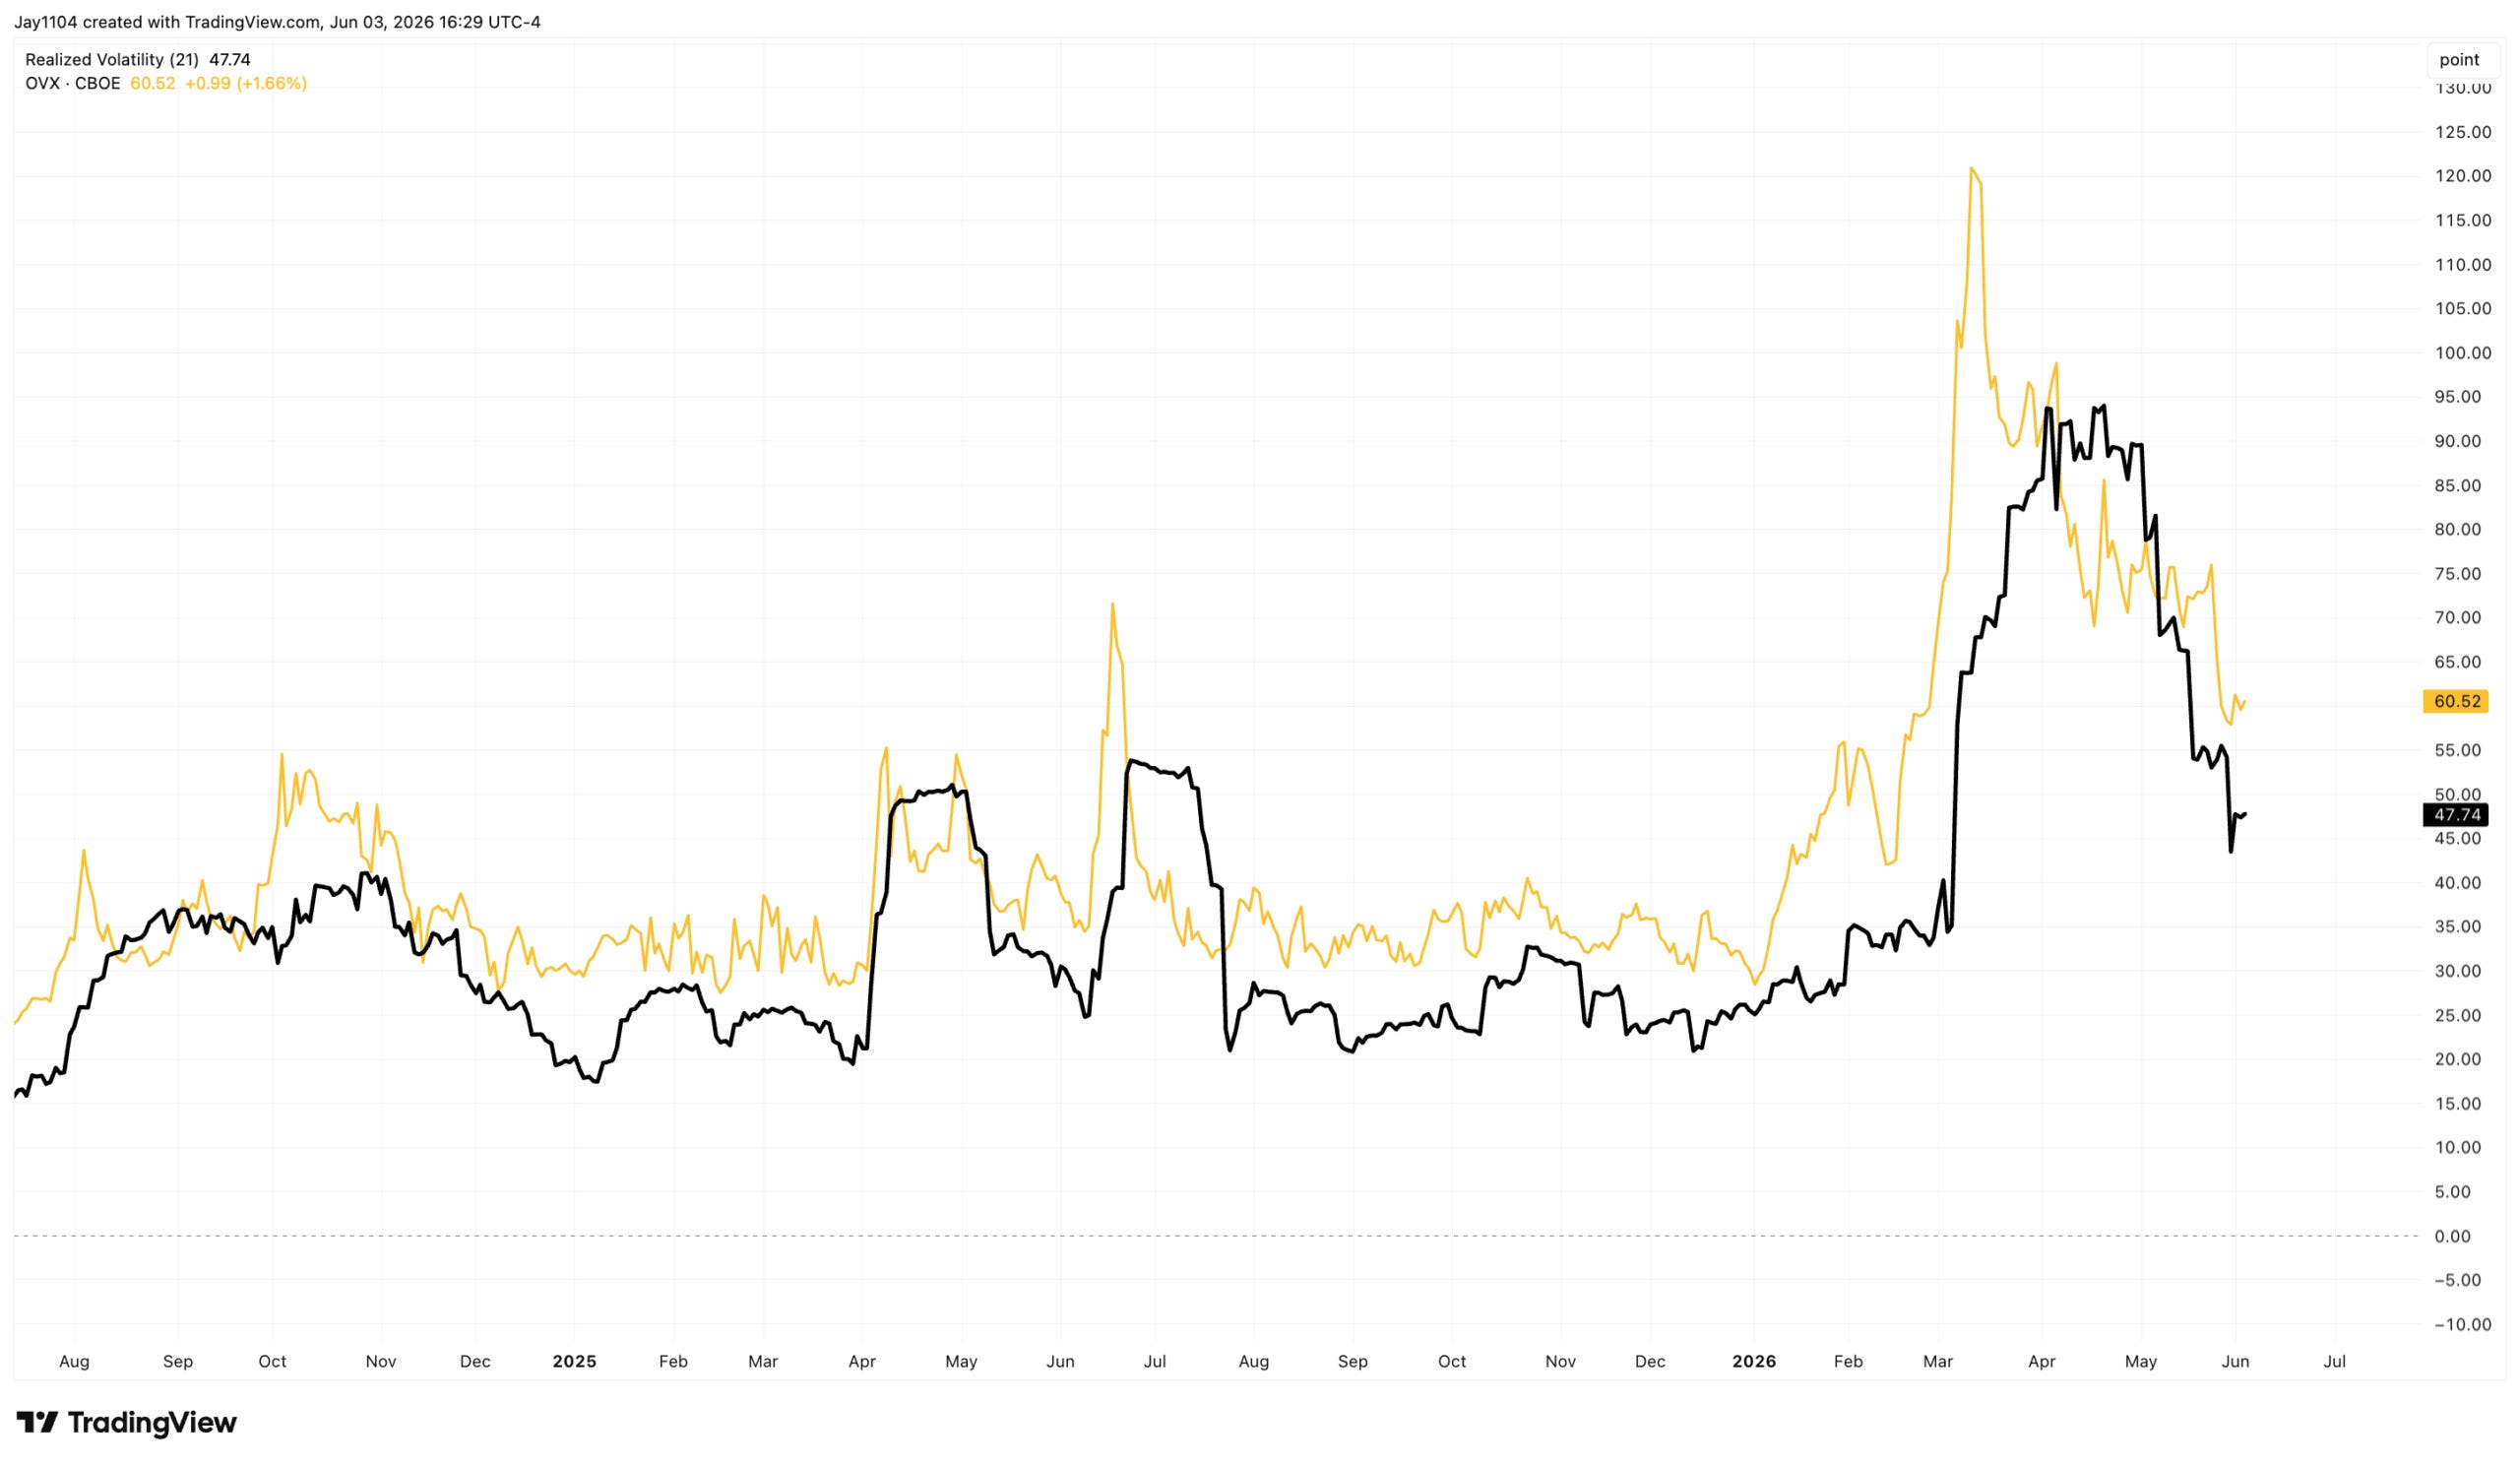
Currently, 21-day realized volatility in oil is around 47.7%, which means oil has been moving by roughly 3% per day over the past month. Meanwhile, the OVX is trading around 60.5, implying daily moves of approximately 3.8% over the next month.
In other words, the options market is pricing in larger moves ahead than those seen over the past month, suggesting traders expect oil volatility to remain elevated for the foreseeable future.
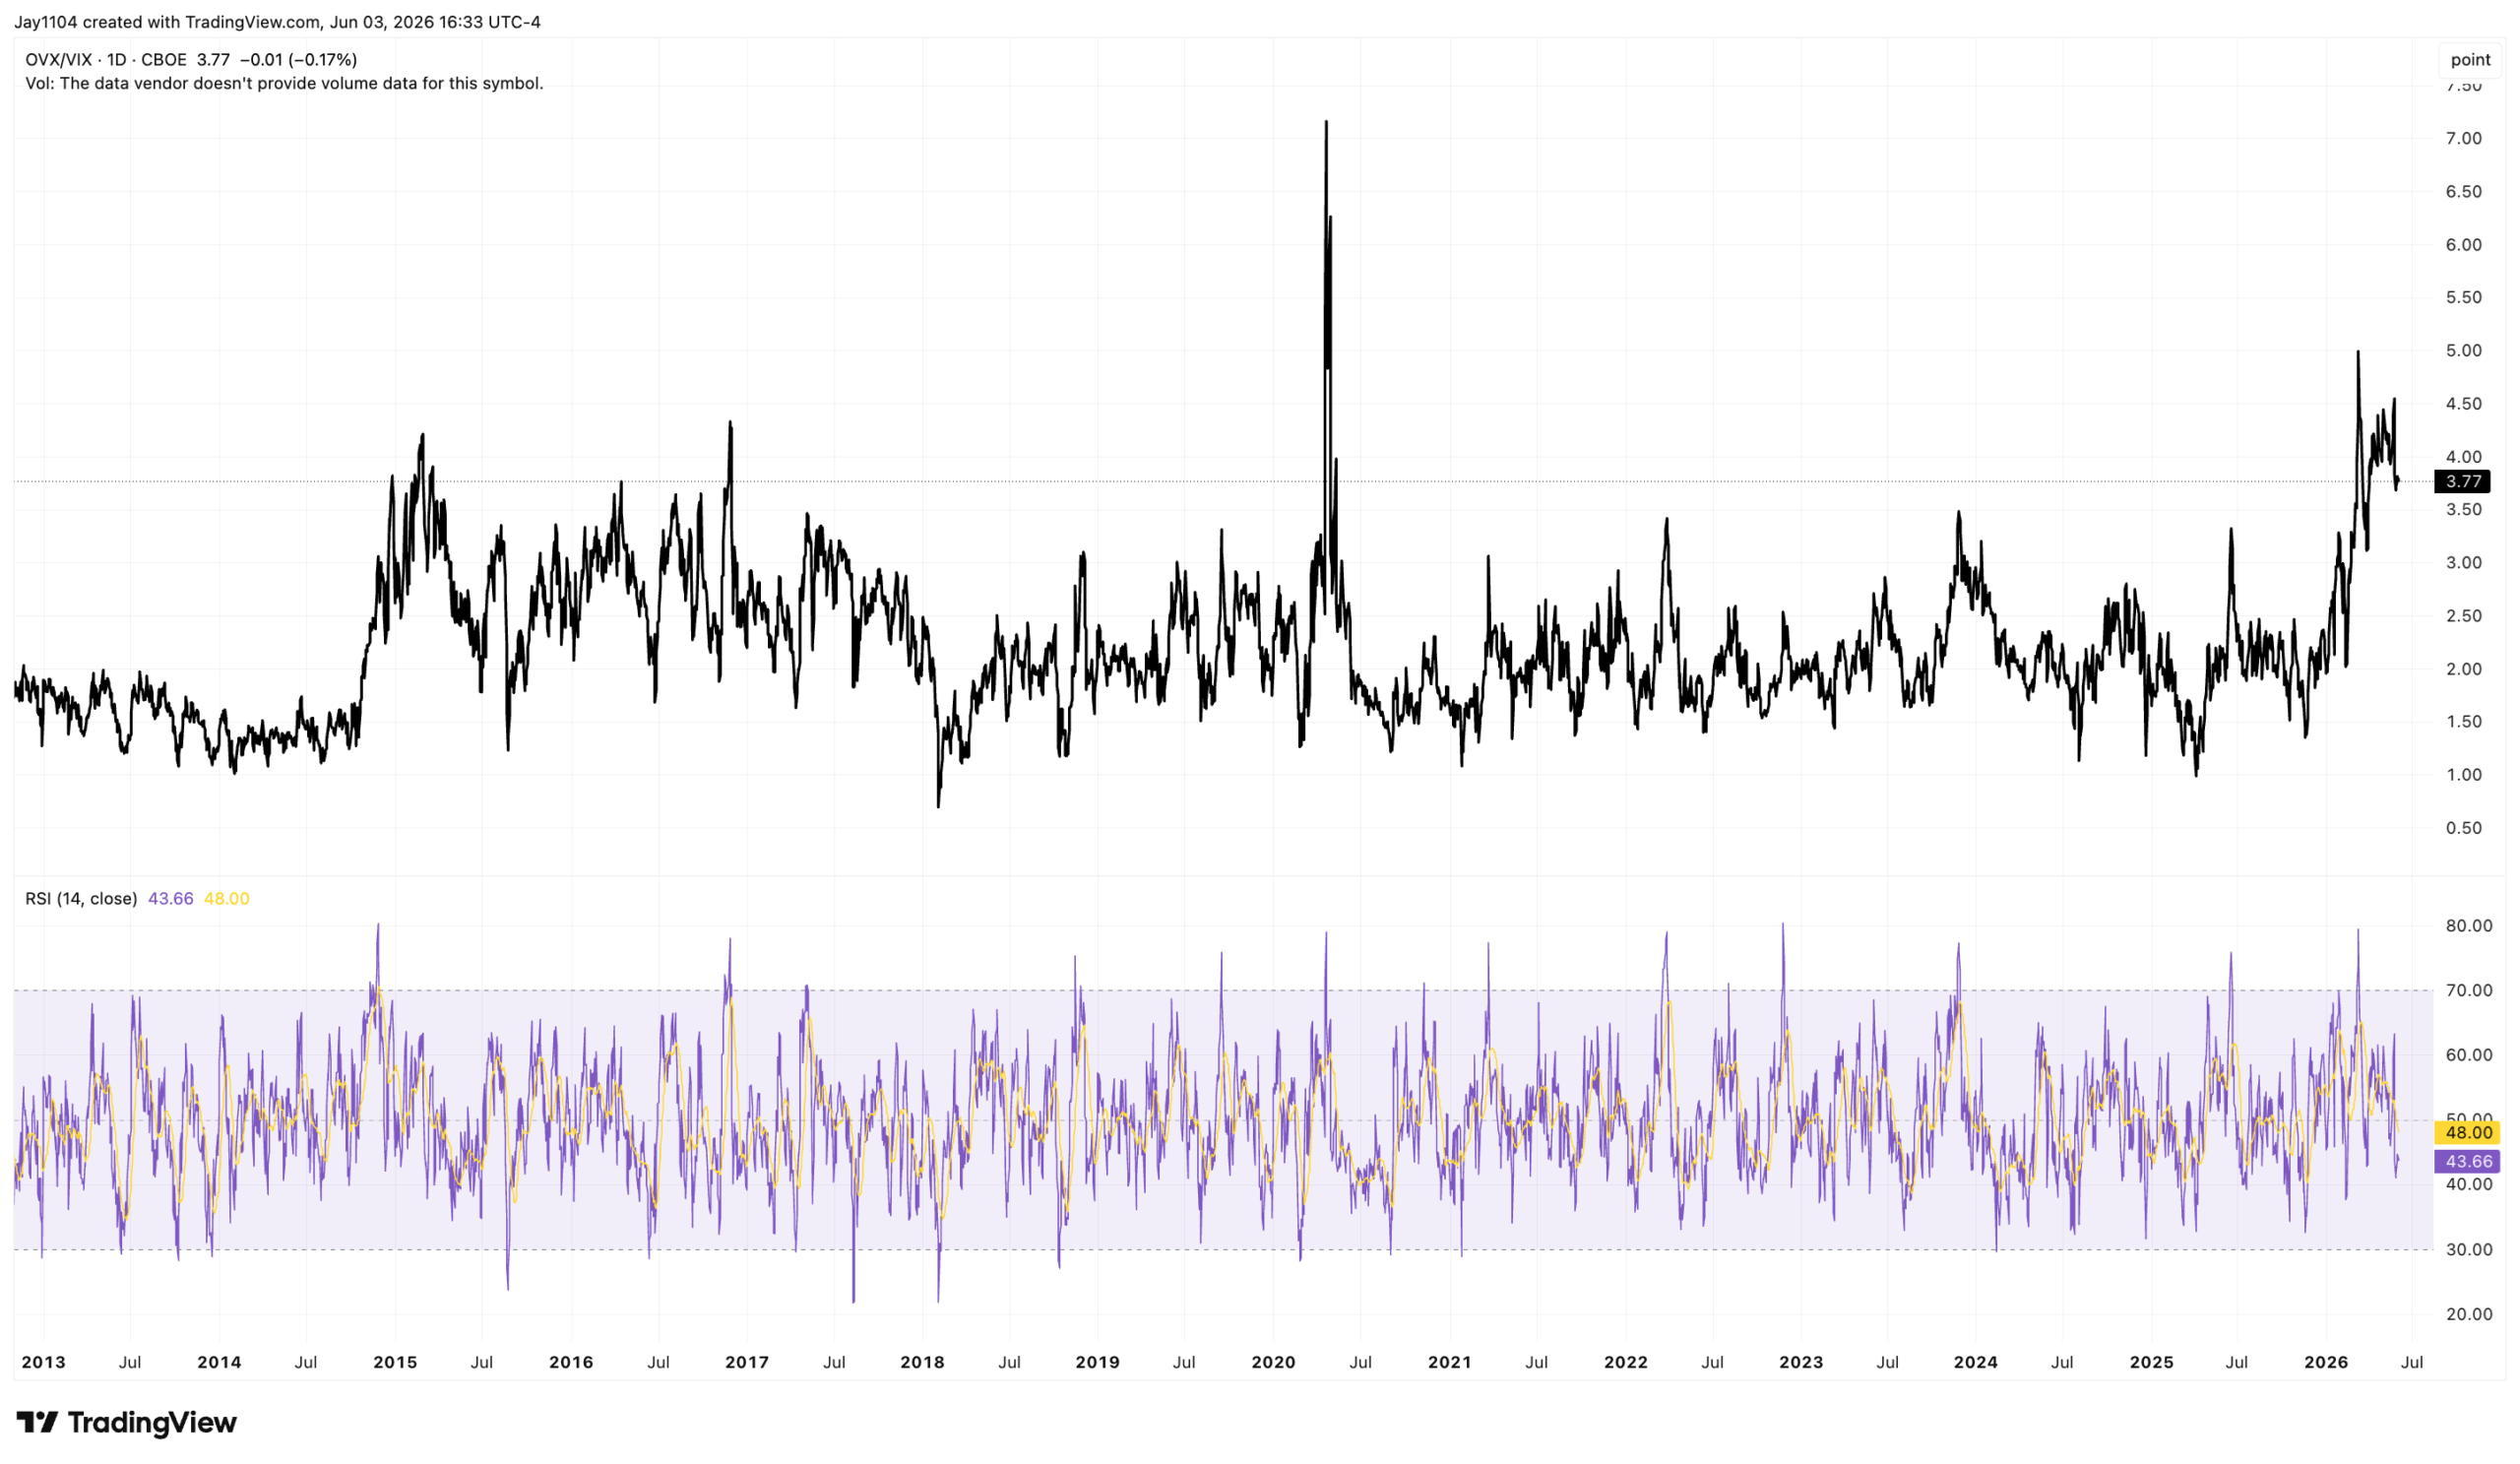
Meanwhile, the ratio of the VIX to the OVX remains elevated at around 3.8 and has shown little sign of declining. Given how much oil implied volatility has already fallen from its recent highs, the fact that the ratio has remained so elevated suggests that the decline in the VIX has largely mirrored the decline in oil volatility. In other words, equity volatility has not become materially cheaper relative to oil volatility, despite the significant retracement in the OVX.
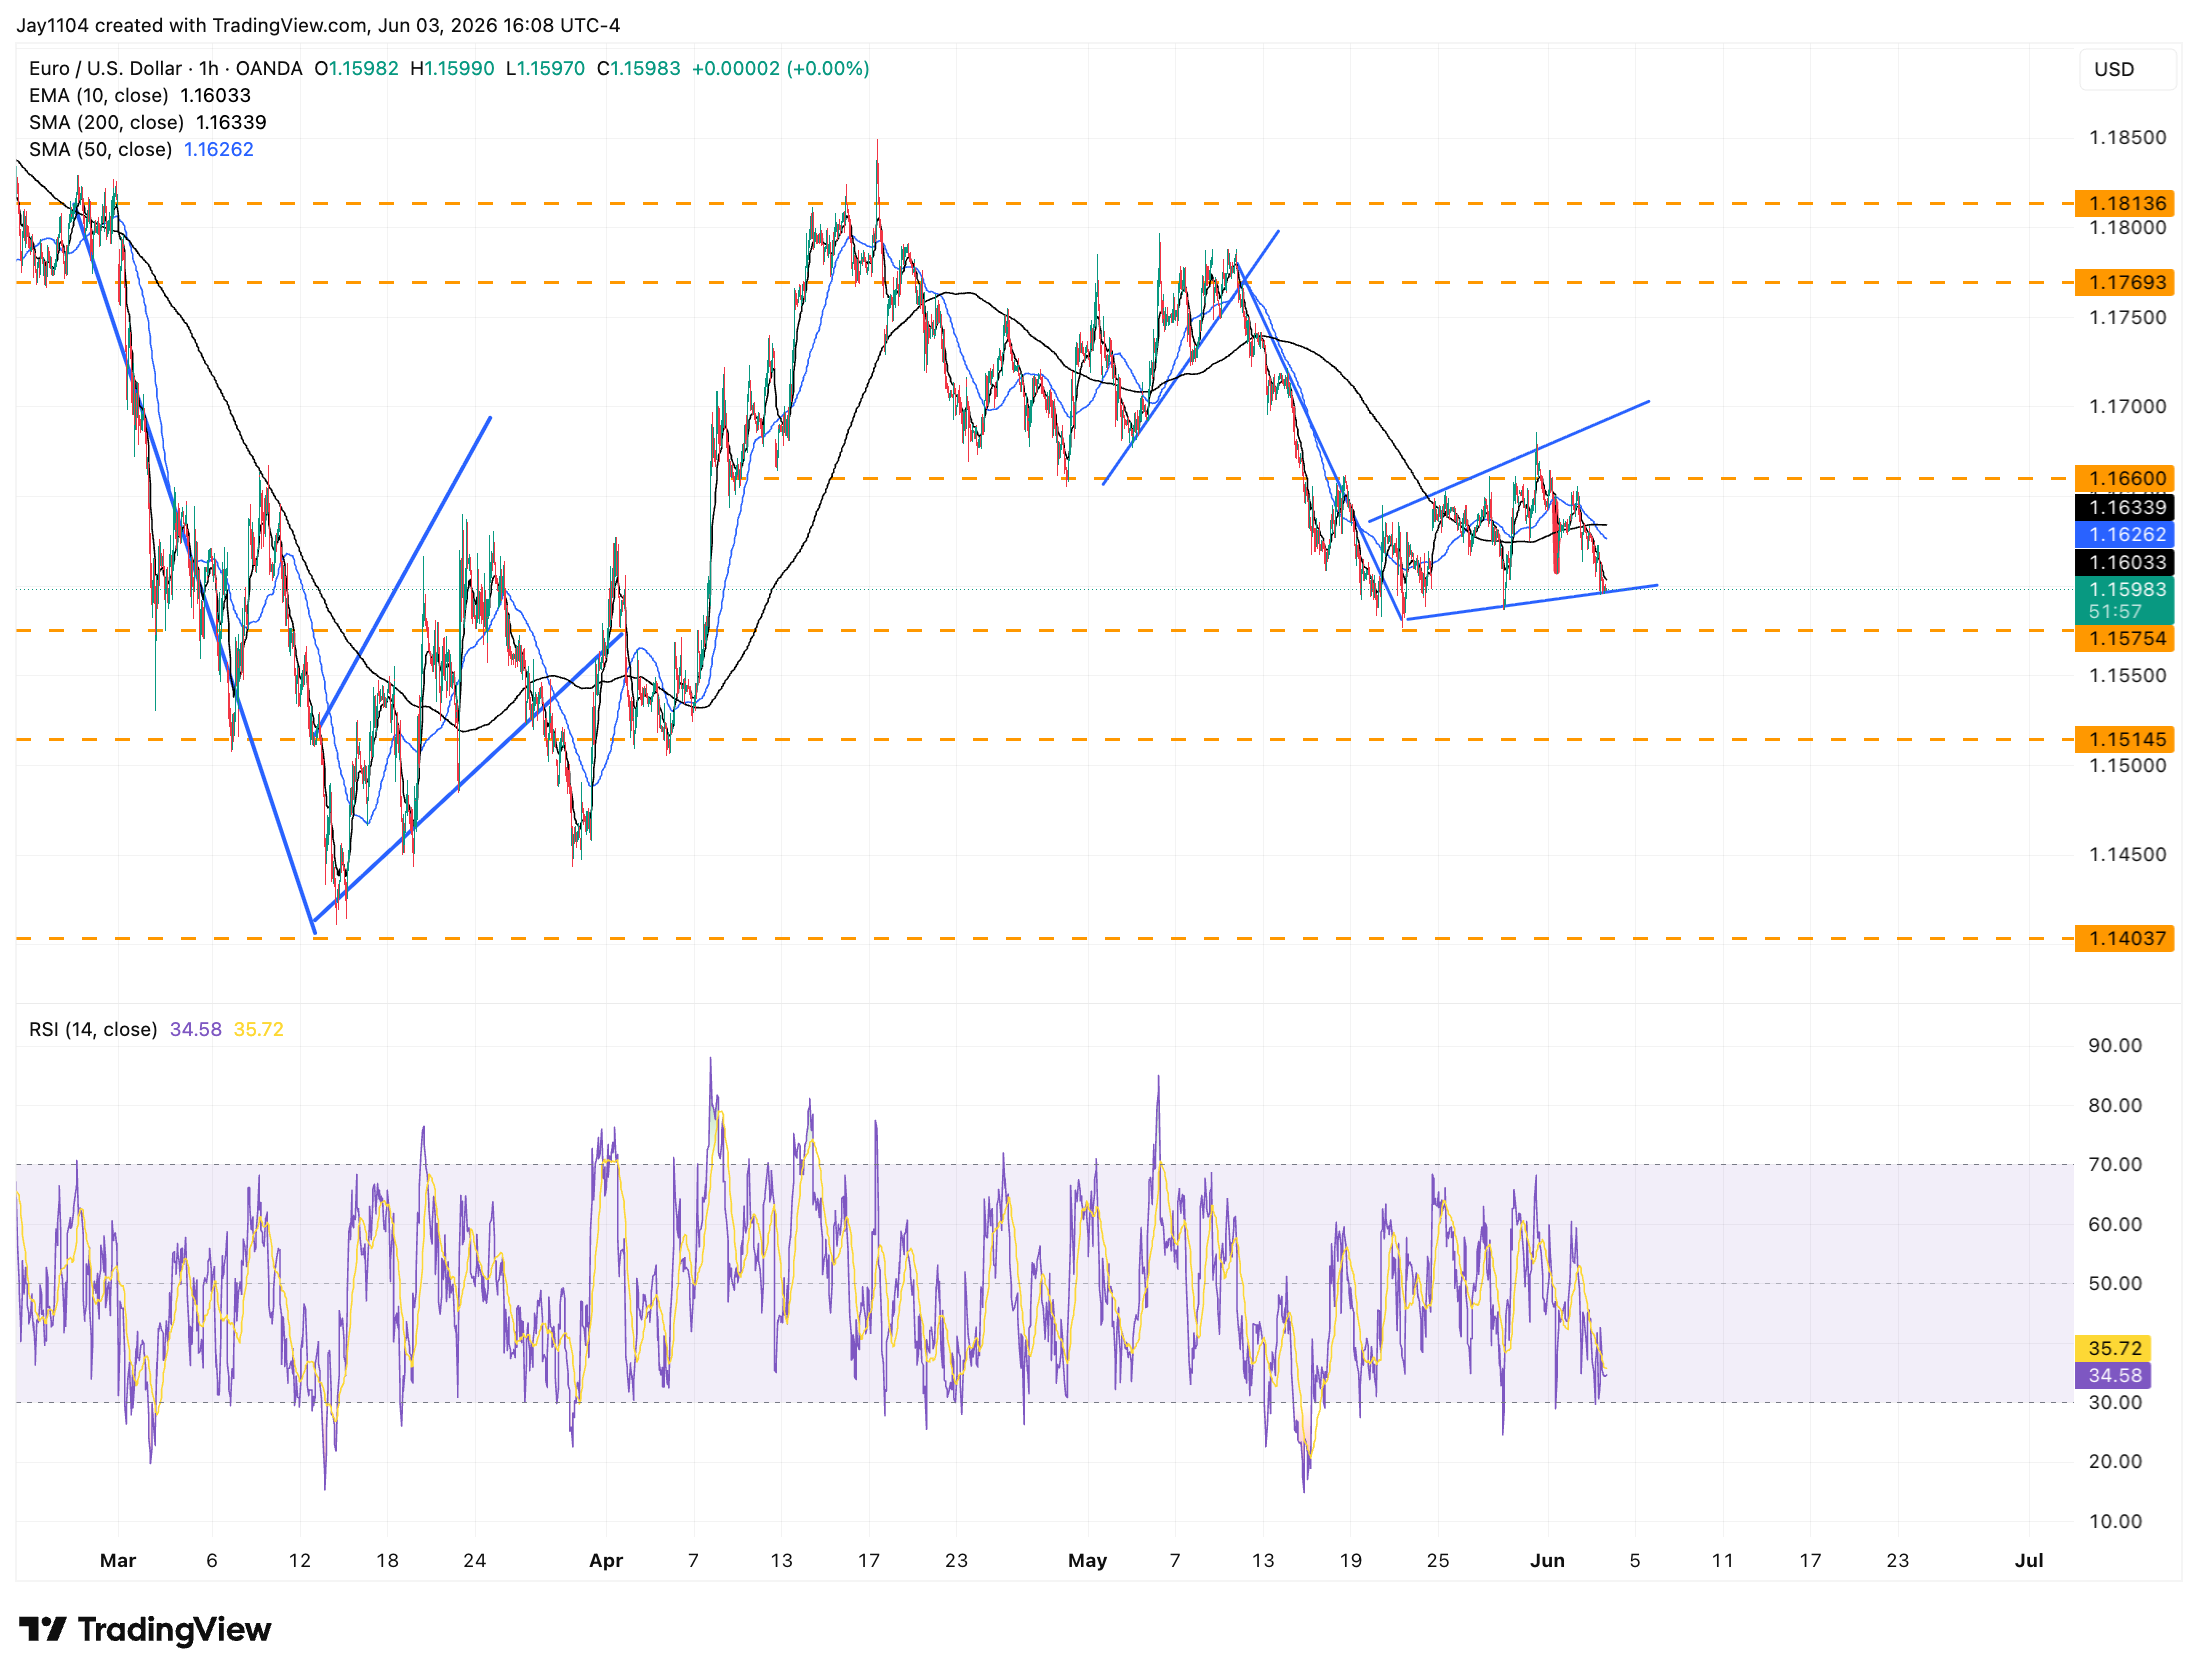
This, along with a better-than-expected JOLTS report yesterday and a solid ADP report today, helped strengthen the dollar against the euro. The EUR/USD appears poised to weaken further, forming what looks like a bear flag pattern. In this case, a break below support around 1.155 would likely trigger a move initially lower toward 1.151.
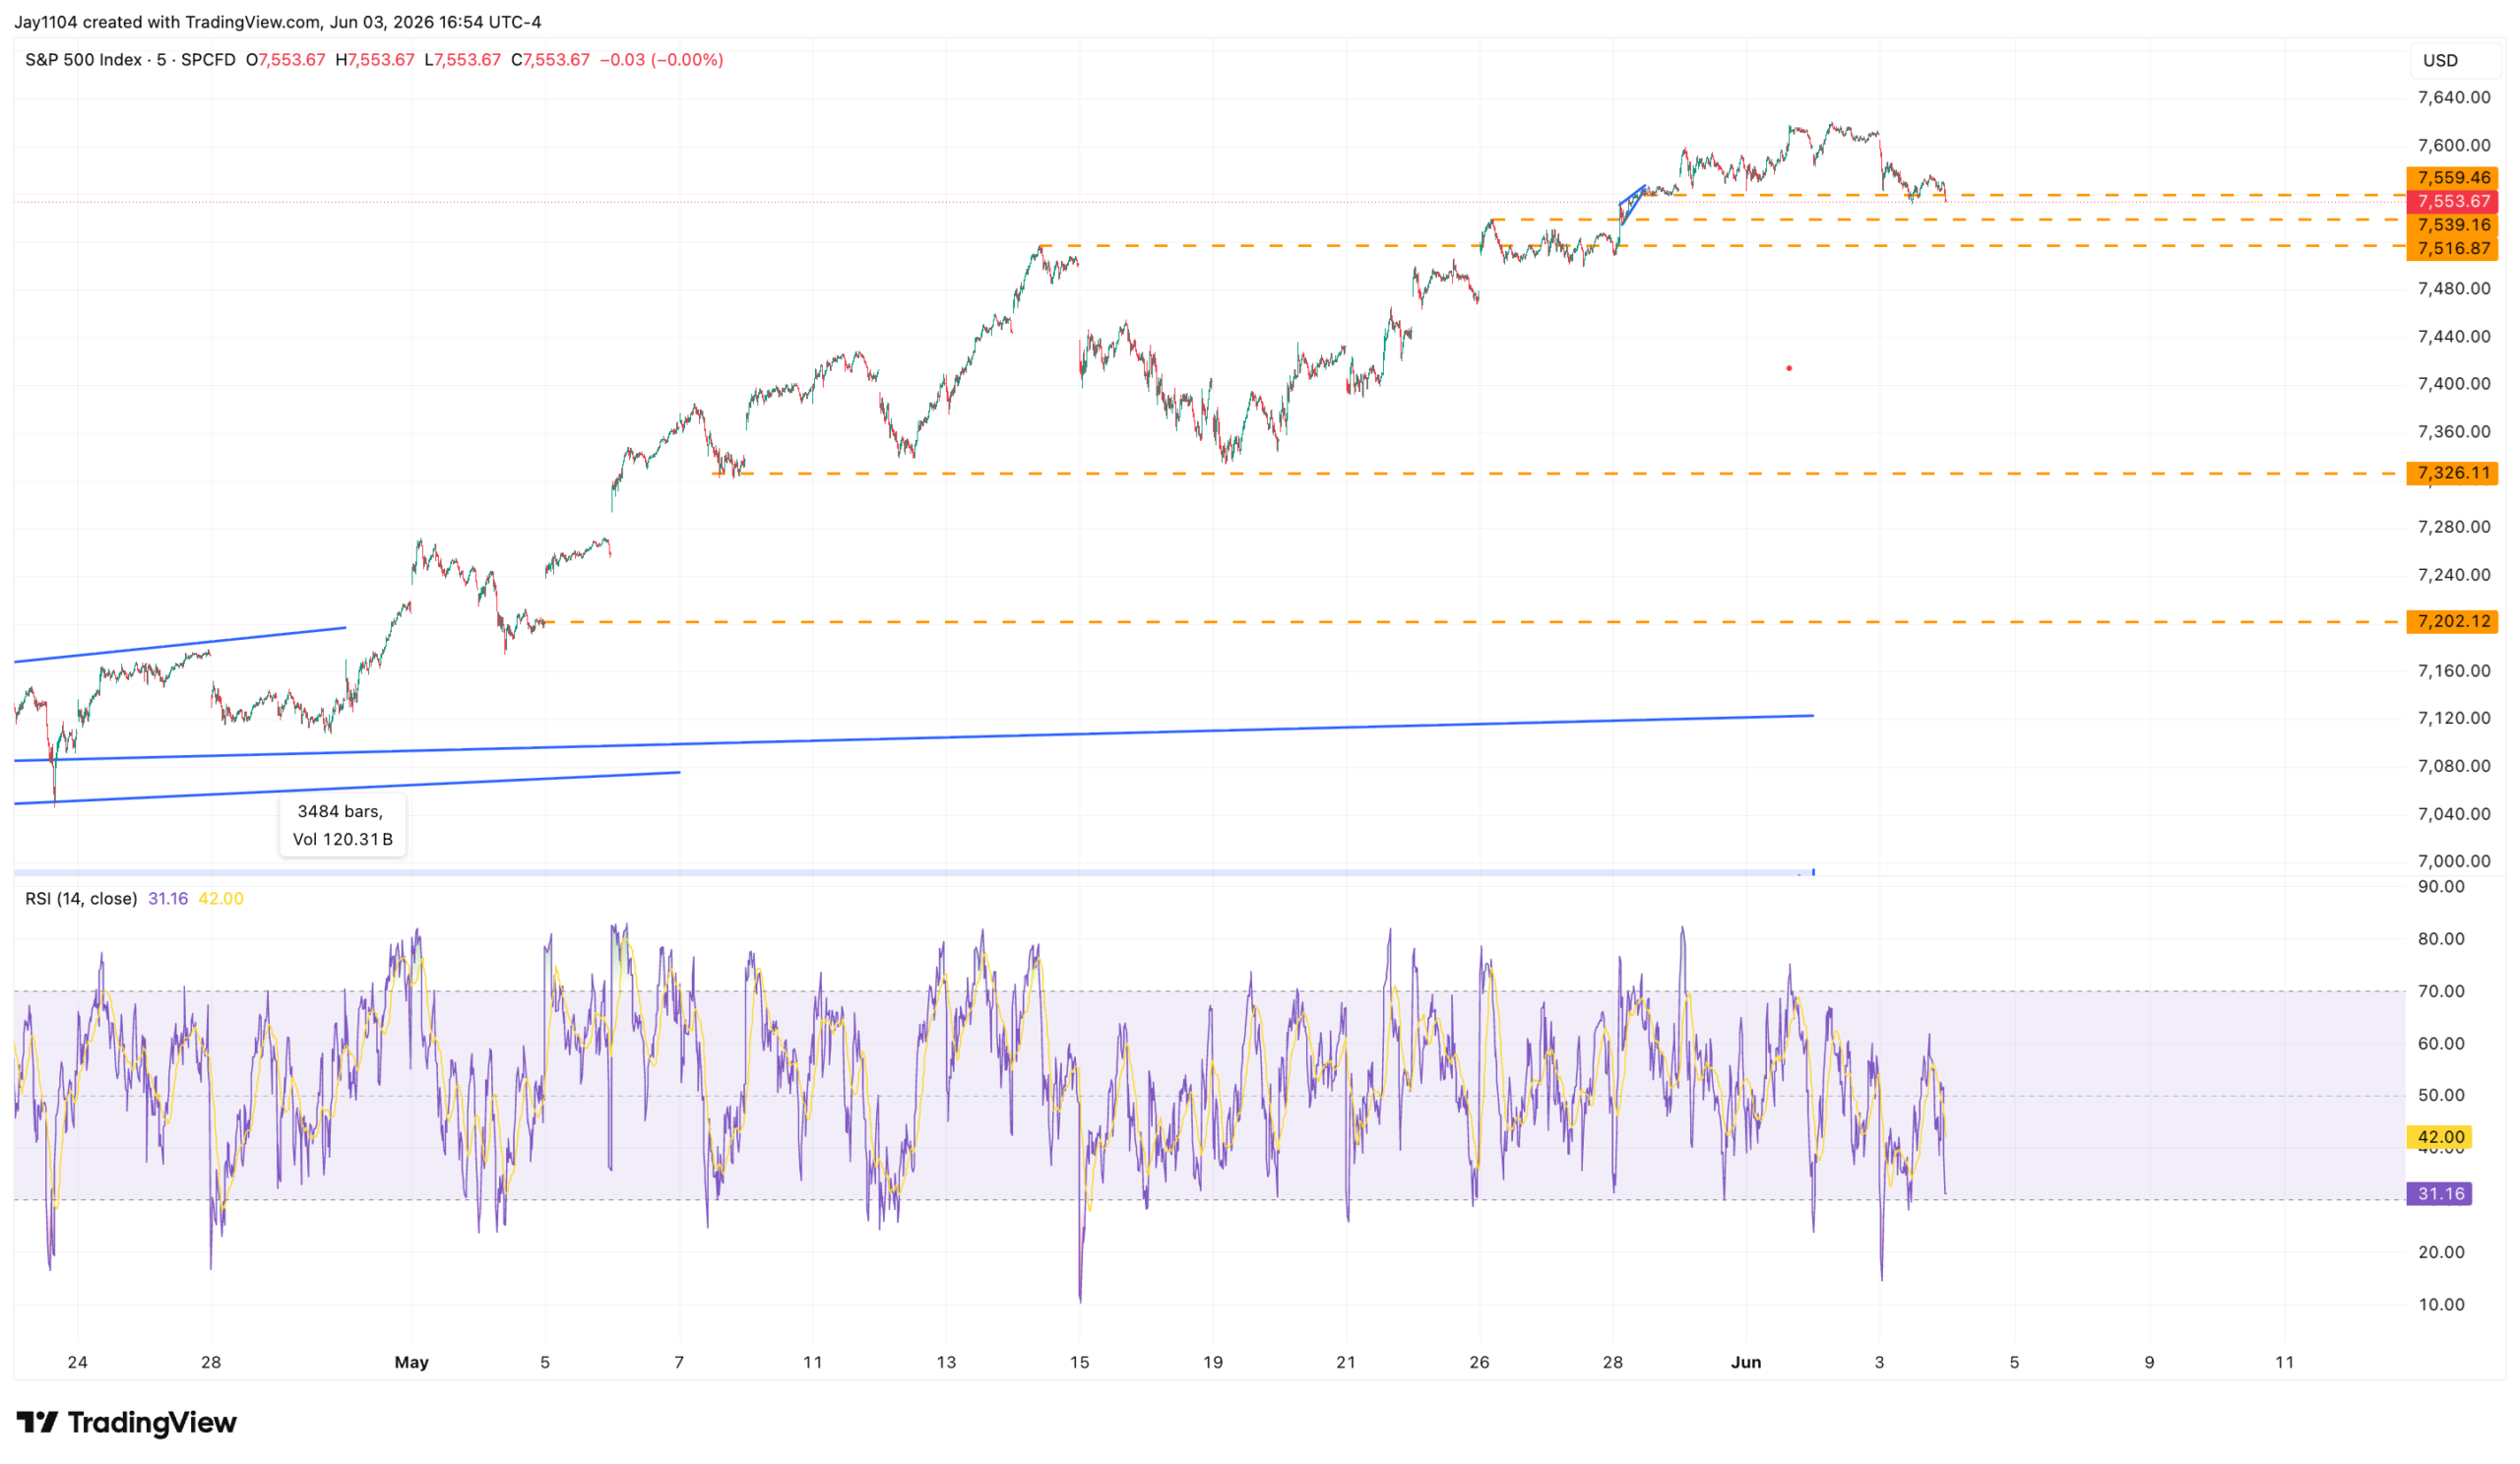
The put wall in the S&P 500 was around 7,550 today, helping support the market. However, based on current positioning, the put wall could shift lower tomorrow, potentially moving to around 7,200. If that occurs, the S&P 500 could slip back into a negative gamma regime, which would likely be less supportive of market stability and could contribute to increased volatility.
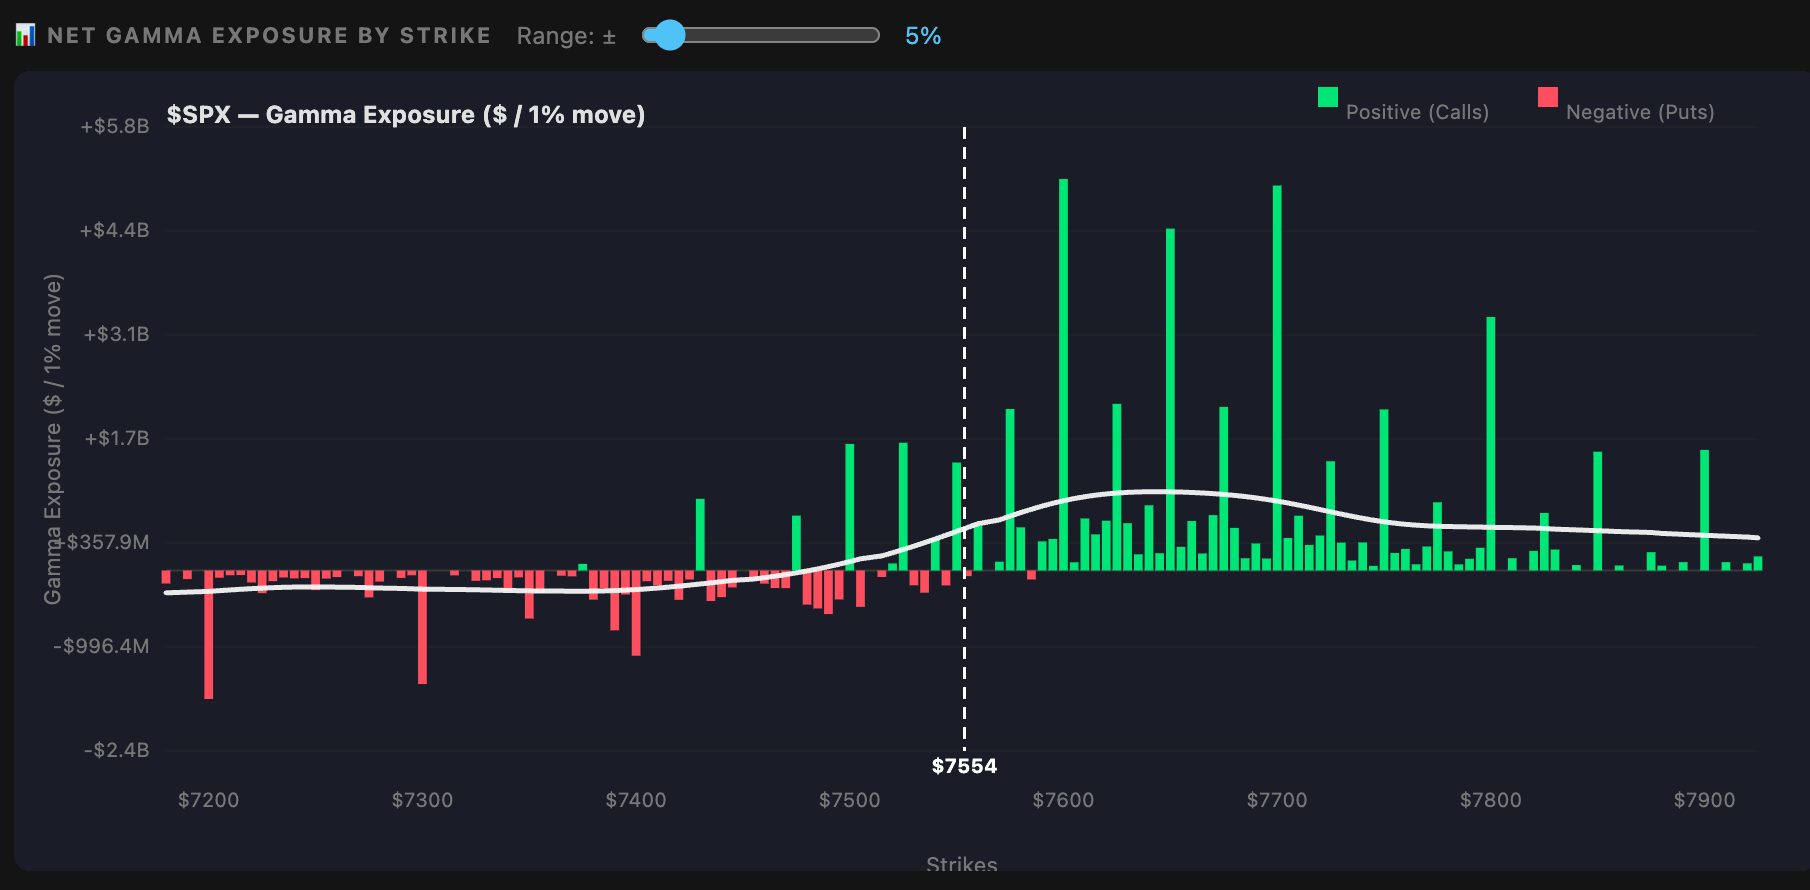
The technical chart already reflects much of this, with support concentrated between 7,500 and 7,550. However, below 7,500, support begins to thin out considerably until around 7,350, suggesting that a break of that level could leave the index more vulnerable to a sharper decline.
On top of that, index volatility remains relatively low, and if oil volatility rises, it will likely pull the VIX higher as well. That combination could create the conditions for a meaningful market pullback, particularly if volatility rises as support levels begin to give way.
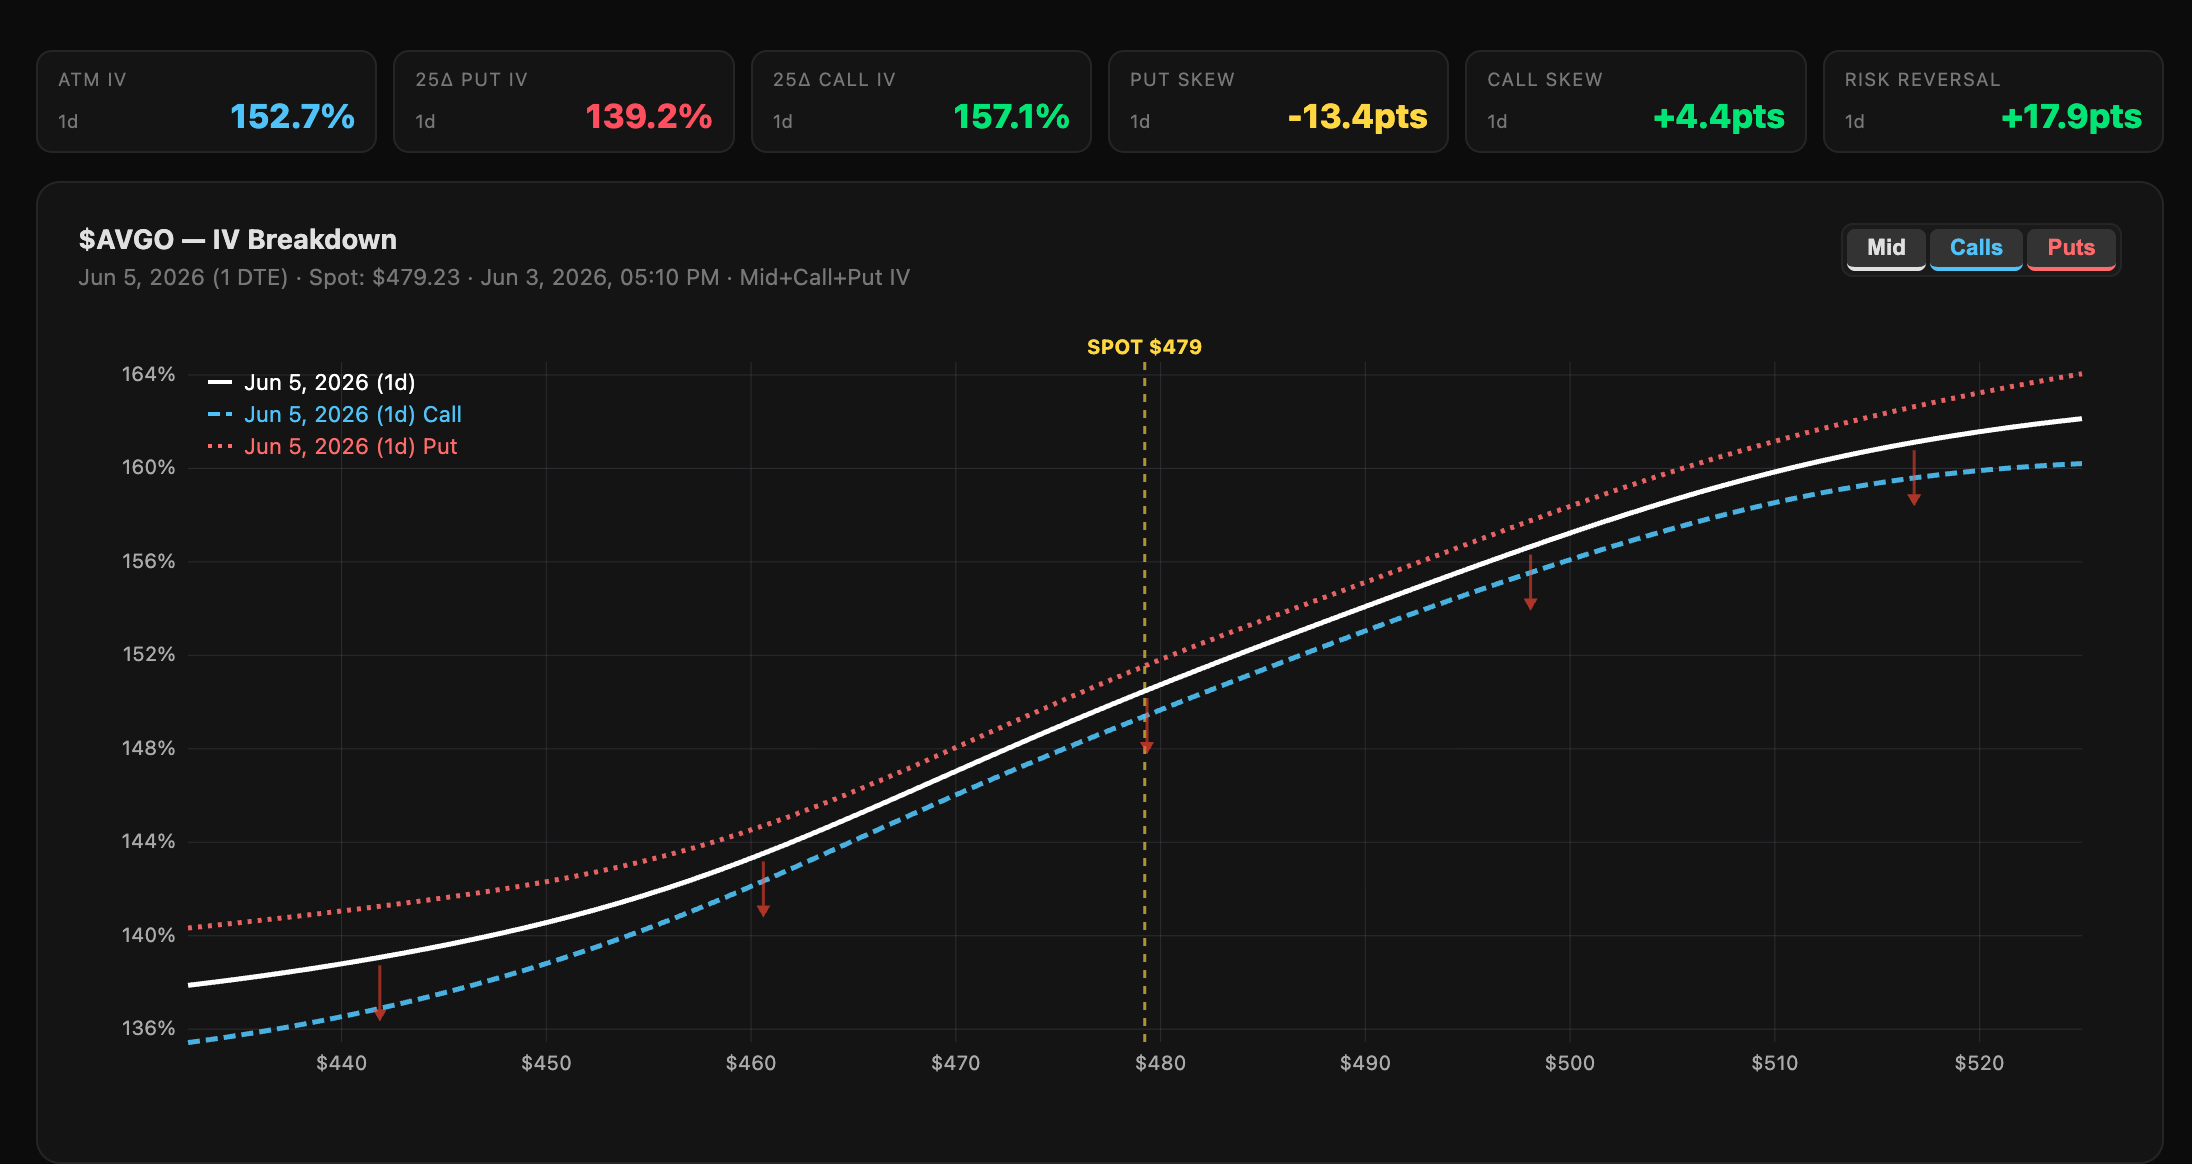
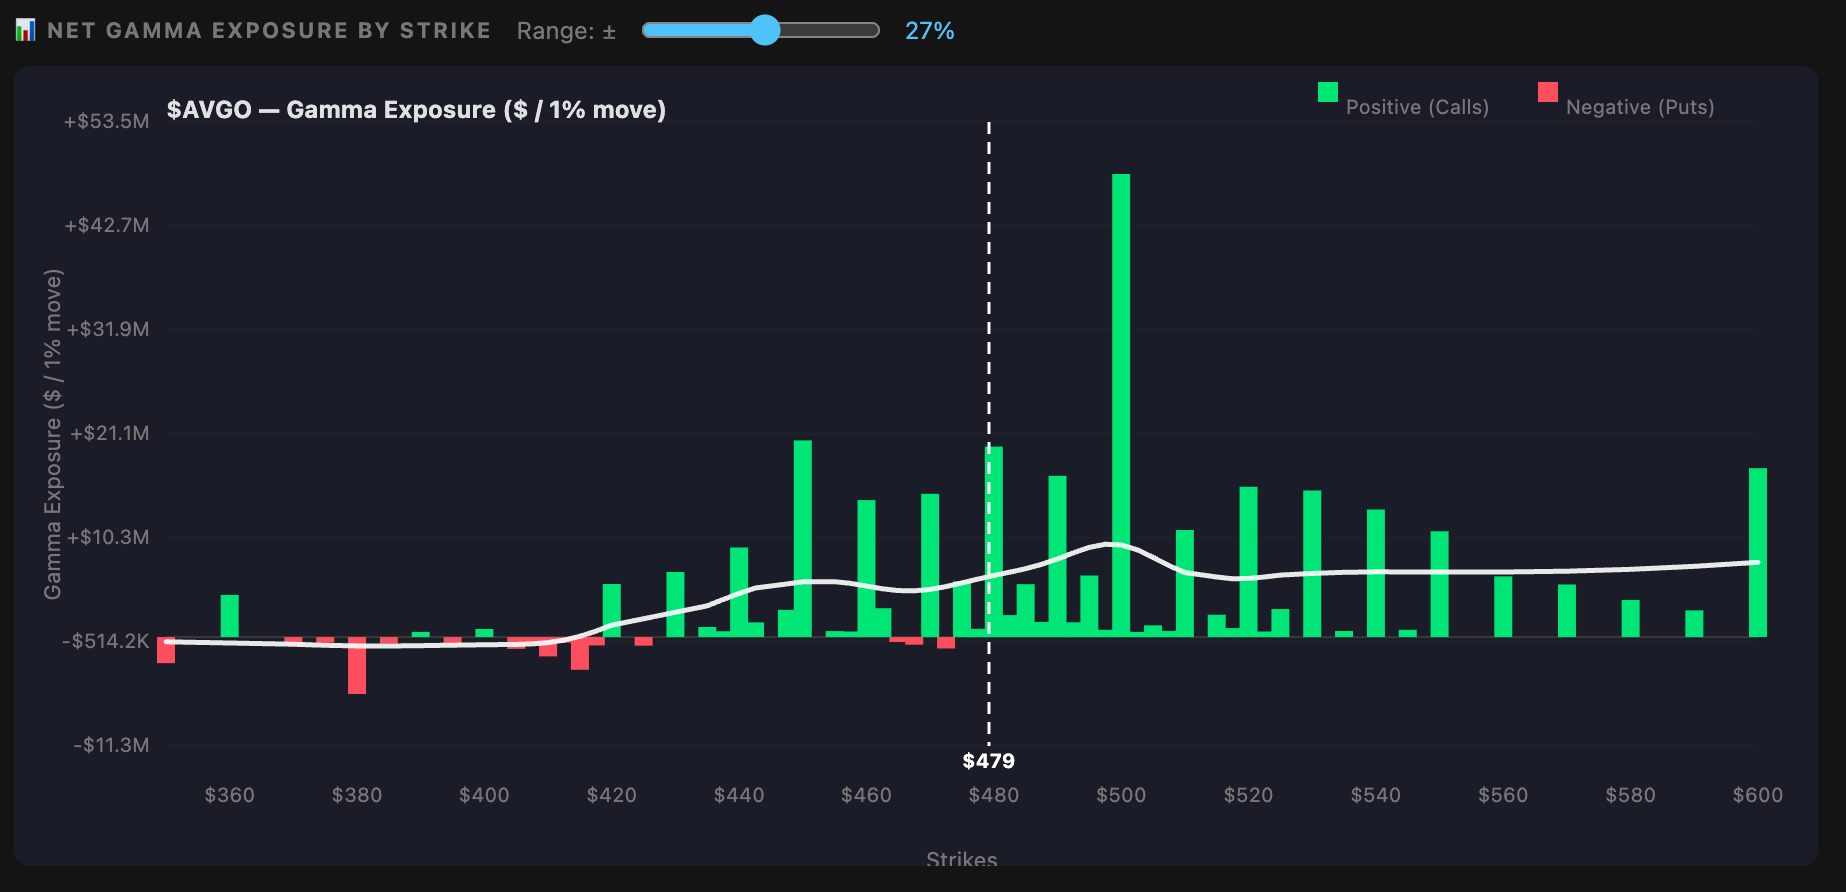
There is a chance of that as well, especially with Broadcom trading roughly 15% lower after hours following its earnings results. Implied volatility for Friday had risen to around 150% ahead of the report, and the skew was heavily tilted toward a higher price, with an upward-sloping volatility curve. In other words, upside exposure was being priced much more aggressively than downside risk.
As a result, we are seeing the typical post-earnings dynamic, where call options are getting hit particularly hard as implied volatility collapses and the earnings risk premium is removed from option prices.
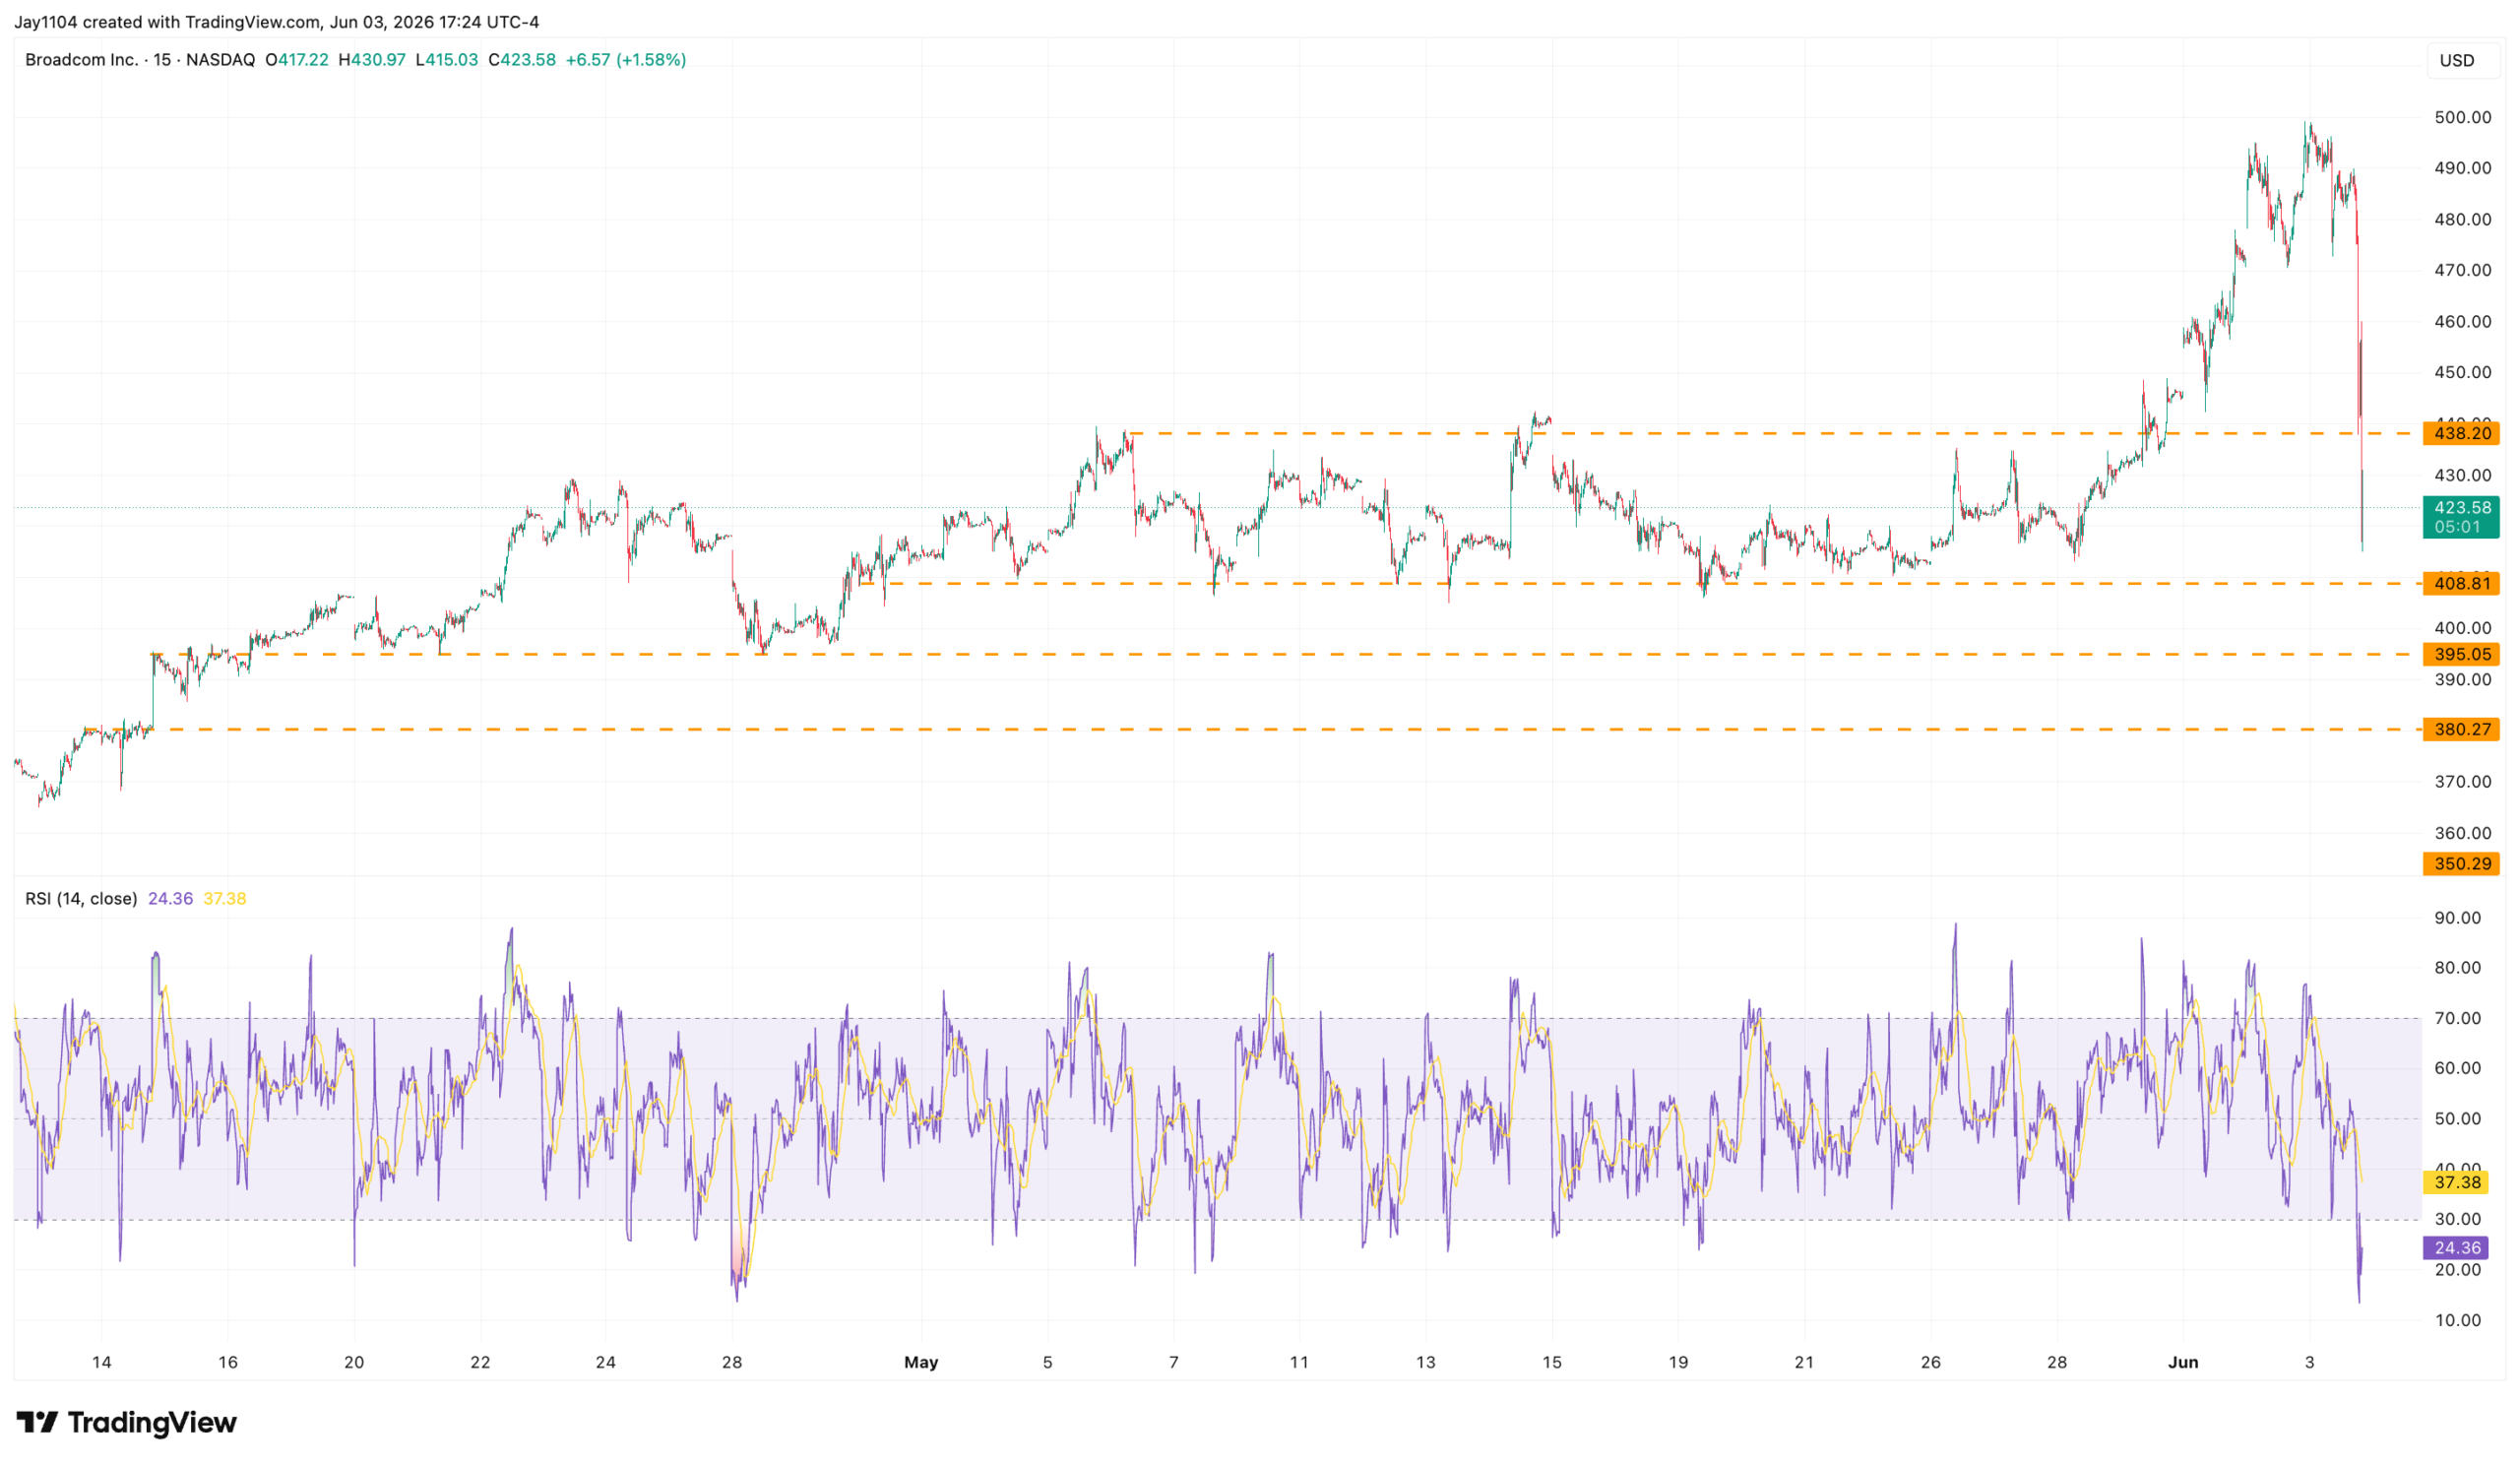
The stock has a put wall at $380, so there could still be some pain ahead depending on how the conference call unfolds. For now, the key area to watch is the $430-$440 gamma-flip zone. If the stock can find support there, it may help stabilize the price action. However, a failure to hold that region could increase the risk of a deeper decline toward lower support levels.
The chart suggests that if $440 fails to hold, the next area of support comes in around $410. Below that, the next meaningful technical support level is near $395. As a result, a break below $440 could leave the stock vulnerable to a move lower as it searches for the next area of support.
A bit longer than usual, but I guess I was feeling generous when it came to the Broadcom analysis.
-Mike
Glossary by ChatGPT
ADP Report — A monthly private-sector employment report that provides an estimate of U.S. job growth before the official payrolls release.
Bear Flag — A technical chart pattern that suggests a temporary pause within a broader downtrend before another move lower.
Gamma Flip Zone — A price region where options dealer positioning may shift from stabilizing to amplifying stock price movements, or vice versa.
Implied Volatility — The market’s forecast of future price fluctuations derived from option prices.
Inverse Head-and-Shoulders Pattern — A bullish technical formation that often signals a potential trend reversal from downtrend to uptrend.
JOLTS Report — The Job Openings and Labor Turnover Survey, which measures labor market demand and worker turnover in the United States.
Neckline — A key chart level that connects support or resistance points and serves as the breakout threshold in many technical patterns.
Negative Gamma Regime — A market environment where dealer hedging activity can amplify price swings and increase volatility.
OVX — The CBOE Crude Oil Volatility Index, which measures the market’s expectation of future oil price volatility.
Put Wall — A strike price with significant put option open interest that can act as a support level due to hedging dynamics.
Realized Volatility — A measure of how much an asset’s price has actually fluctuated over a specified historical period.
Skew — The difference in implied volatility across option strike prices, reflecting how markets price upside versus downside risk.
VIX — The CBOE Volatility Index, commonly used as a measure of expected volatility in the U.S. equity market.
VIX/OVX Ratio — A relative measure comparing expected equity market volatility to expected crude oil volatility.
VIXEQ — A volatility index based on S&P 500 options that provides an alternative measure of expected equity market volatility.
WTI — West Texas Intermediate, a benchmark grade of crude oil commonly used in global energy markets.
Disclosure
This report contains independent commentary to be used for informational and educational purposes only. Michael Kramer is a member and investment adviser representative with Mott Capital Management. Mr. Kramer is not affiliated with this company and does not serve on the board of any related company that issued this stock. All opinions and analyses presented by Michael Kramer in this analysis or market report are solely Michael Kramer’s views. Readers should not treat any opinion, viewpoint, or prediction expressed by Michael Kramer as a specific solicitation or recommendation to buy or sell a particular security or follow a particular strategy. Michael Kramer’s analyses are based upon information and independent research that he considers reliable, but neither Michael Kramer nor Mott Capital Management guarantees its completeness or accuracy, and it should not be relied upon as such. Michael Kramer is not under any obligation to update or correct any information presented in his analyses. Mr. Kramer’s statements, guidance, and opinions are subject to change without notice. Past performance is not indicative of future results. Neither Michael Kramer nor Mott Capital Management guarantees any specific outcome or profit. You should be aware of the real risk of loss in following any strategy or investment commentary presented in this analysis. Strategies or investments discussed may fluctuate in price or value. Investments or strategies mentioned in this analysis may not be suitable for you. This material does not consider your particular investment objectives, financial situation, or needs and is not intended as a recommendation appropriate for you. You must make an independent decision regarding investments or strategies in this analysis. Upon request, the advisor will provide a list of all recommendations made during the past twelve months. Before acting on information in this analysis, you should consider whether it is suitable for your circumstances and strongly consider seeking advice from your own financial or investment adviser to determine the suitability of any investment.