
Markets Enter a Potentially Volatile Summer Period Starting This Week


Liquidity is due to thin out as we enter the second half of 2026, and at Navigating The Market, one of the things we focus on is changes in liquidity. Now is the time to join.
The Independence Day Sale is now live.
30% off Monthly and Annual subscriptions, permanently. Subscribe before July 5 at 11 pm, and the discount locks in forever. Not for a month, not for a year. As long as you stay subscribed.
If you’ve been following along and thinking about going paid, this is the week to do it.
Stocks finished essentially flat again on Friday, marking the third straight day that the S&P 500 has moved by 10 basis points or less. I can’t remember the last time that happened.
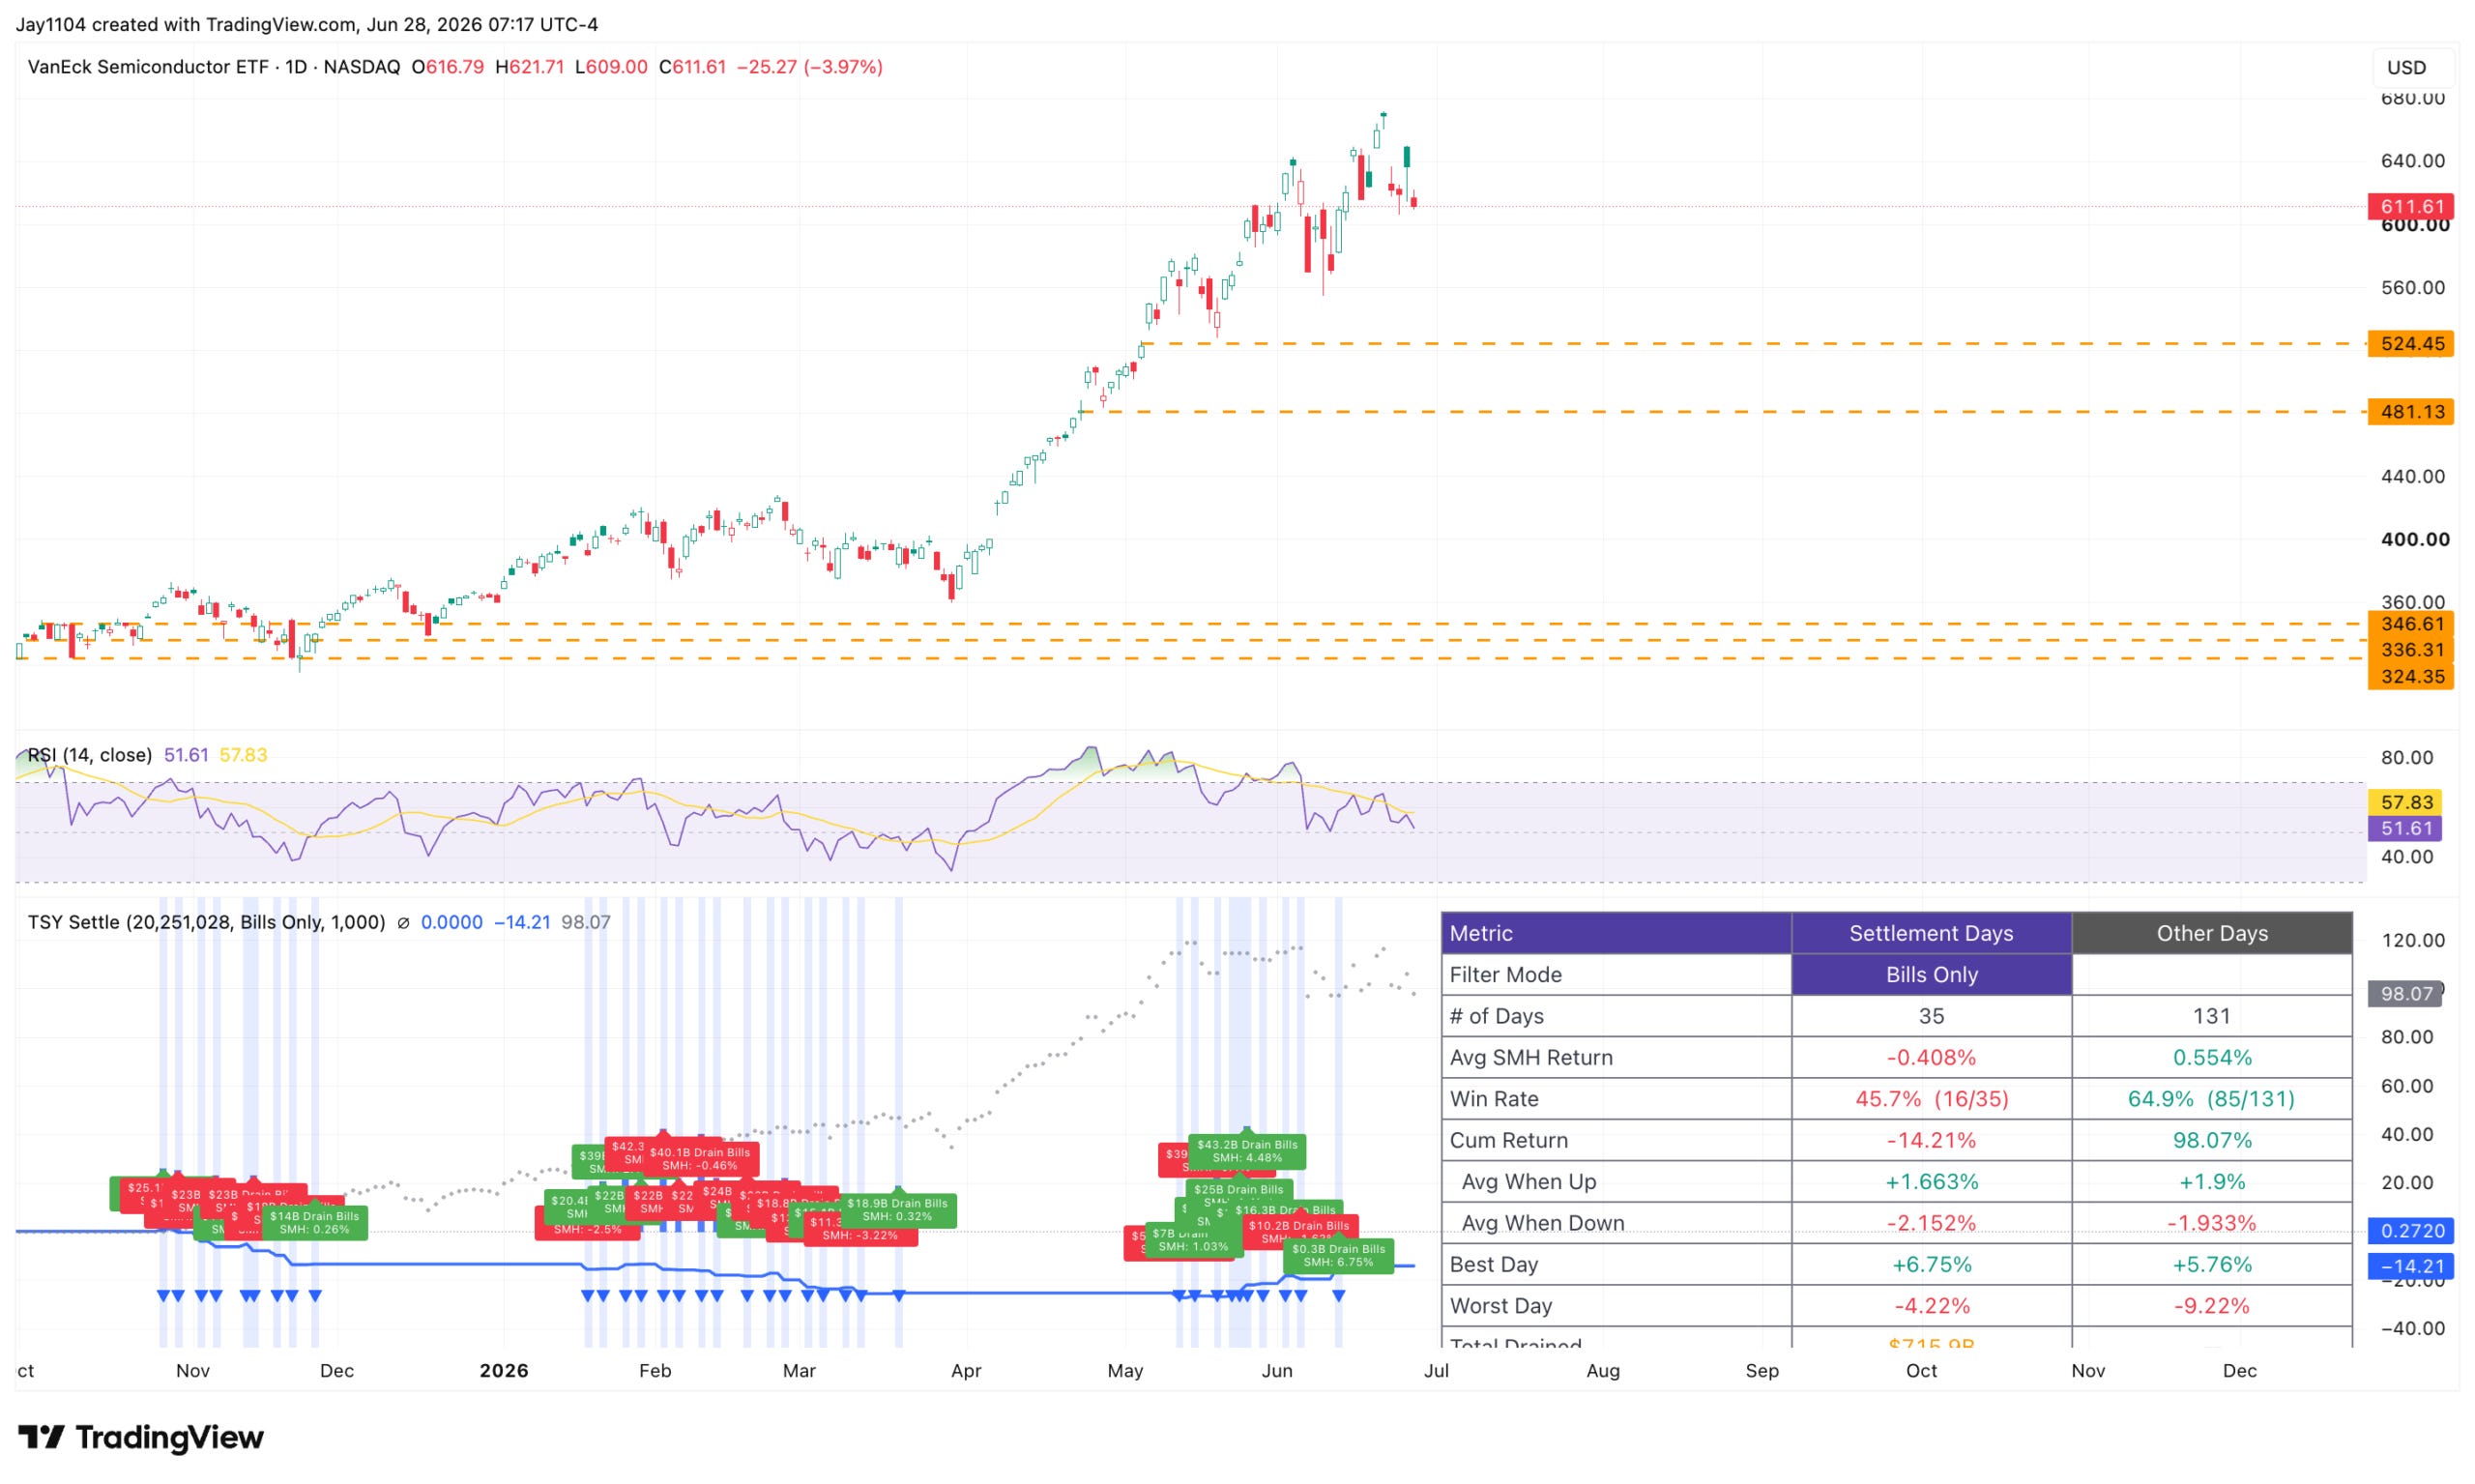
That wasn’t the case for the Nasdaq 100, which fell more than 1% on Friday and finished the week down more than 4%. What’s interesting is that the price action has tracked the Semiconductor ETF (SMH), which declined roughly 7% this week. Semiconductors continue to be the primary driver of the broader market, and as long as that remains the case, the market is likely to stay vulnerable.
While the distribution has shifted somewhat, the SMH heatmap still shows that the ETF’s top 10 holdings remain relatively elevated in implied volatility rankings.
, with today's median at 98/38. TXN leads in skew rank (~97); NVDA is an outlier with low IV percentile (~30) and low skew rank (~26)")
Liquidity Flows Shift
This week marks a turning point in liquidity flows, at least as they relate to Treasury issuance. On June 30, Treasury coupon settlements will total $64.1 billion, while Treasury bill paydowns will amount to roughly $4.9 billion. Then, on July 2, net issuance returns with a $1.5 billion Treasury bill settlement. Beginning next week, settlement amounts will increase significantly through the end of July and are expected to remain elevated into early September.
Historically, periods of heavy Treasury settlements have not been favorable for the SMH. Since October 28, the ETF has risen on just 16 of the 35 Treasury bill settlement days, with an average decline of 40 basis points. By comparison, it has risen on 85 of 131 non-settlement days, posting an average gain of roughly 55 basis points.
The divergence is both wide and noticeable. While it could simply be the result of chance, the gap in both the percentage of winning days and the magnitude of returns appears too large to dismiss outright. Of course, only time will tell. The longer this relationship persists, the less likely it is to be purely coincidental.
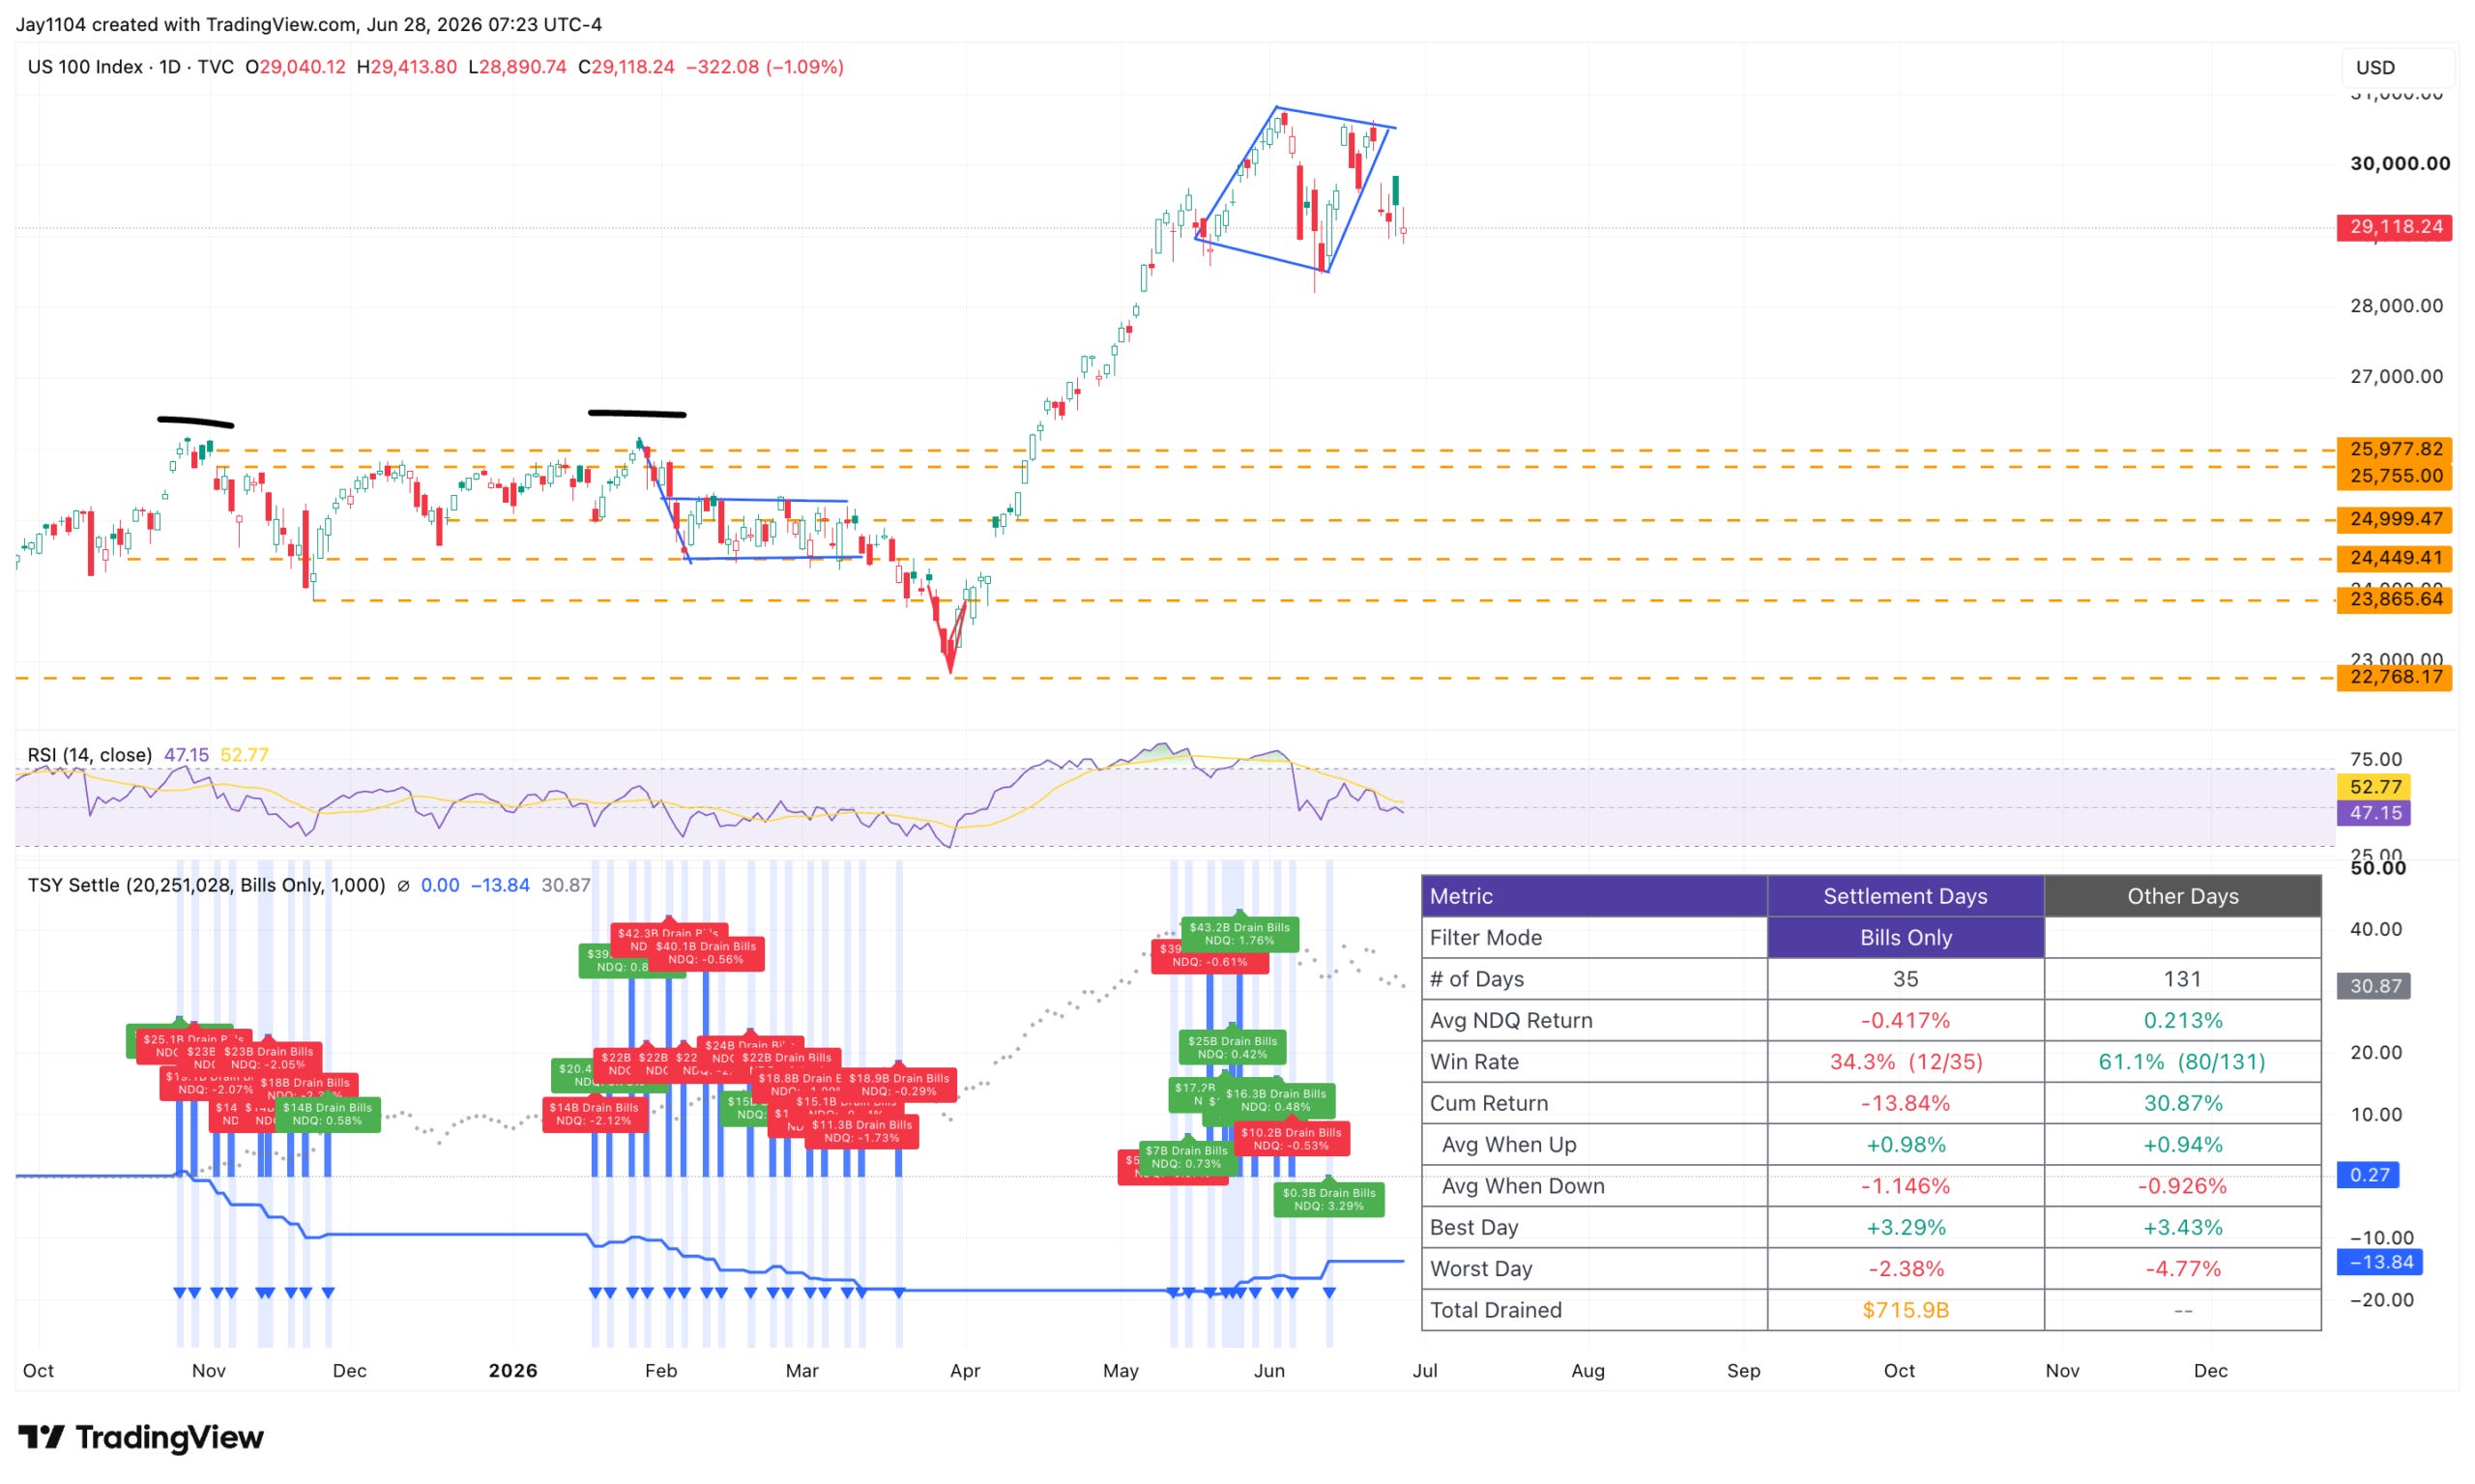
Not surprisingly, the pattern is very similar for the Nasdaq 100, which has risen on just 12 of the 35 settlement days since October 28, or 34.3% of the time, compared with gains on 80 of 131 non-settlement days, or 61.1% of the time. The average move on a settlement day has been a decline of nearly 42 basis points, versus an average gain of 21 basis points on non-settlement days.
Even Driven Week
This week will likely be driven by implied volatility as it rises ahead of multiple headline events, including new Fed Chair Kevin Warsh’s first appearance at the ECB Forum in Sintra on Wednesday, July 1. What has become, in recent years, the ECB’s version of Jackson Hole will feature the familiar central bank policy panel on stage with Warsh, joining Christine Lagarde, Tiff Macklem of the Bank of Canada, and Andrew Bailey of the Bank of England. The discussion begins at 8:00 a.m. ET.
This will be Warsh’s first public appearance outside of an FOMC setting, so markets will be eager to see whether he says anything that differs from his remarks at the post-meeting press conference.
If there’s a day that could be particularly rocky, Wednesday would be it, especially with the June jobs report due on Thursday, July 2. We could see volatility rise sharply throughout the day on July 1 as markets react to Warsh’s comments and, more importantly, hedge ahead of the jobs report.
I expect this to be a very interesting—perhaps long—summer.
-Mike
Glossary by ChatGPT
Basis Point (bp): One one-hundredth of a percentage point, or 0.01%.
Coupon Settlement: The date when investors pay for newly issued Treasury notes or bonds and securities are officially delivered.
ECB Forum in Sintra: The European Central Bank’s annual policy conference where global central bankers discuss economic and monetary policy.
FOMC: The Federal Open Market Committee, the Federal Reserve body responsible for setting U.S. monetary policy.
Heatmap: A visual representation showing the relative performance or characteristics of securities within a group.
Implied Volatility: The market’s expectation of future price fluctuations derived from option prices.
Jackson Hole: The Federal Reserve Bank of Kansas City’s annual economic symposium that often features important central bank policy discussions.
Liquidity Flows: The movement of cash through financial markets that can influence asset prices and market conditions.
Nasdaq 100: An equity index composed of 100 of the largest non-financial companies listed on the Nasdaq Stock Market.
Settlement Day: The date when payment and delivery of securities are finalized following issuance or a transaction.
SMH: The VanEck Semiconductor ETF, an exchange-traded fund tracking the performance of leading semiconductor companies.
Treasury Bill (T-Bill): A short-term U.S. government debt security with a maturity of one year or less.
Treasury Bill Paydown: The reduction of outstanding Treasury bills as maturing securities are repaid without full replacement through new issuance.
Treasury Issuance: The process by which the U.S. Treasury sells new government debt securities to finance government operations.
Disclosure
This report contains independent commentary to be used for informational and educational purposes only. Michael Kramer is a member and investment adviser representative with Mott Capital Management. Mr. Kramer is not affiliated with this company and does not serve on the board of any related company that issued this stock. All opinions and analyses presented by Michael Kramer in this analysis or market report are solely Michael Kramer’s views. Readers should not treat any opinion, viewpoint, or prediction expressed by Michael Kramer as a specific solicitation or recommendation to buy or sell a particular security or follow a particular strategy. Michael Kramer’s analyses are based upon information and independent research that he considers reliable, but neither Michael Kramer nor Mott Capital Management guarantees its completeness or accuracy, and it should not be relied upon as such. Michael Kramer is not under any obligation to update or correct any information presented in his analyses. Mr. Kramer’s statements, guidance, and opinions are subject to change without notice. Past performance is not indicative of future results. Neither Michael Kramer nor Mott Capital Management guarantees any specific outcome or profit. You should be aware of the real risk of loss in following any strategy or investment commentary presented in this analysis. Strategies or investments discussed may fluctuate in price or value. Investments or strategies mentioned in this analysis may not be suitable for you. This material does not consider your particular investment objectives, financial situation, or needs and is not intended as a recommendation appropriate for you. You must make an independent decision regarding investments or strategies in this analysis. Upon request, the advisor will provide a list of all recommendations made during the past twelve months. Before acting on information in this analysis, you should consider whether it is suitable for your circumstances and stron