
Market Imbalances Raise the Risk of a Volatility Unwind

Well, after being away for just over a week, I am officially back. I’m sure everyone missed me.
Magically, not much has changed since we last touched base. Even after falling by around 0.8% today, the S&P 500 is still roughly where it was on July 2.
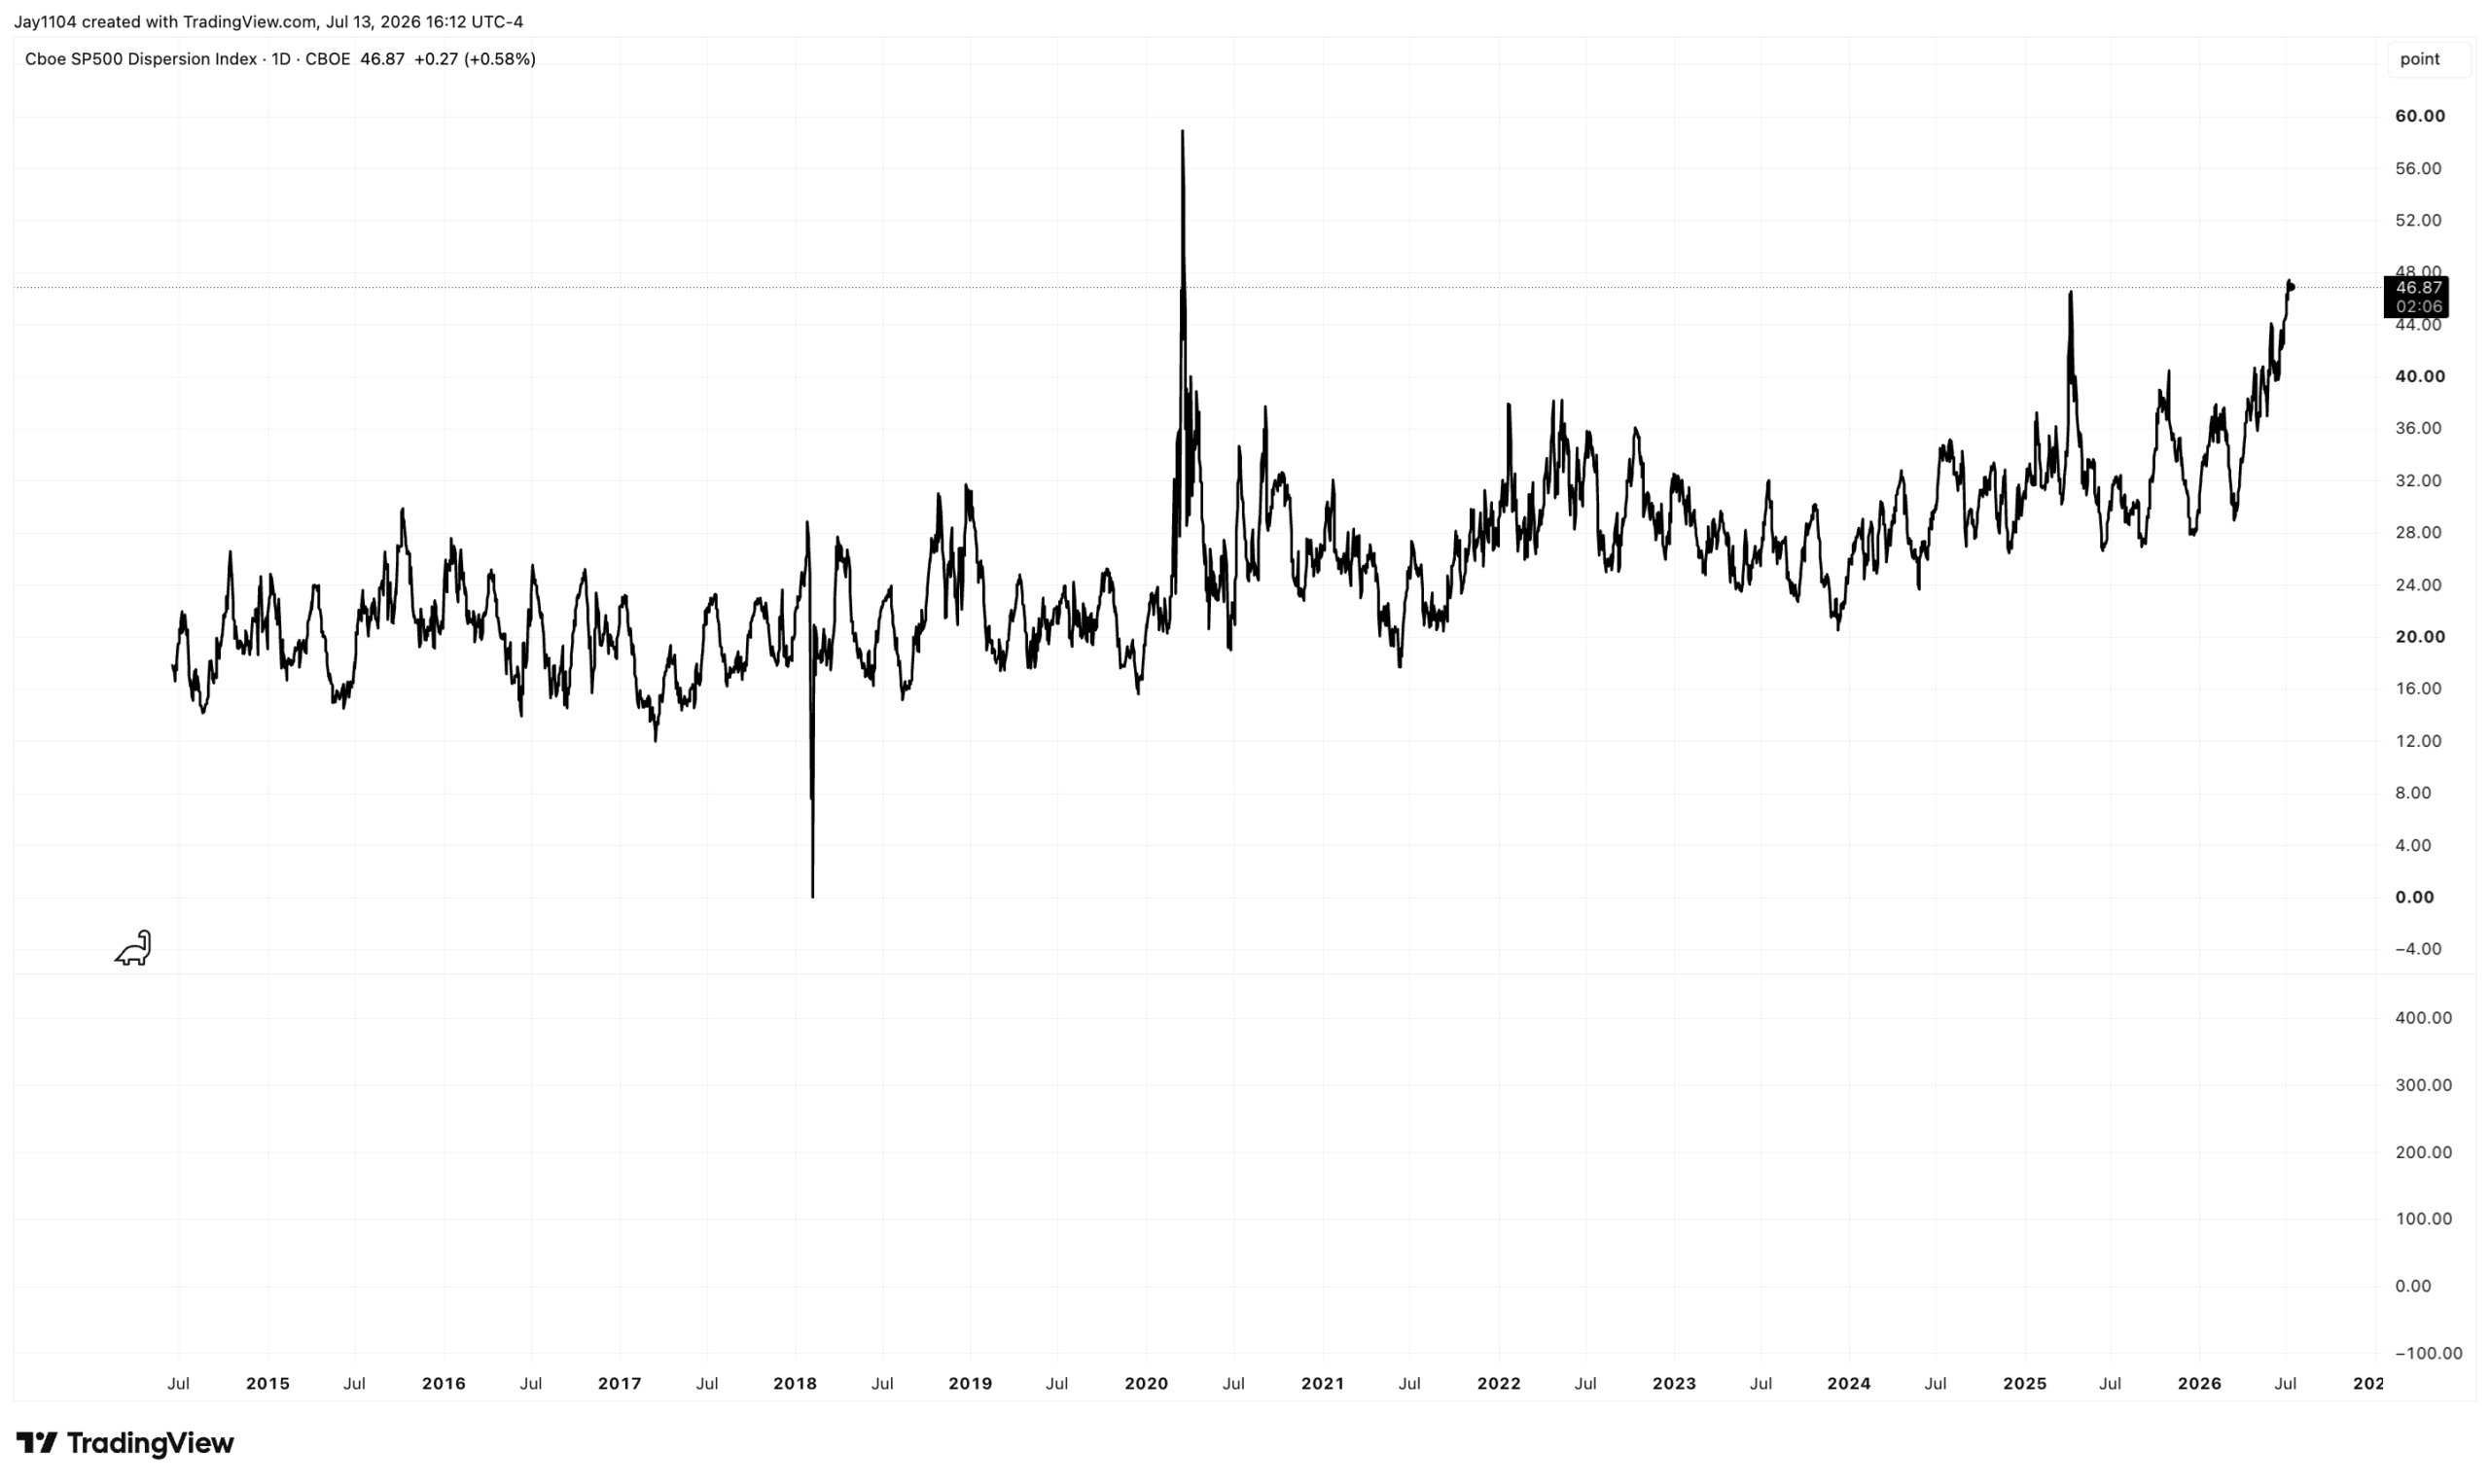
However, dispersion remains high, implied correlations remain low, and the market is still out of balance when comparing single-stock volatility with index-level volatility. As far as I can tell, the only time the dispersion index has been higher was in 2020. That means it is now even higher than it was during the April 2025 tariff tantrum.

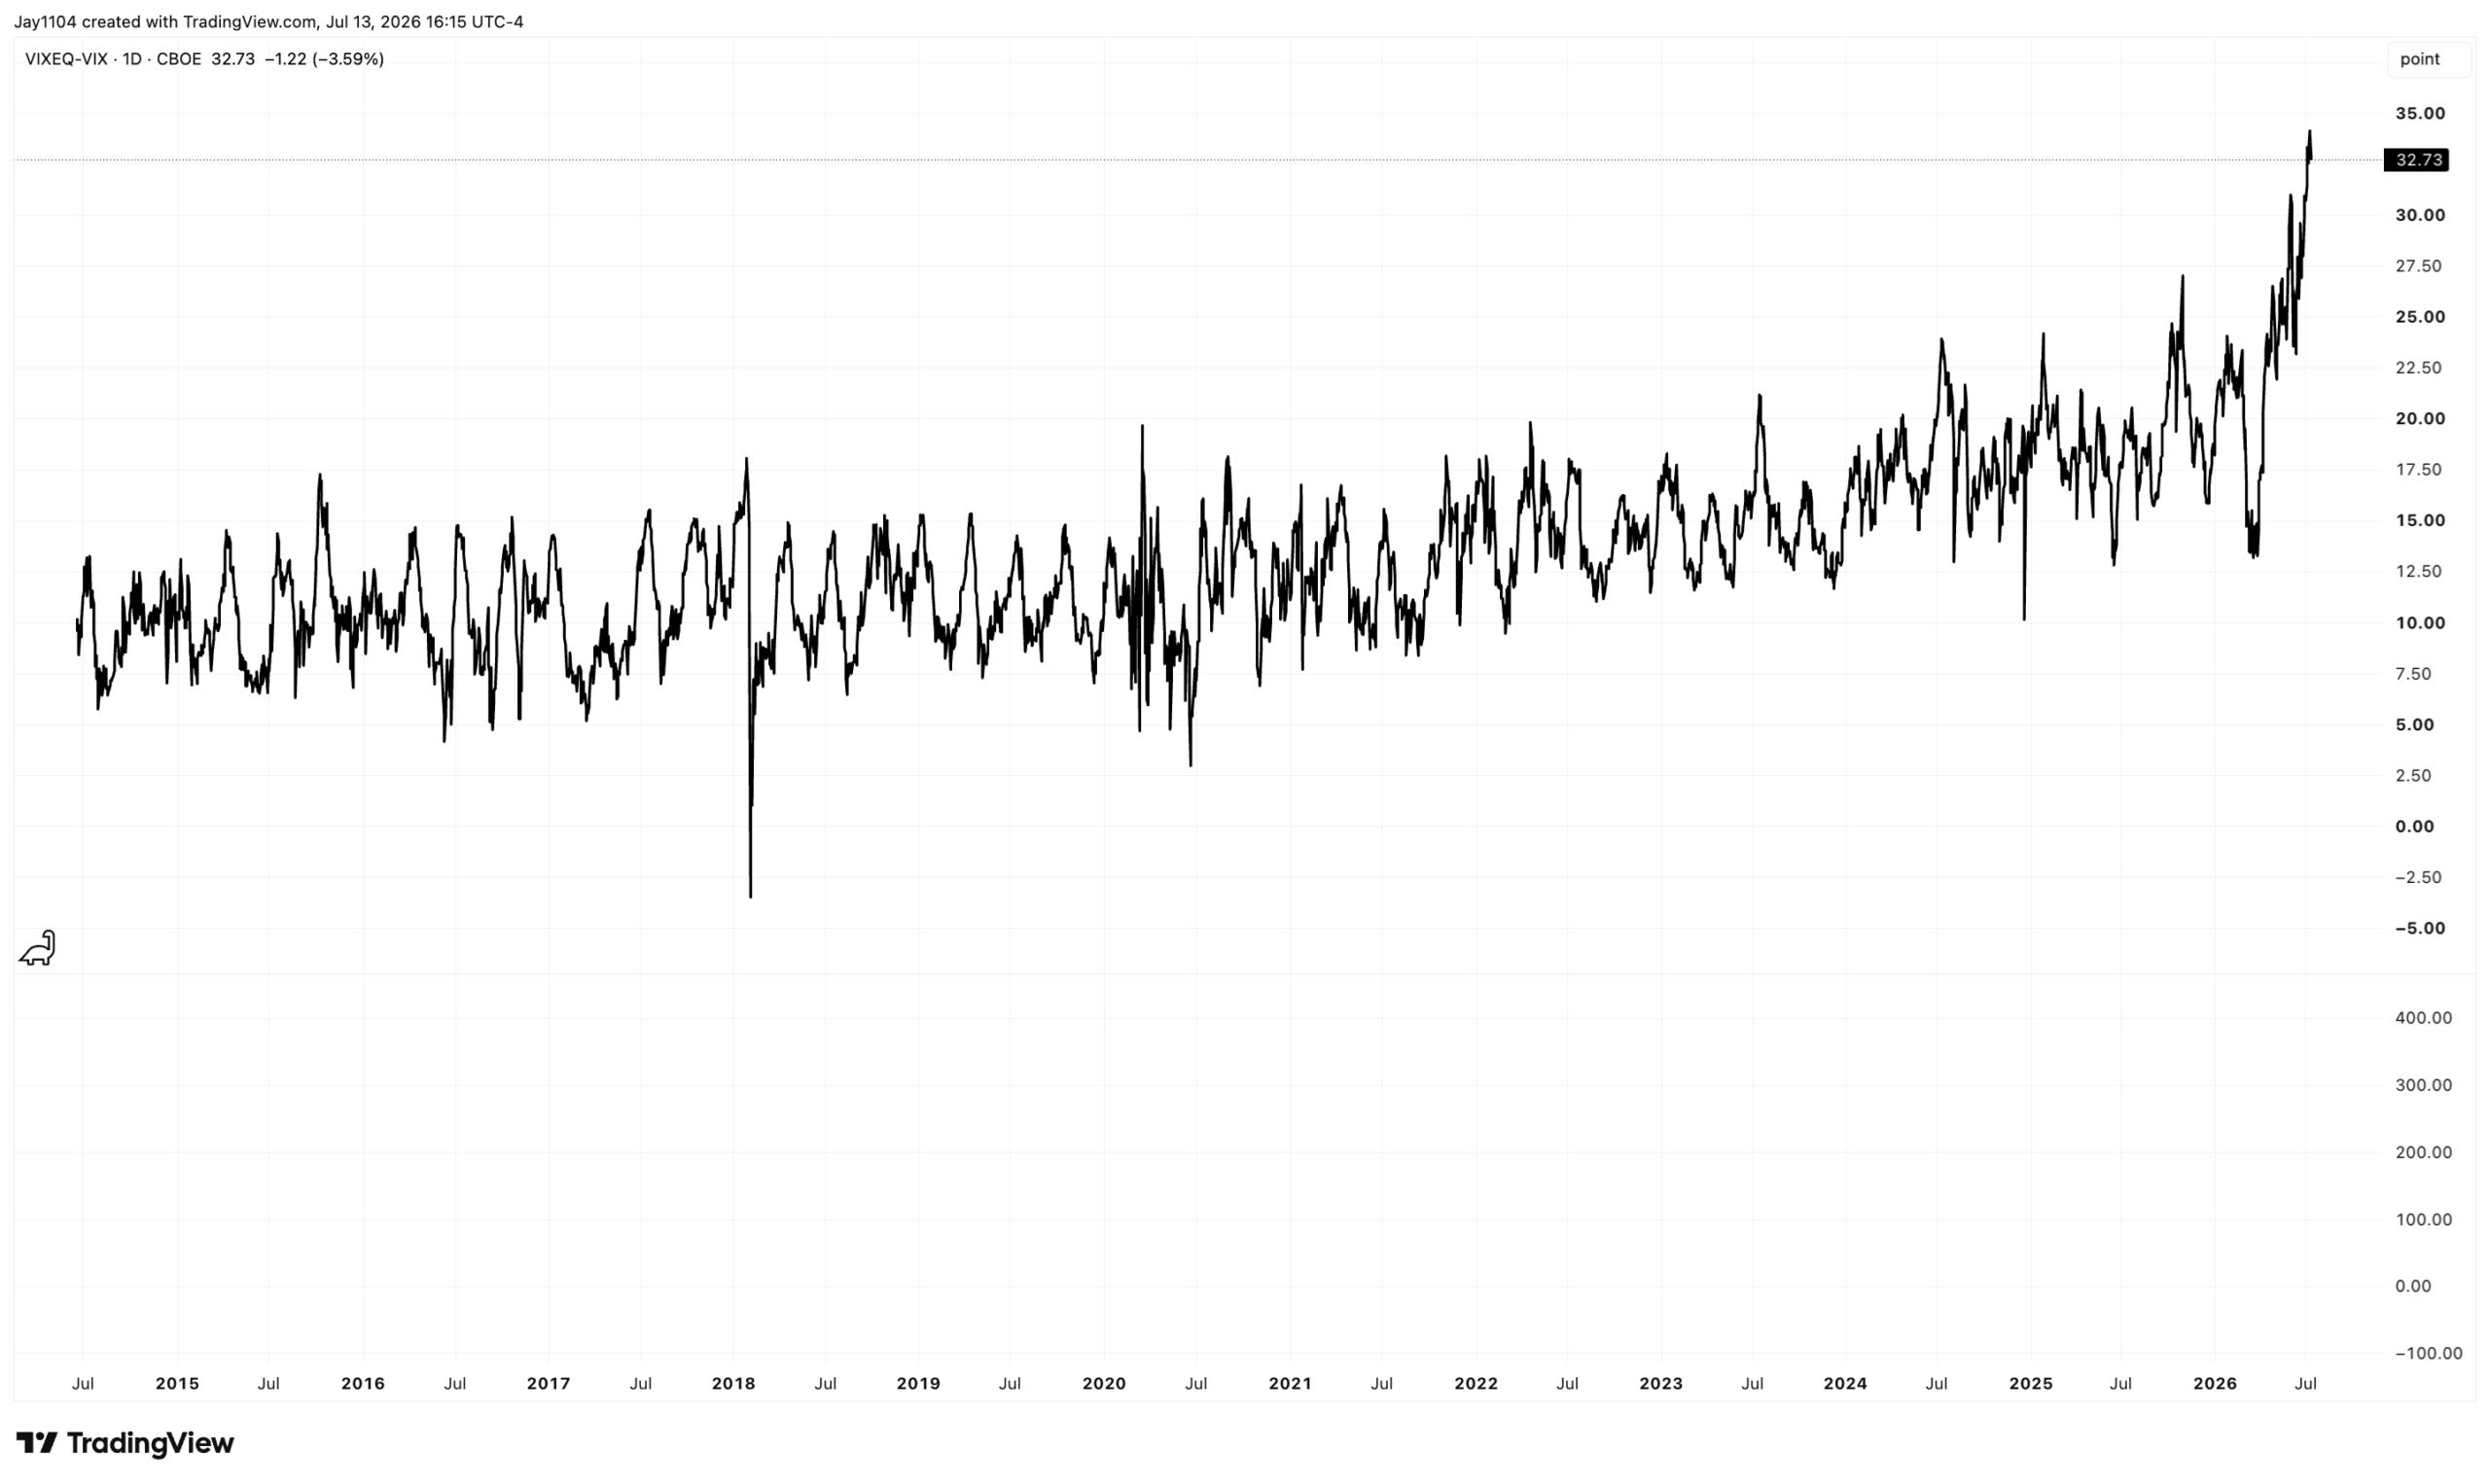
This is being driven by the wide wedge that still exists between single-stock and index-level implied volatility. The spread between VIXEQ and the VIX remains near the highs reached just days ago and is still well above 30.
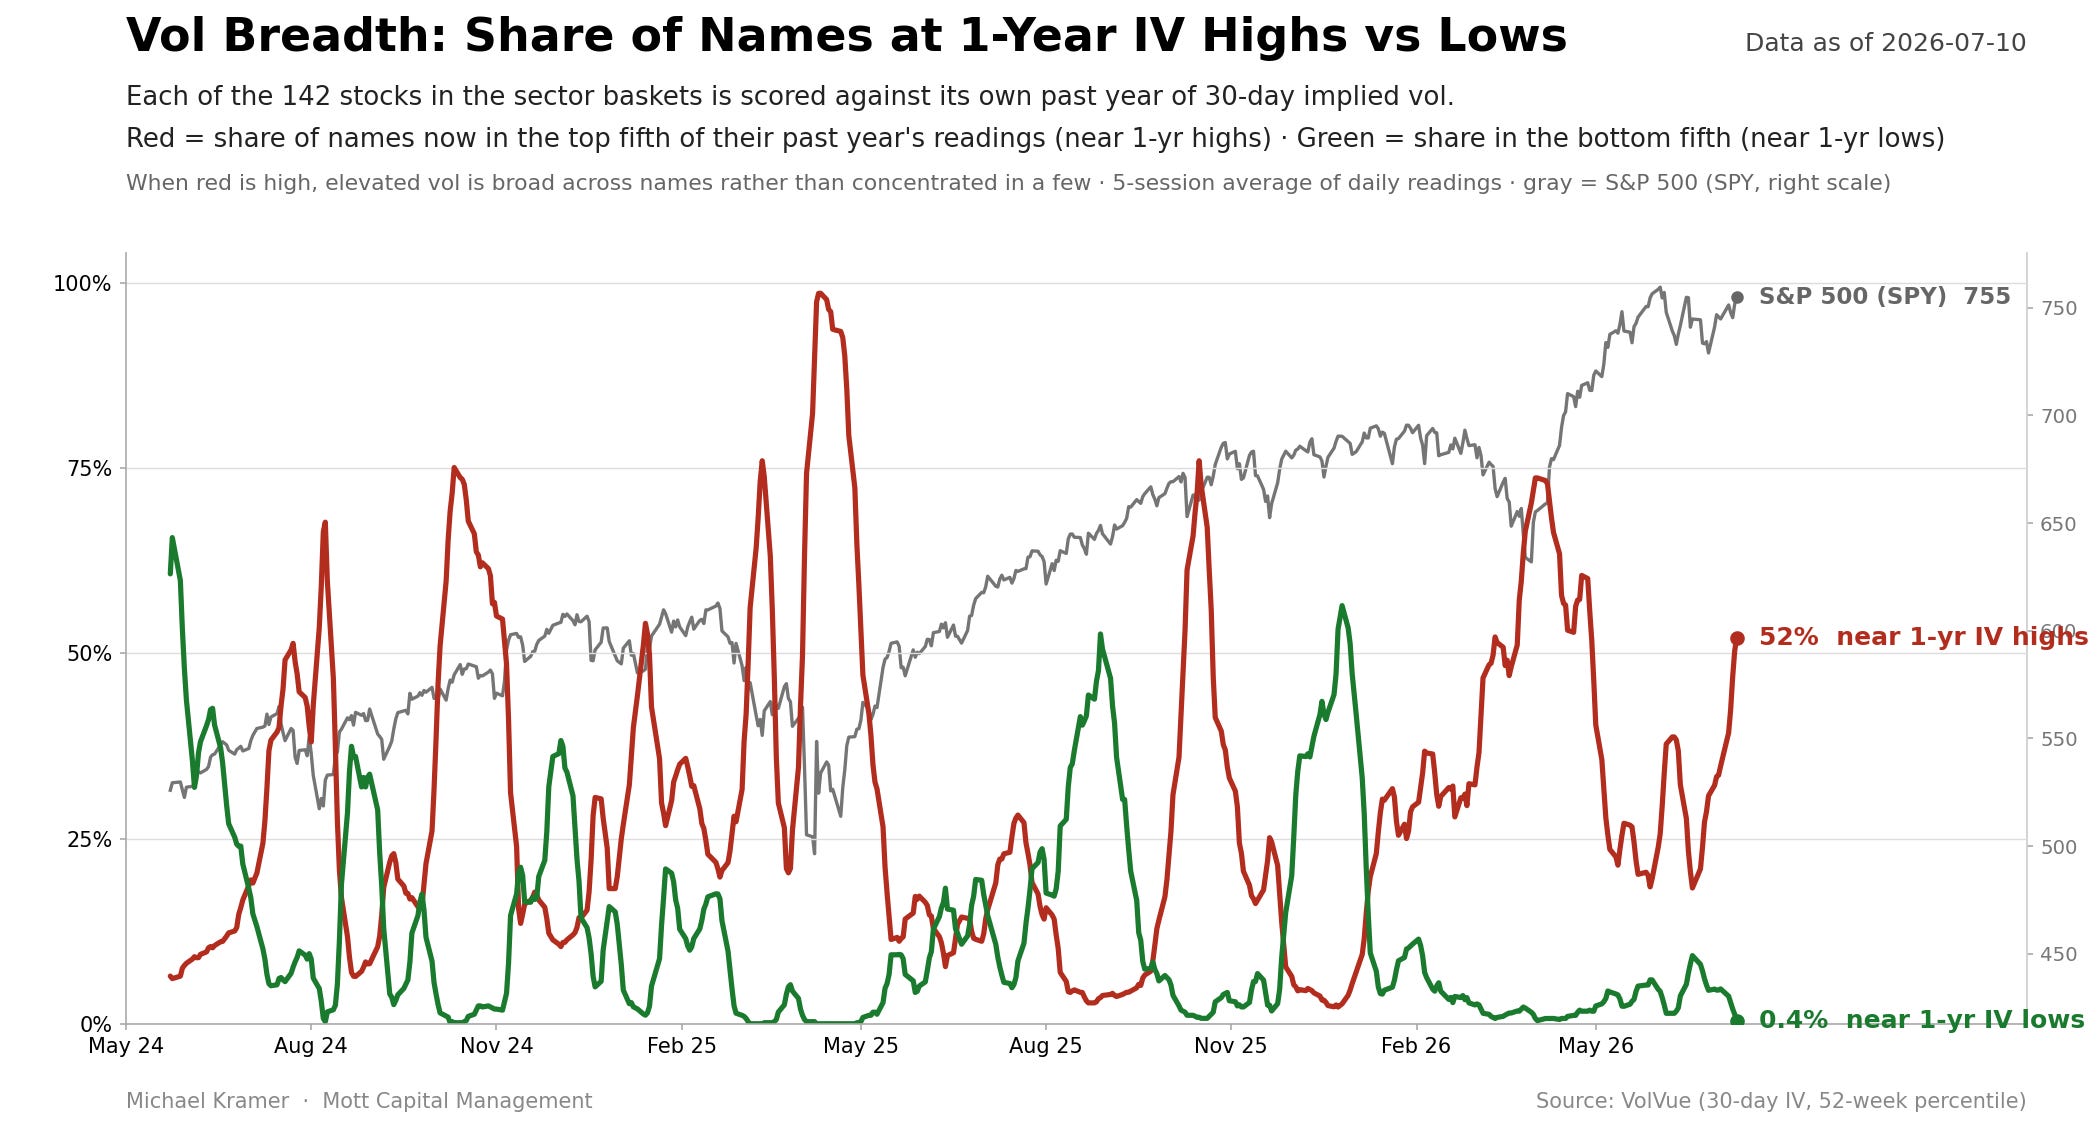
What is particularly interesting is that, of the 142 S&P 500 stocks I track in my sector breakdowns, 52% have implied volatility near their 52-week highs, while none are near their lows.
Typically, when implied volatility is this elevated across so many stocks, the S&P 500 is falling—not rising. That suggests IV is not necessarily increasing because the market fears individual stocks or views them as particularly risky. Instead, the market’s behavior appears consistent with a gamma-squeeze-like feedback loop.
In essence, VXSMH is at 64 not necessarily because the market is deeply concerned about semiconductor stocks or because investors are putting on massive hedges. Rather, realized volatility in SMH is already at 62.4. The large price movements in the underlying stocks are helping to drive implied volatility higher, creating dispersion and distortions across the market.
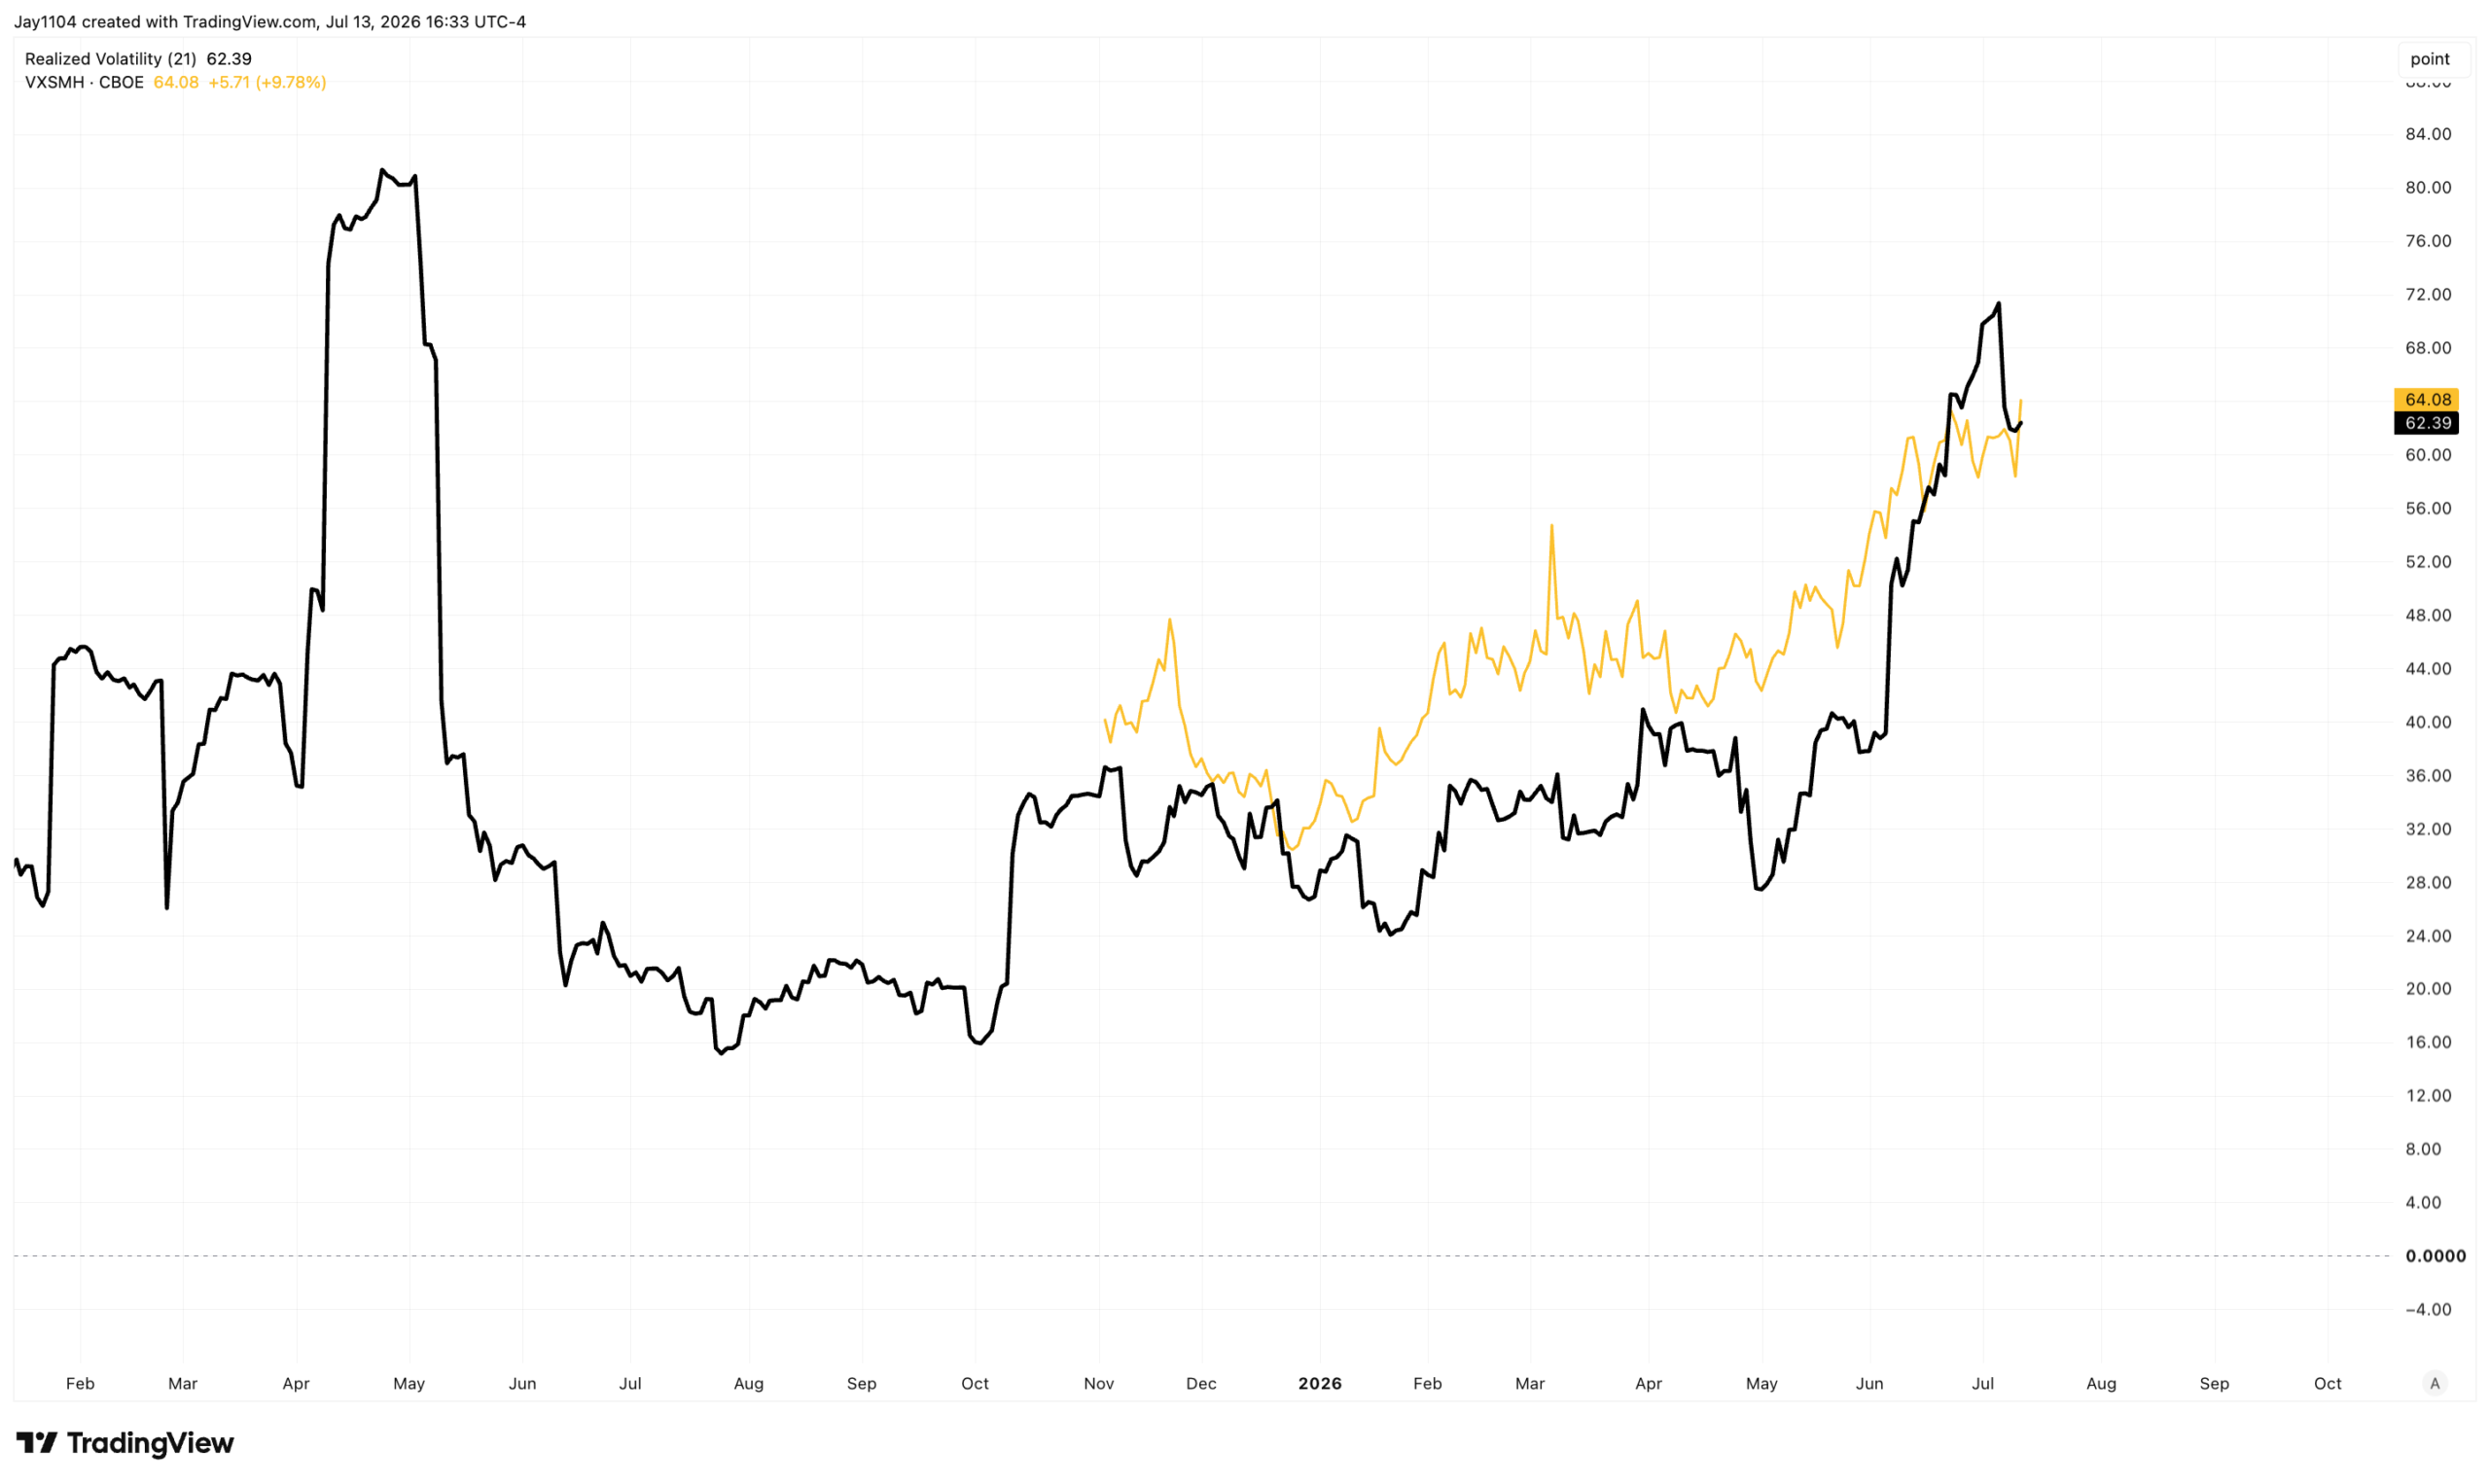
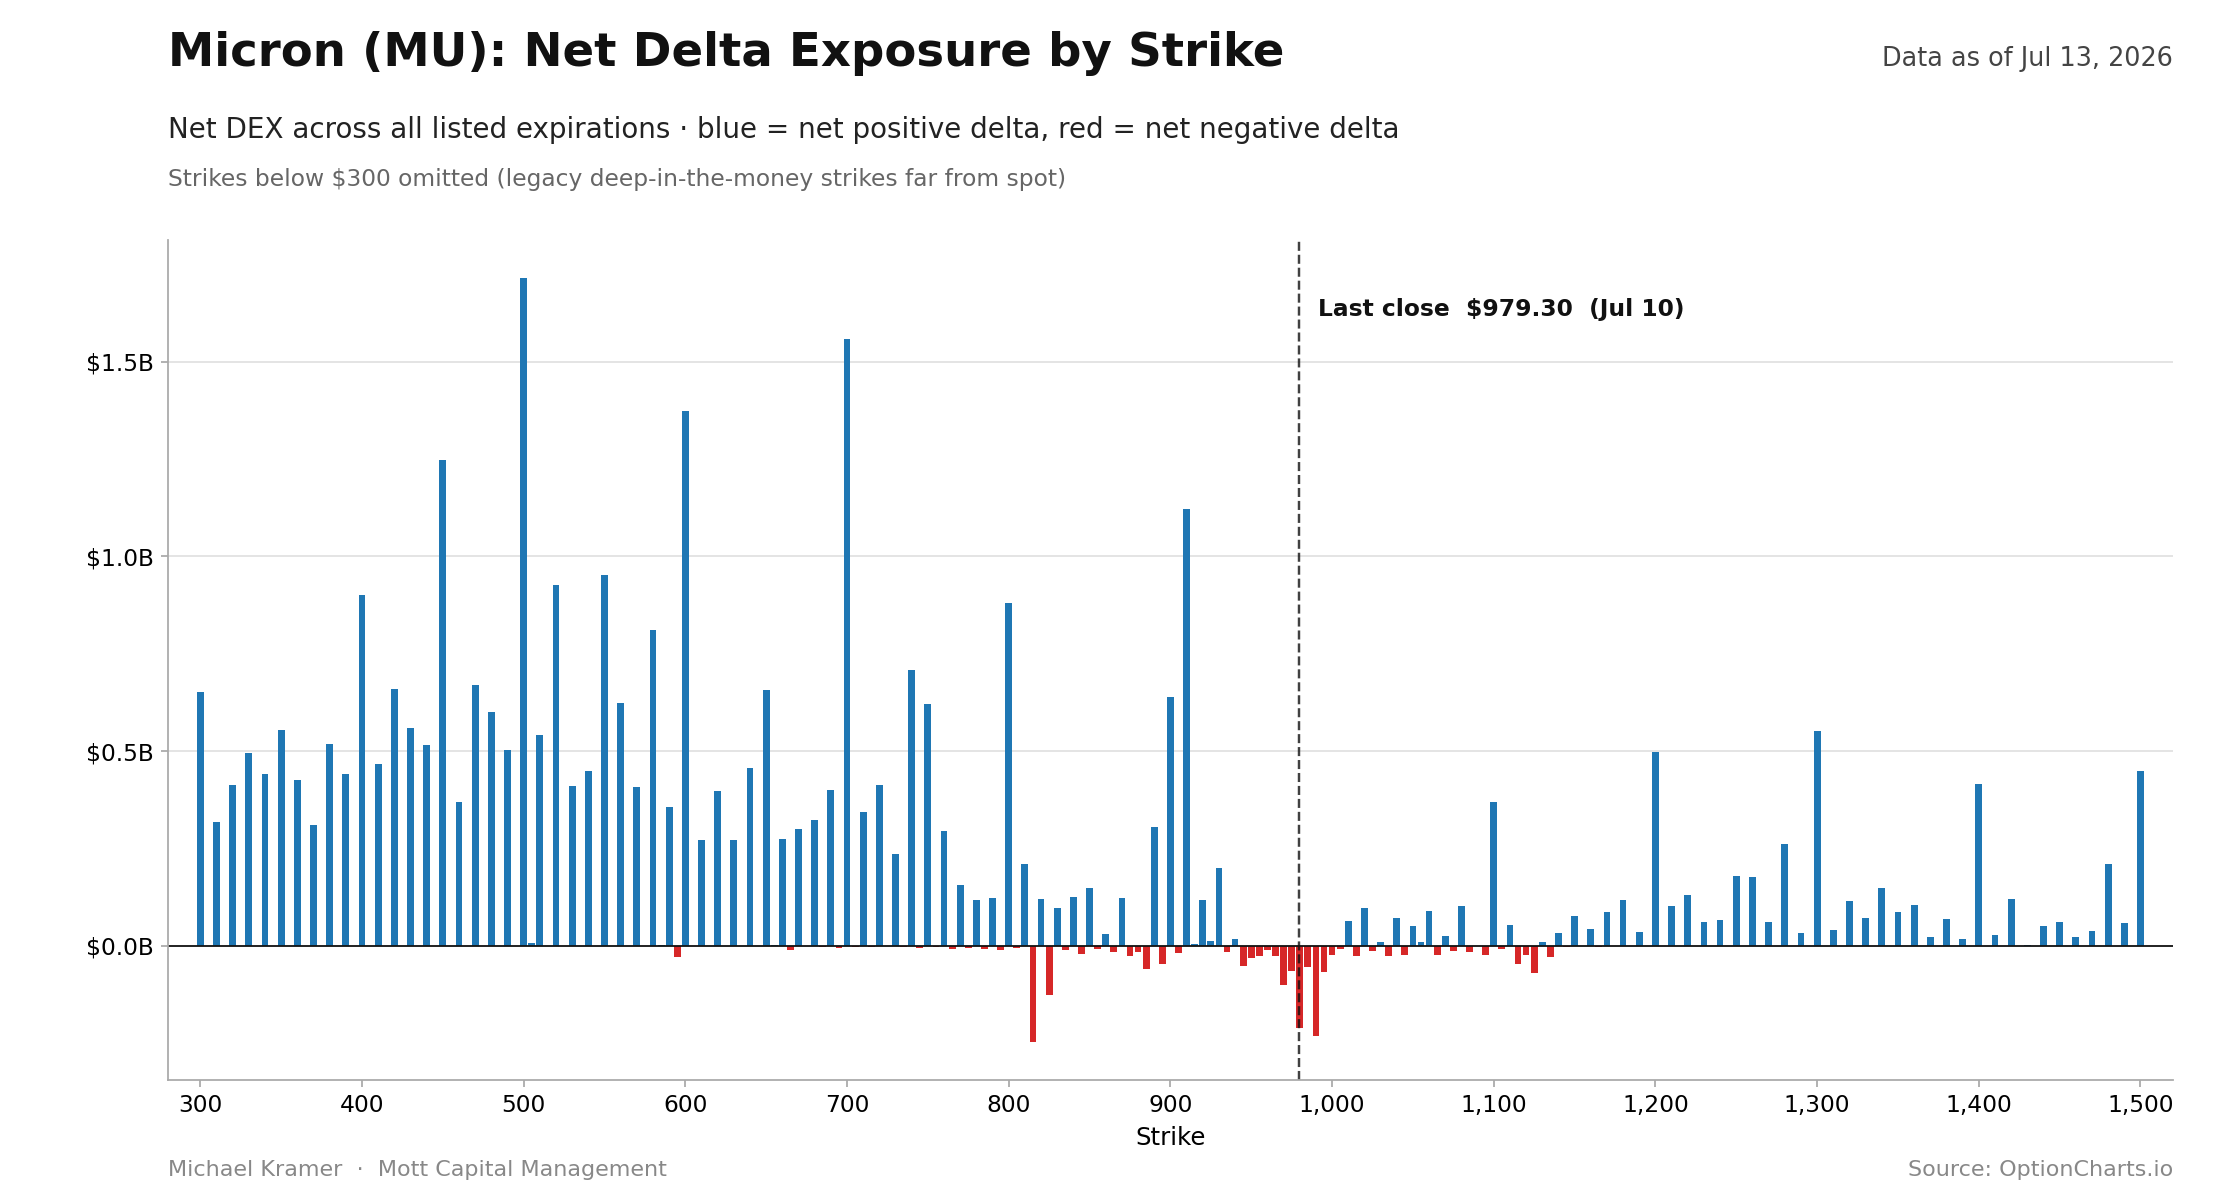
Semiconductor stocks appear to be caught in a gamma squeeze, much like Micron was. With these stocks moving 3% to 4% a day, realized volatility will remain high, and implied volatility will likely remain elevated as a result.
The problem is that stocks do not move 3% to 4% every day forever. Eventually, realized volatility will begin to fall, likely pulling implied volatility lower with it. Call positioning heavily outweighs put positioning in many of these names, including Micron. As IV falls and call premiums decay, the associated delta exposure may also begin to unwind.
Ultimately, this trade will end. How it ends—and what that unwind looks like—are the real questions. If it has been driven largely by options-related mania, there is a meaningful risk that the ending will not be orderly.
-Mike
Glossary by ChatGPT
Call Positioning — The concentration of outstanding call option exposure that can influence hedging activity and stock price movements.
Delta Exposure — The sensitivity of an option’s value to changes in the underlying stock price, often driving dealer hedging activity.
Dispersion — The degree to which individual stock returns diverge from overall index performance.
Gamma Squeeze — A market dynamic in which dealer hedging of option positions amplifies price movements, potentially creating self-reinforcing rallies or declines.
Implied Correlation — The market’s expectation of how closely stocks within an index will move together, derived from options prices.
Implied Volatility (IV) — The market’s expectation of future price volatility as reflected in option prices.
Realized Volatility — The actual historical volatility observed in an asset’s price over a specific period.
S&P 500 — A market-capitalization-weighted index of 500 leading U.S. publicly traded companies, widely used as a benchmark for the U.S. equity market.
VIX — The CBOE Volatility Index, which measures the market’s expectation of 30-day volatility for the S&P 500 using index options.
VIXEQ — The CBOE S&P 500 Equal Weight Volatility Index, which measures implied volatility using options on the equal-weighted S&P 500 Index.
VXSMH — The implied volatility index derived from options on the VanEck Semiconductor ETF (SMH), reflecting expected volatility for the semiconductor sector.
Disclosure
This report contains independent commentary to be used for informational and educational purposes only. Michael Kramer is a member and investment adviser representative with Mott Capital Management. Mr. Kramer is not affiliated with this company and does not serve on the board of any related company that issued this stock. All opinions and analyses presented by Michael Kramer in this analysis or market report are solely Michael Kramer’s views. Readers should not treat any opinion, viewpoint, or prediction expressed by Michael Kramer as a specific solicitation or recommendation to buy or sell a particular security or follow a particular strategy. Michael Kramer’s analyses are based upon information and independent research that he considers reliable, but neither Michael Kramer nor Mott Capital Management guarantees its completeness or accuracy, and it should not be relied upon as such. Michael Kramer is not under any obligation to update or correct any information presented in his analyses. Mr. Kramer’s statements, guidance, and opinions are subject to change without notice. Past performance is not indicative of future results. Neither Michael Kramer nor Mott Capital Management guarantees any specific outcome or profit. You should be aware of the real risk of loss in following any strategy or investment commentary presented in this analysis. Strategies or investments discussed may fluctuate in price or value. Investments or strategies mentioned in this analysis may not be suitable for you. This material does not consider your particular investment objectives, financial situation, or needs and is not intended as a recommendation appropriate for you. You must make an independent decision regarding investments or strategies in this analysis. Upon request, the advisor will provide a list of all recommendations made during the past twelve months. Before acting on information in this analysis, you should consider whether it is suitable for your circumstances and strongly consider seeking advice from your own financial or investment adviser to determine the suitability of any investment.