
Historically Low Realized Volatility Raises Warning of Risk-Off Shock

In today’s video, following the daily write-up on the euro, I review the euro chart and highlight that U.S. equity markets are showing unusual distortions, with volatility indicators rising even as major indexes remain supported by mega-cap stocks, while three-month realized volatility sits at historically significant levels.
DAILY WRITE-UP
The EUR/USD has been making higher lows since early August, forming a bullish technical pattern known as an ascending triangle. Additionally, the relative strength index has started to turn higher, signaling a potential shift in momentum.
With the ECB apparently on hold and the market no longer pricing in further rate cuts from the central bank, the EUR/USD may finally be ready to break above resistance — and the move could be significant. Measuring from the August 1 low to resistance at 1.17, the pair could rally to 1.21, and potentially as high as 1.23.
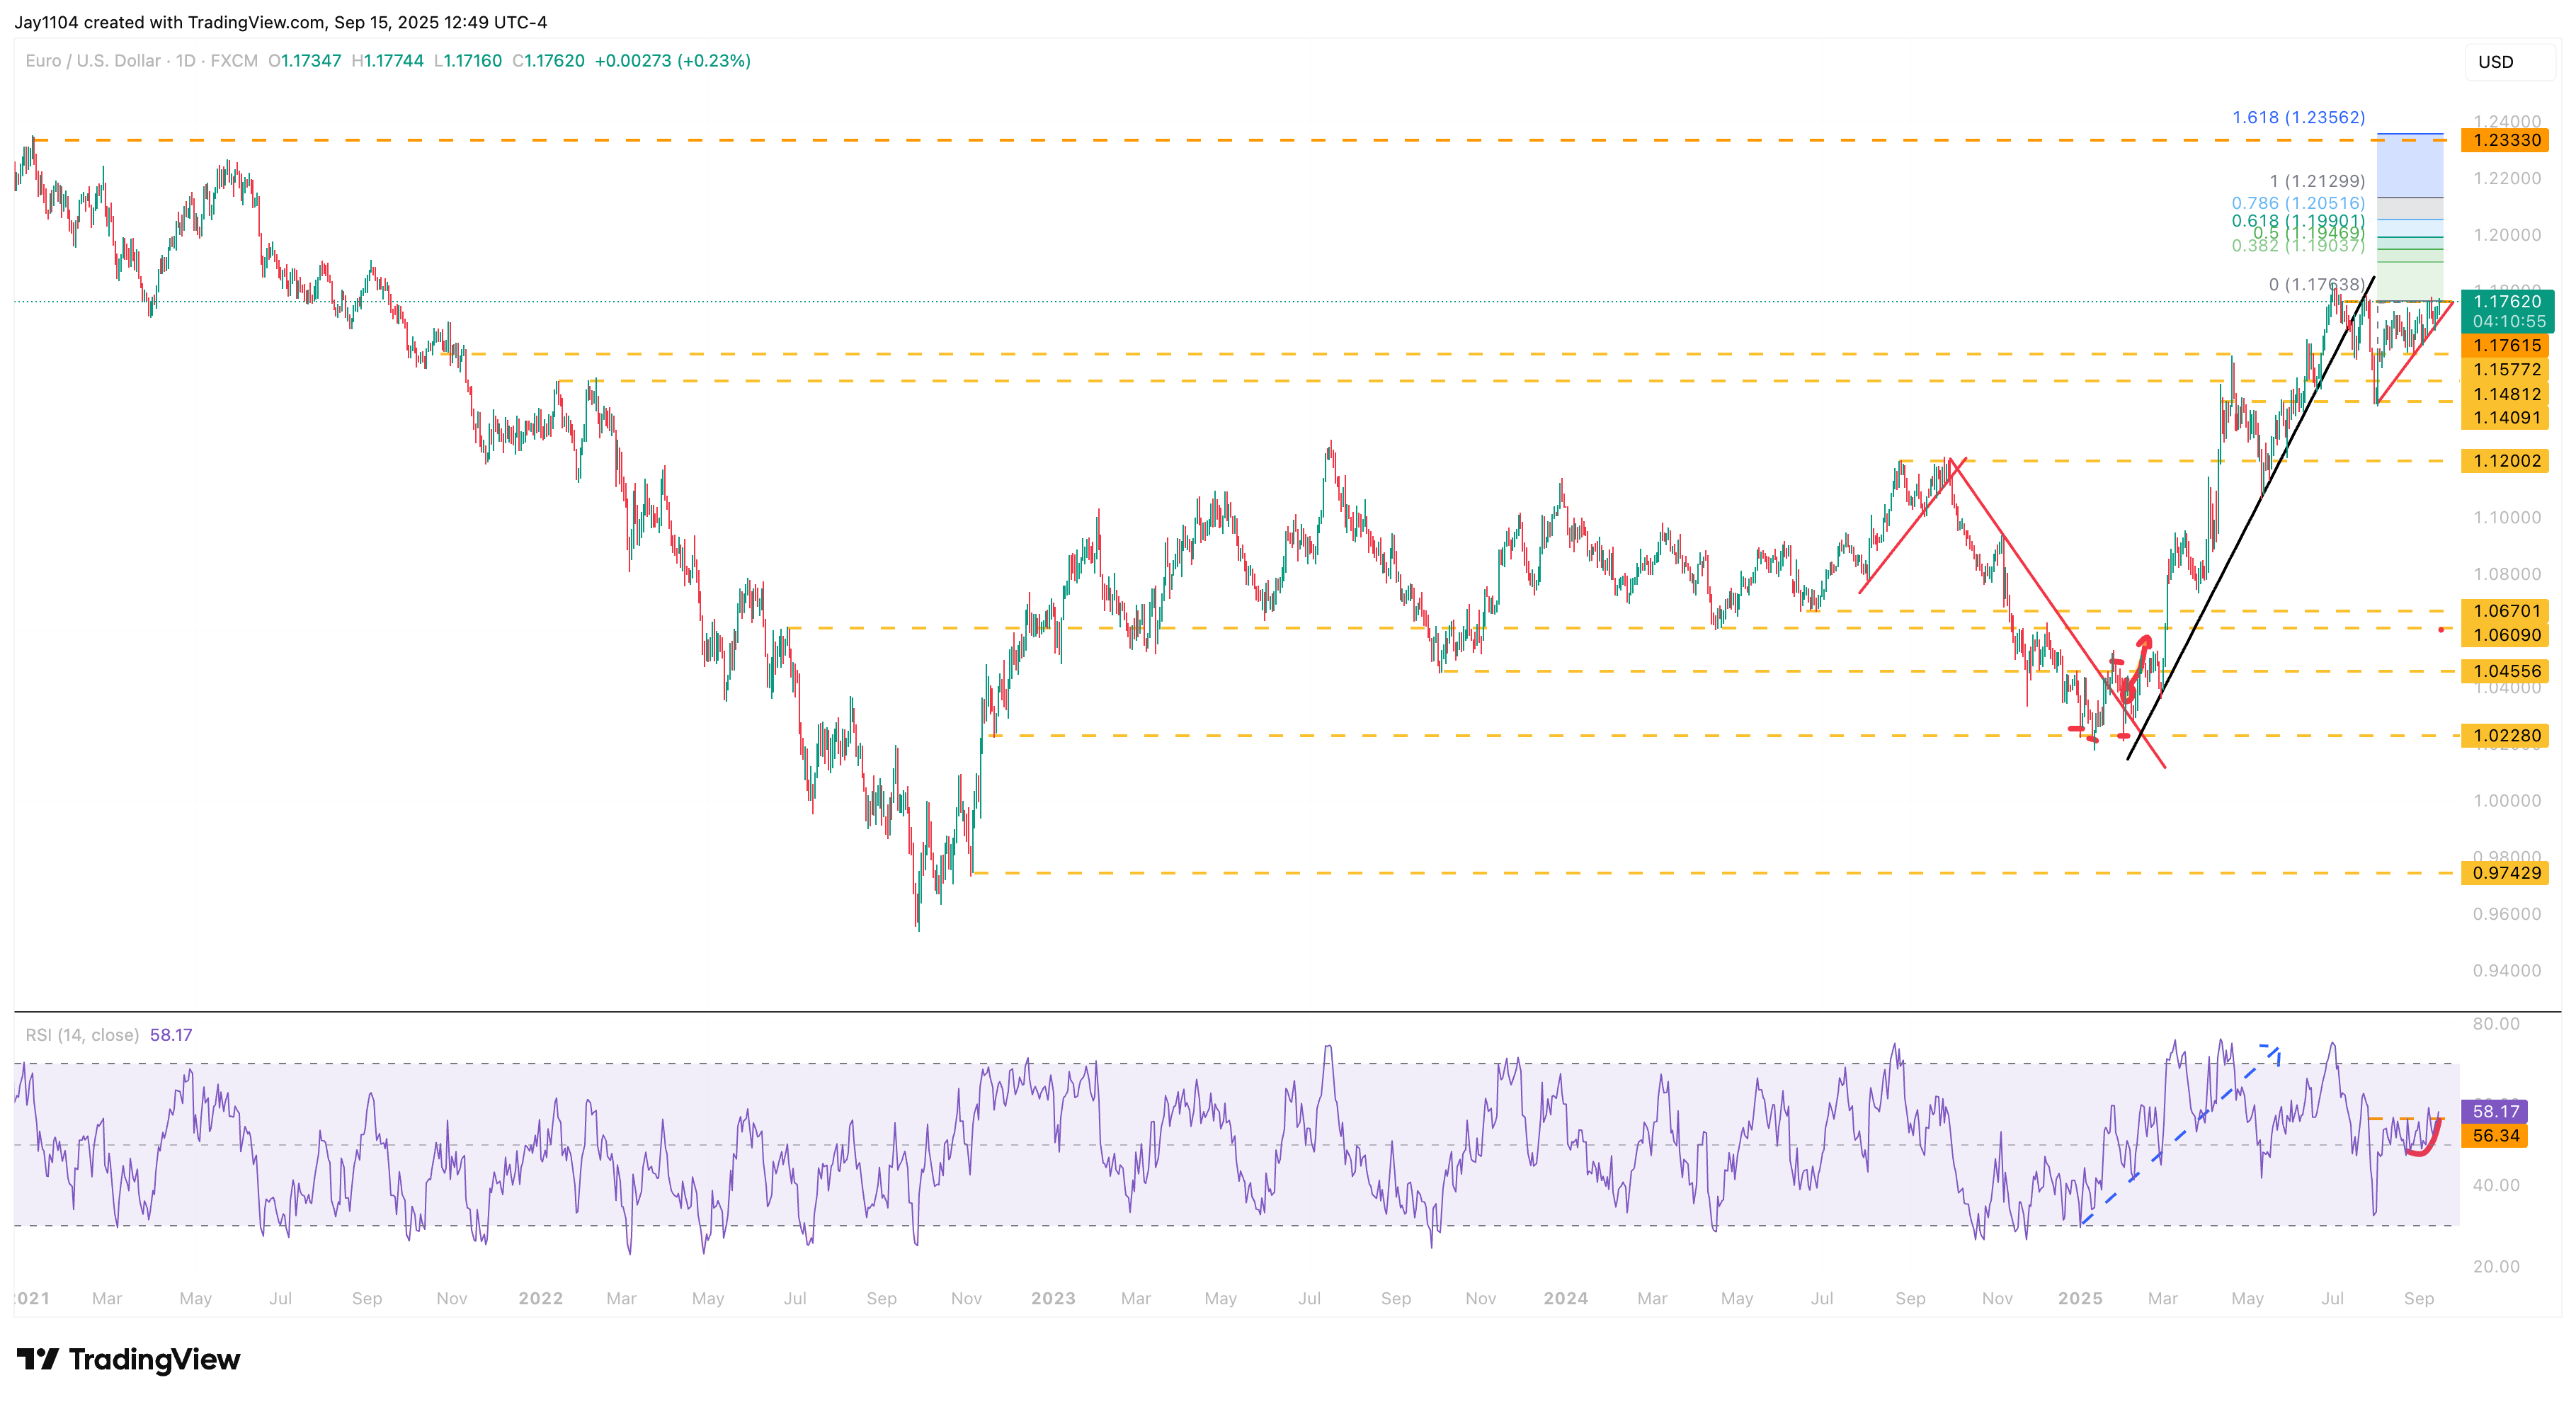
Of course, much will depend on whether the Fed delivers a 25-basis-point cut on Wednesday, September 17, and signals additional cuts for 2025 and 2026 in the Summary of Economic Projections.
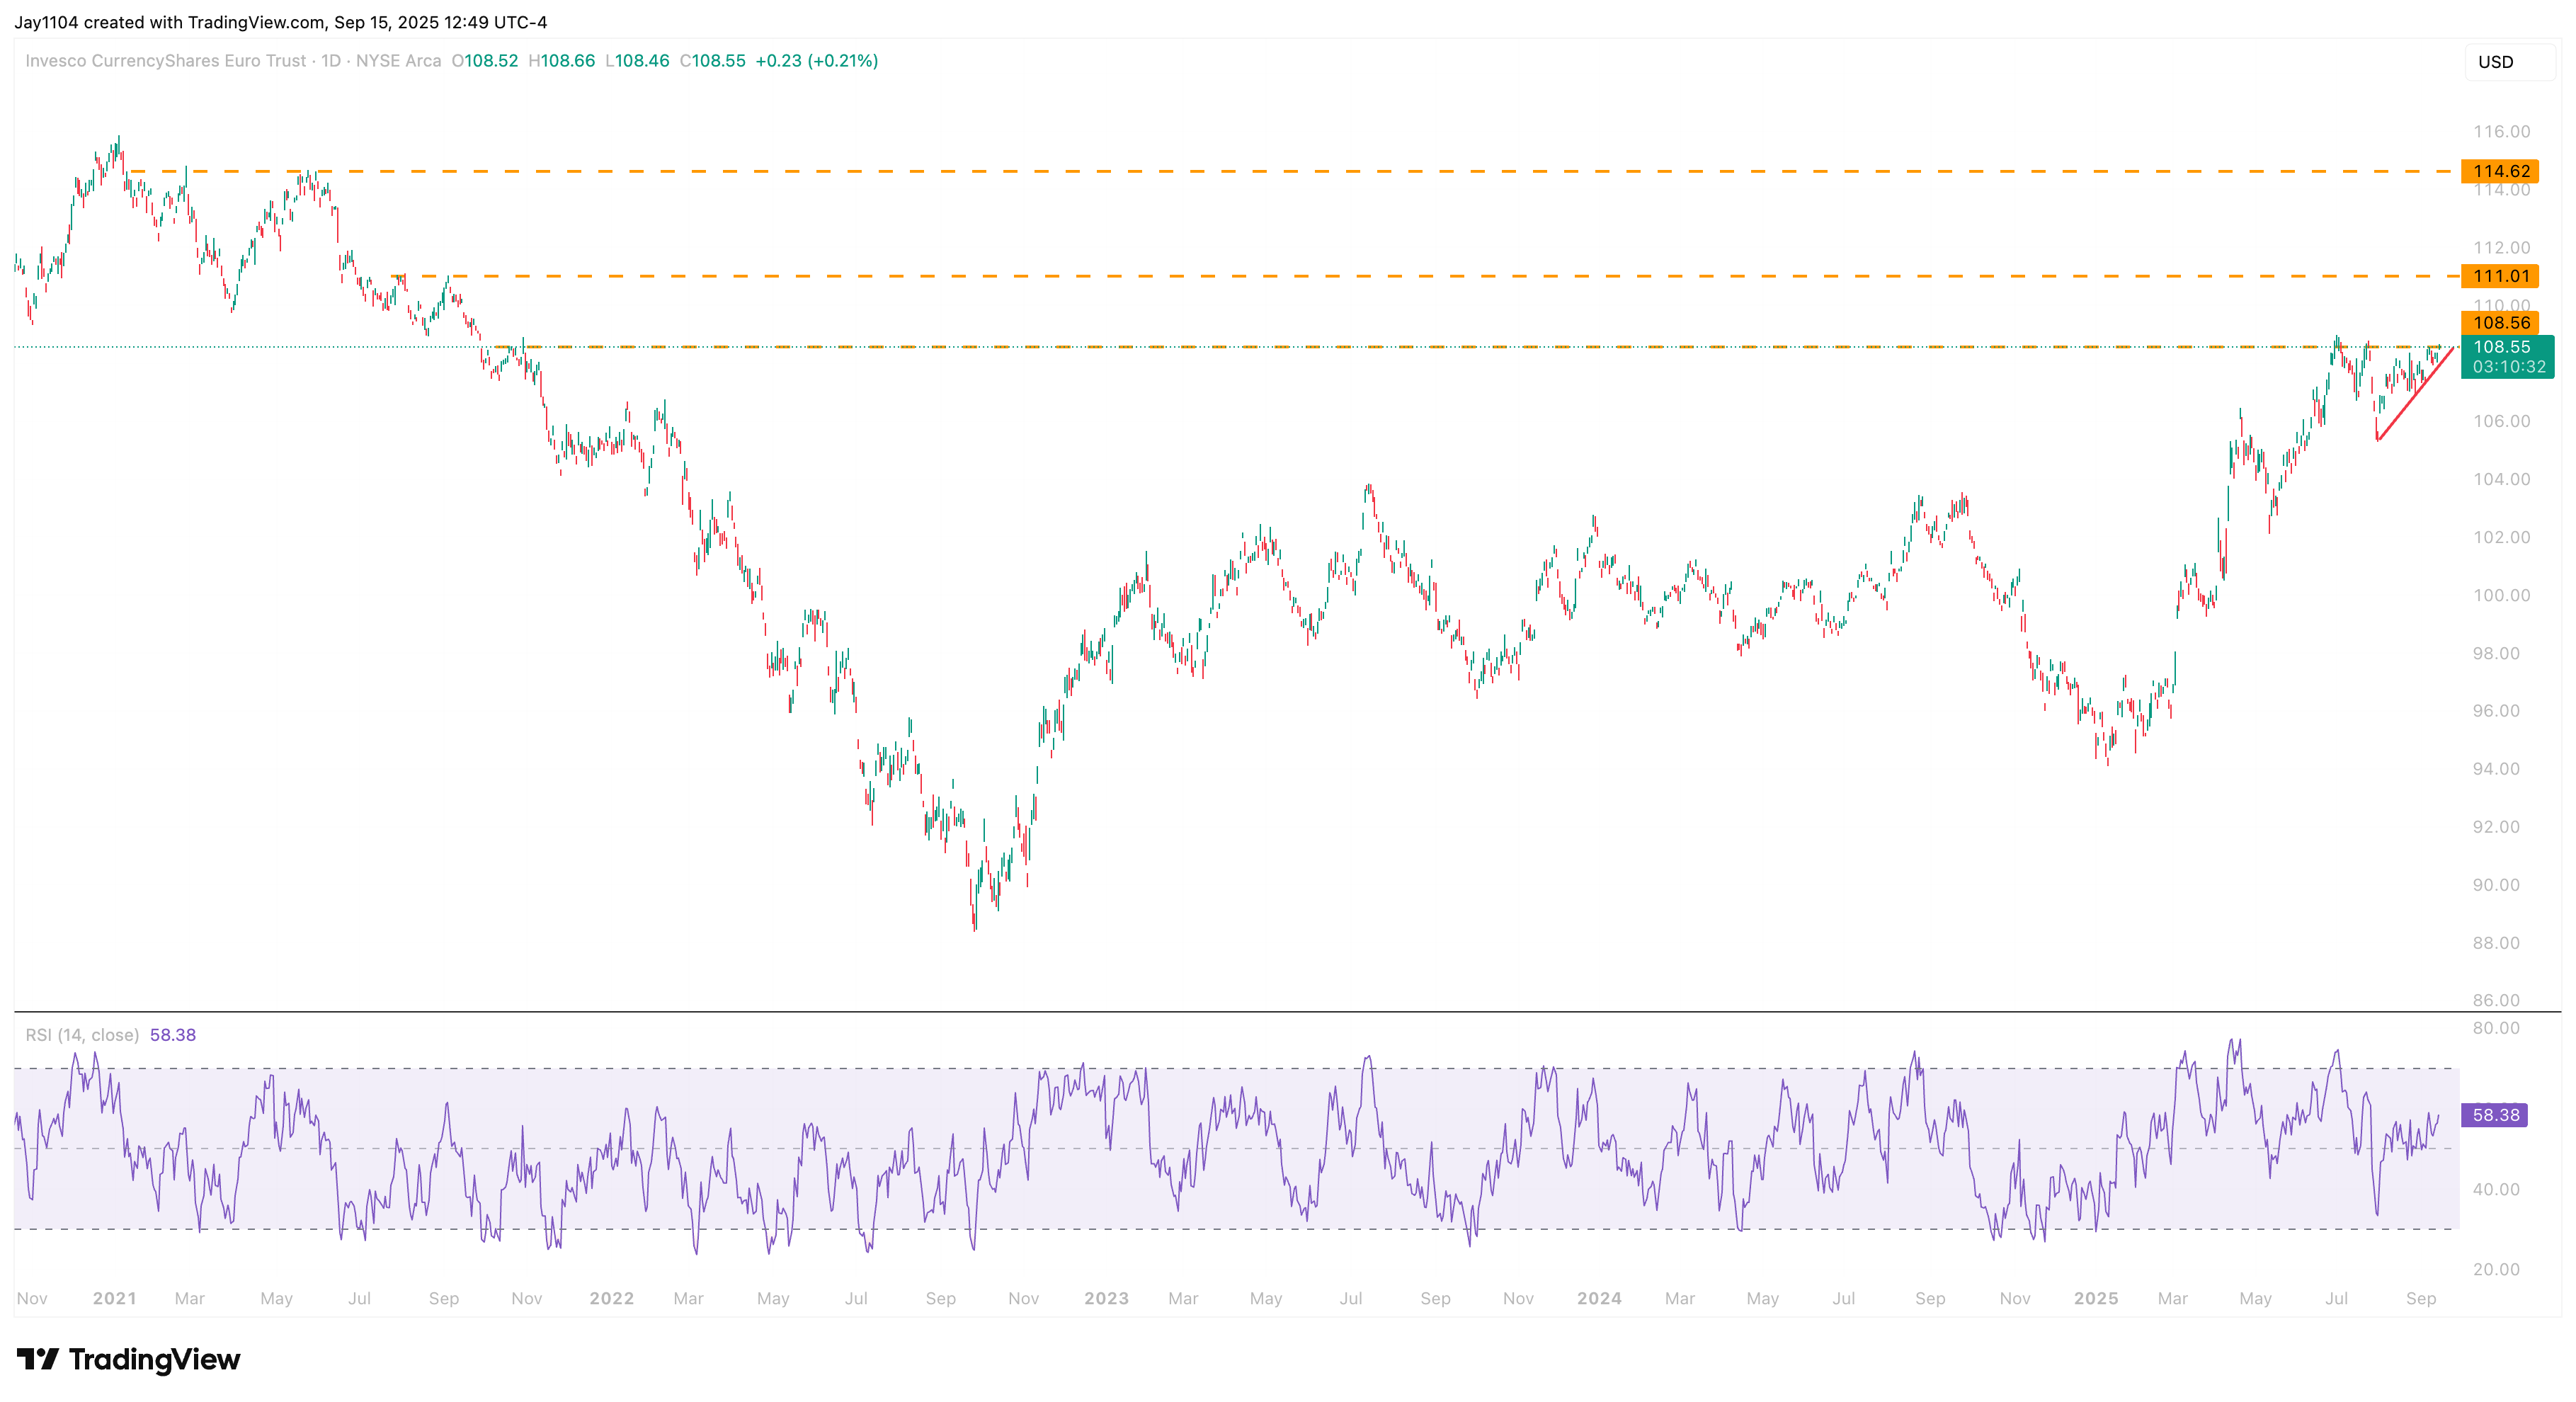
The FXE (FXE), a tracking ETF for the Euro, exhibits the same pattern, with potential for the FXE to rise to $111 or as high as $114.
At least on the surface, the euro appears to be a key beneficiary of a dovish Fed, now that the ECB has likely finished cutting rates.
-Mike