
Fed Rate Hikes Could Tighten Financial Conditions and Pressure Markets

Please remember to subscribe to my Substack to receive this free daily commentary—which I work very hard to produce—directly in your inbox.
The Fed meets Wednesday, and Fed funds futures and overnight index swaps expect no change in policy. Swaps price about a 42% chance of a hike, but with little new data before the meeting, the next chance for a hike looks like September, with possibly another one or two after that. Looking around the market, though, it is pricing in more action down the road.
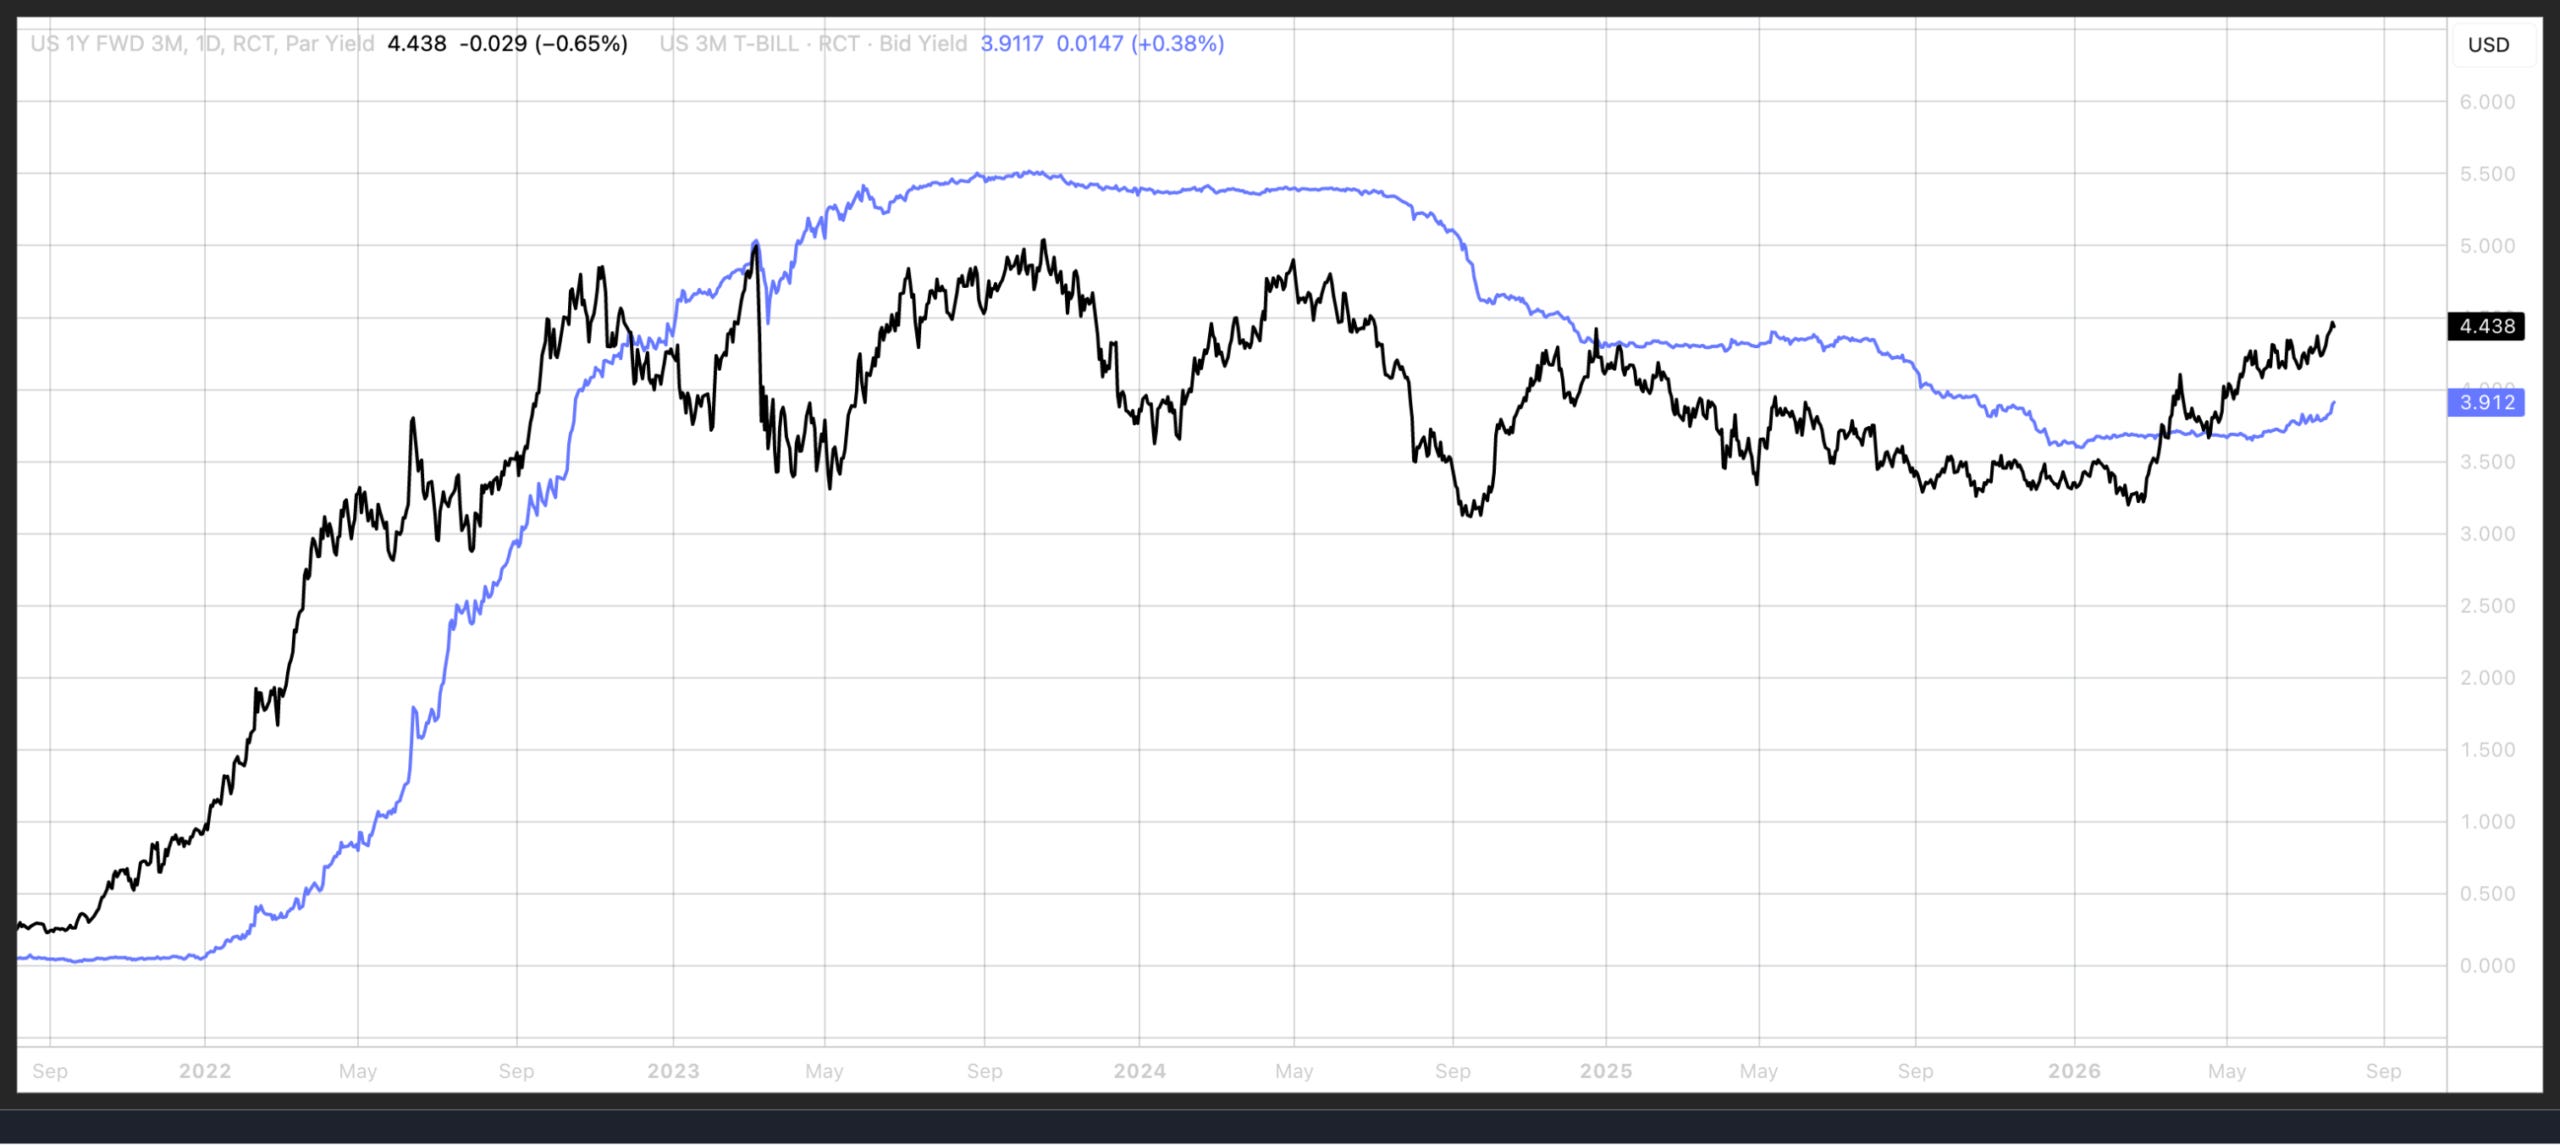
The 3-month Treasury bill has risen about 25 basis points off its year-start low, and its 12-month forward rate is pricing in another 50 basis points above that level. That implies as many as three rate hikes over the next 12 months, with the bill’s rise as the first and the forward carrying the other two.
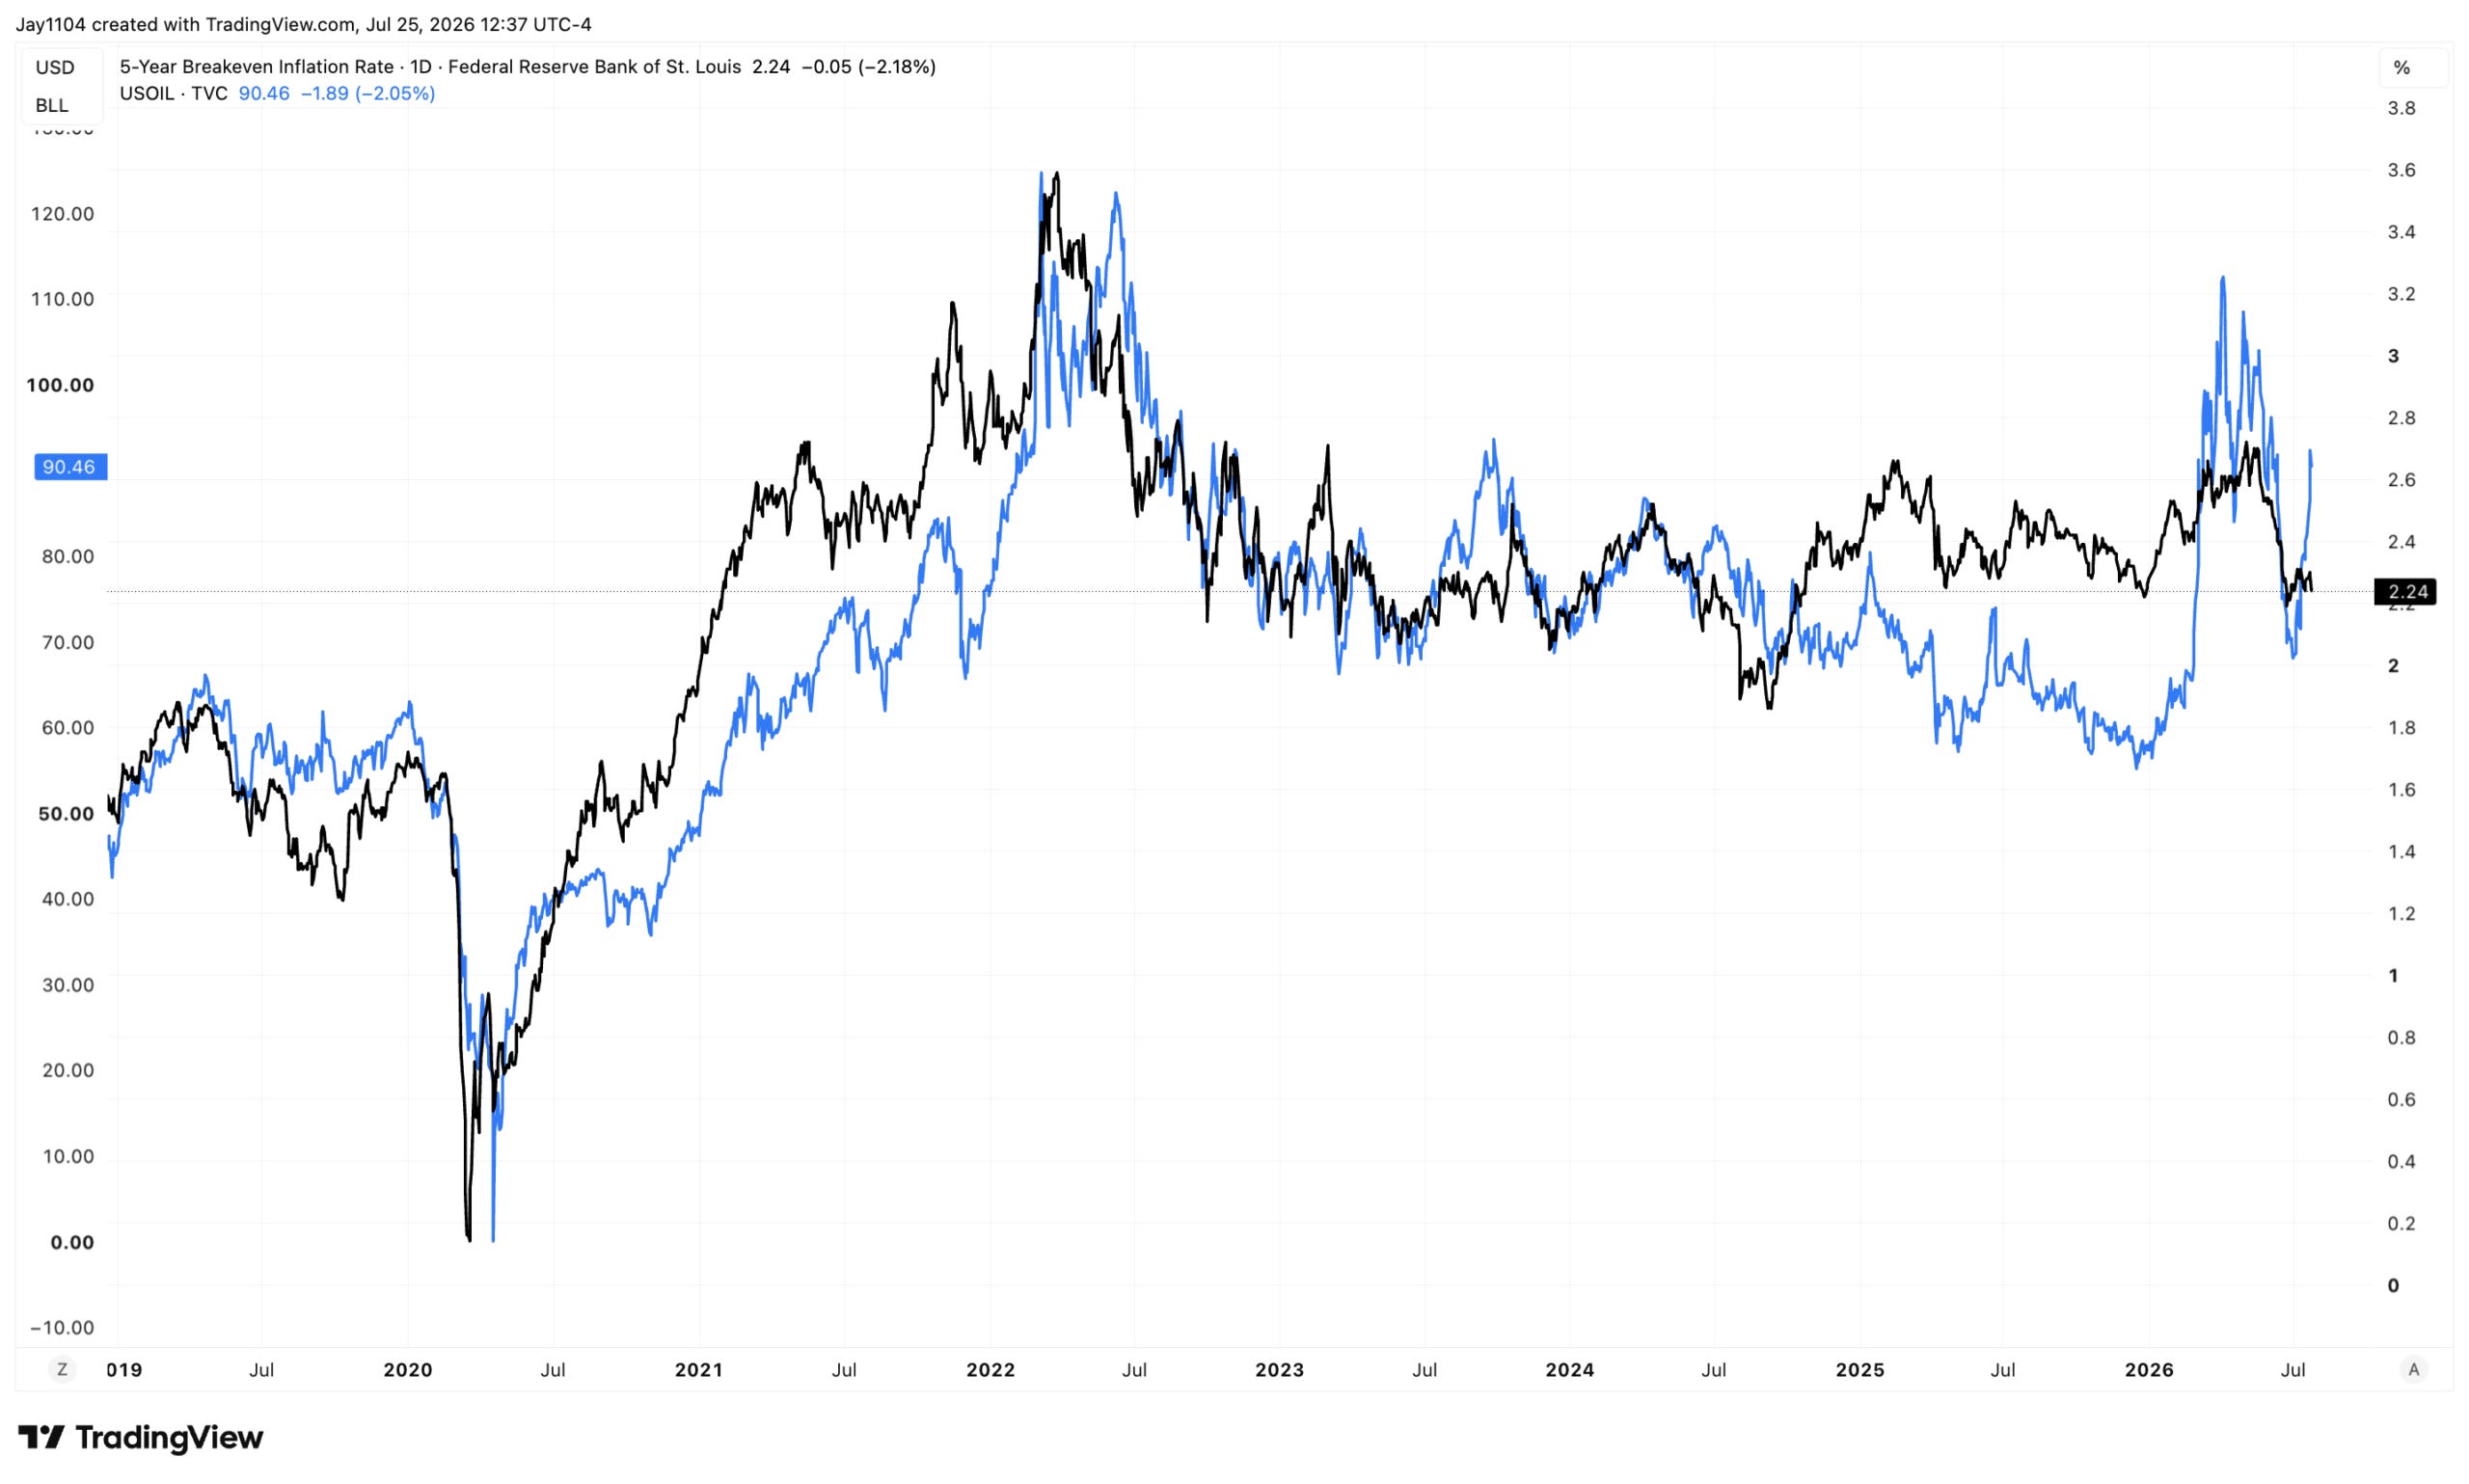
Real yields have risen sharply as well, with the 5-year real rate around 2.16% and the 10-year at 2.40%. The telling part is that the 5-year breakeven, around 2.24%, has not moved up despite oil surging from around $70 a barrel to $89 since the beginning of July. Breakevens rose on the first oil spike, but not this time. That could be because the market is pricing in a Fed that actually responds, tightening financial conditions itself in expectation of the hikes.
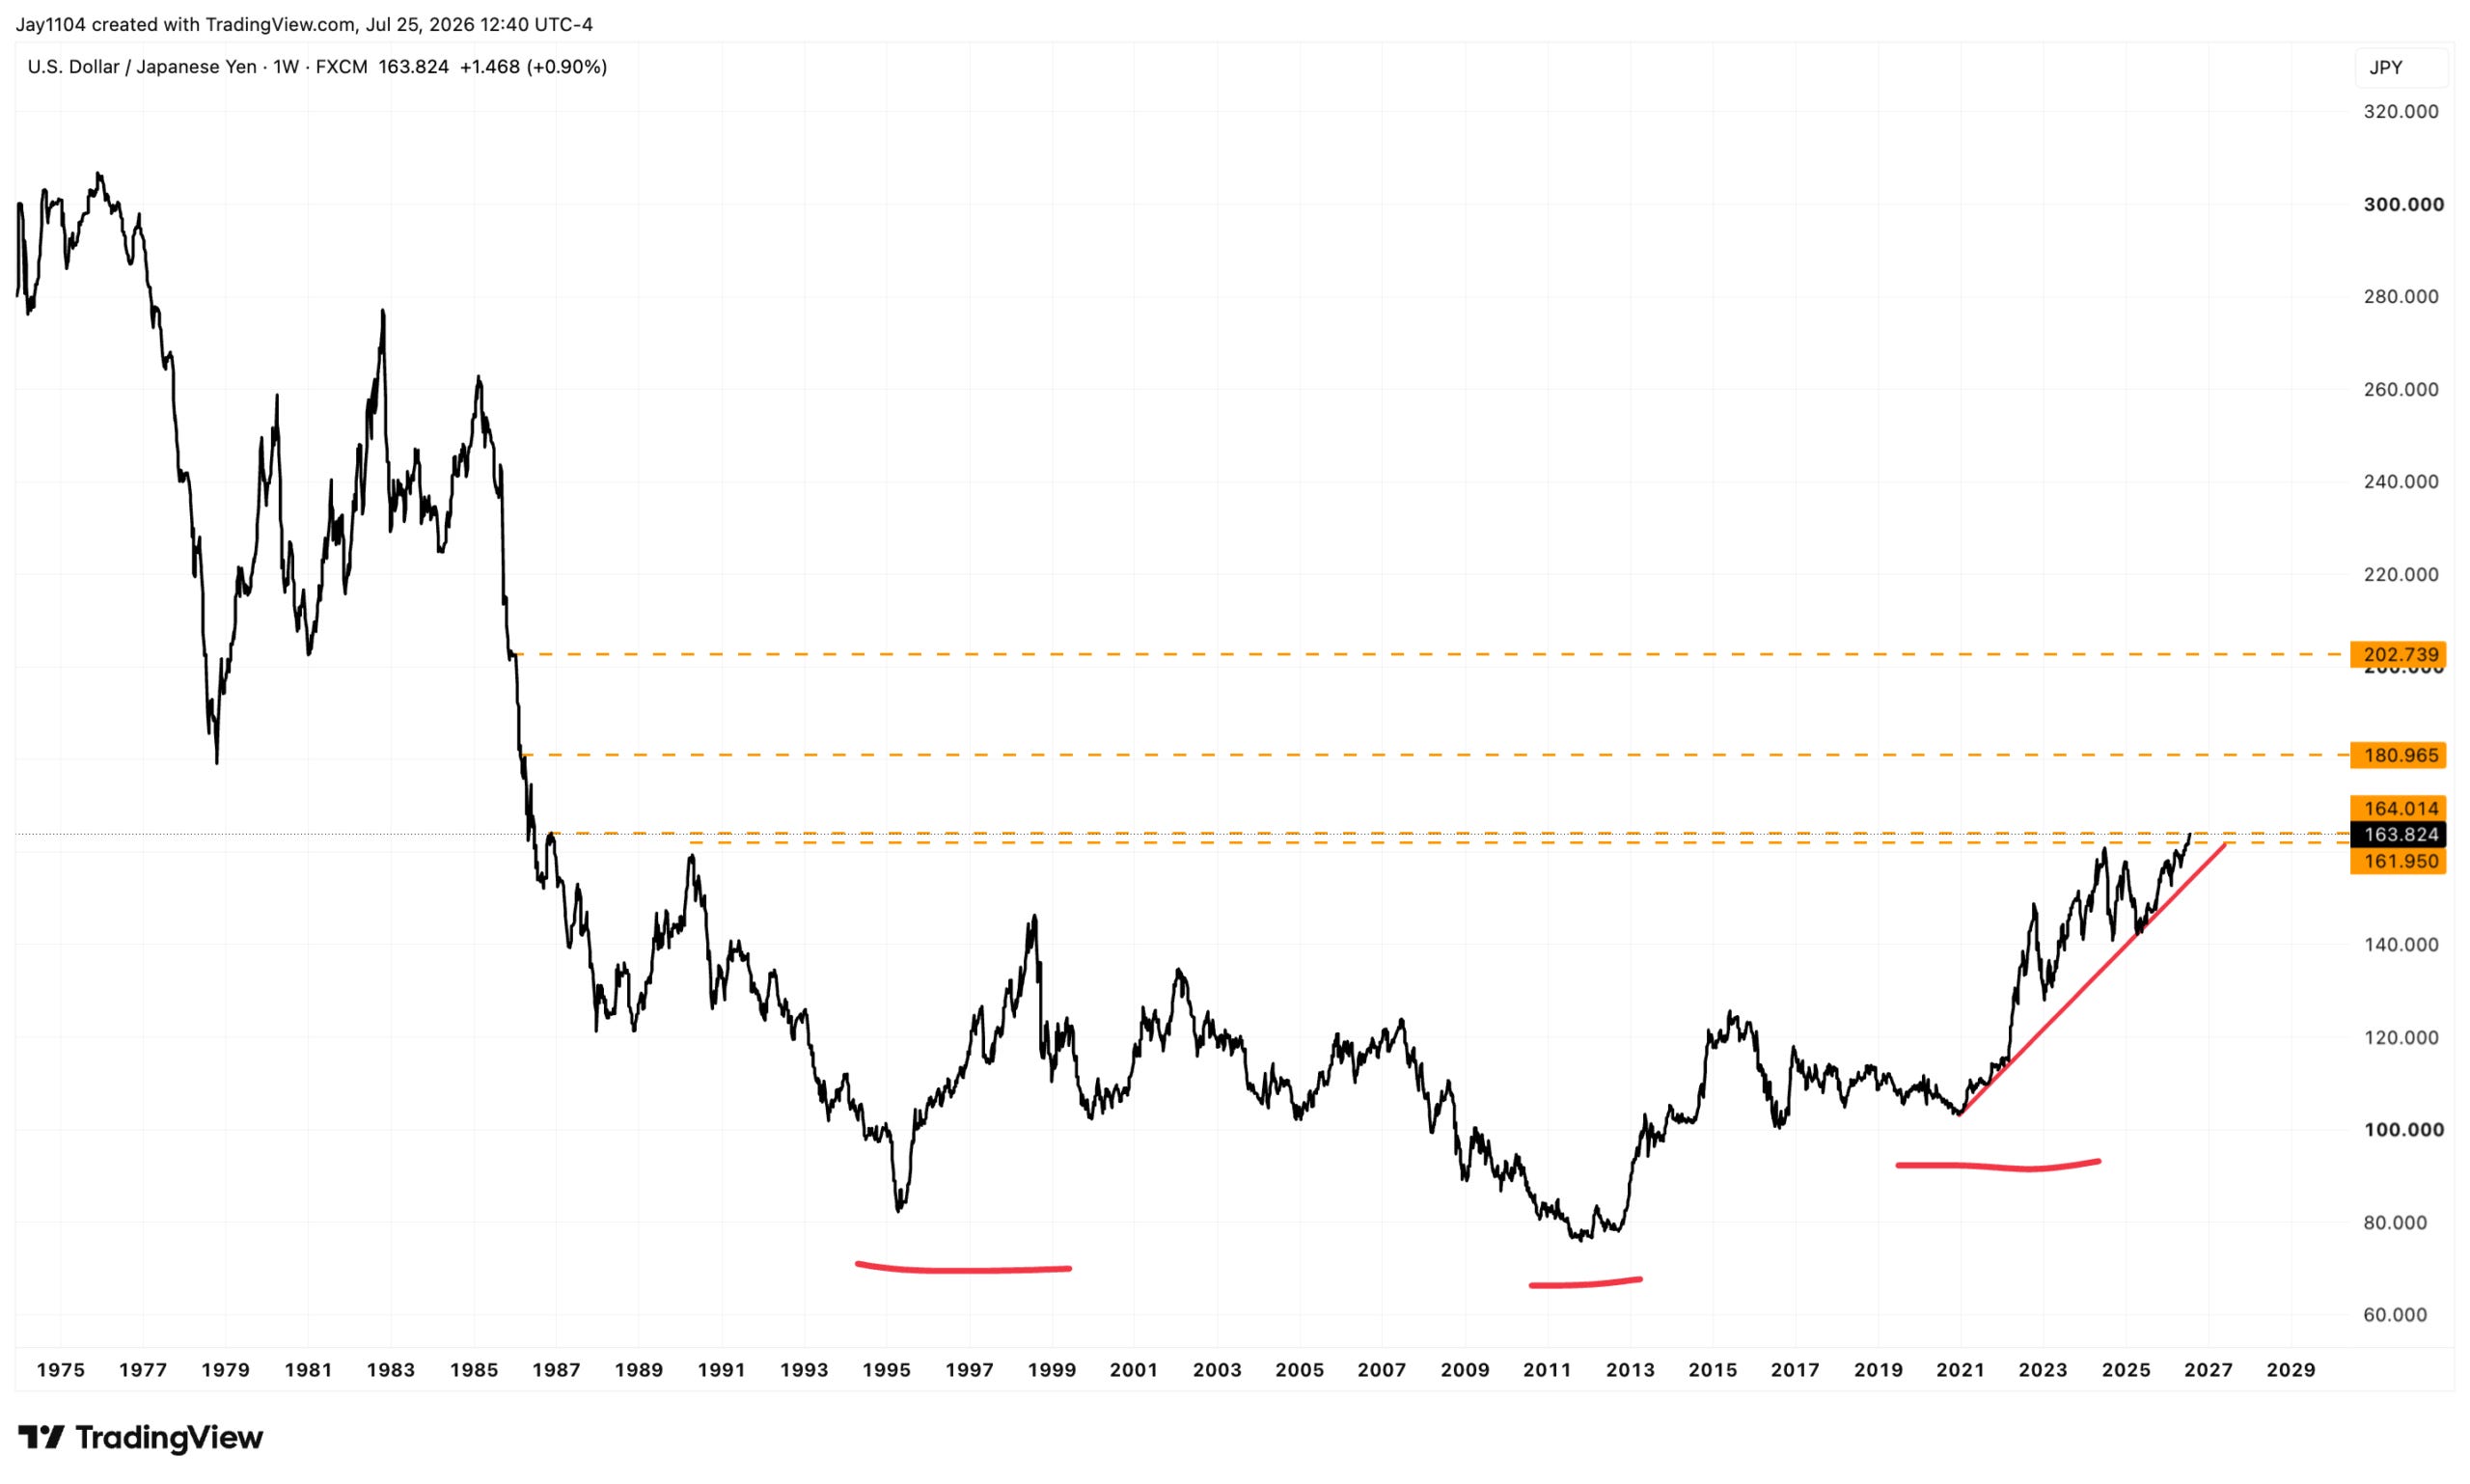
The same thing shows up in the dollar, which has strengthened significantly against the yen, euro, and pound. The euro looks to have formed a bear flag, while the yen has broken out to levels not seen in decades. Beyond the 164 region, there is little resistance until 180 or even 200, and purely on the technicals, an inverse head and shoulders breaking its neckline would point toward 260, though that is a big question.
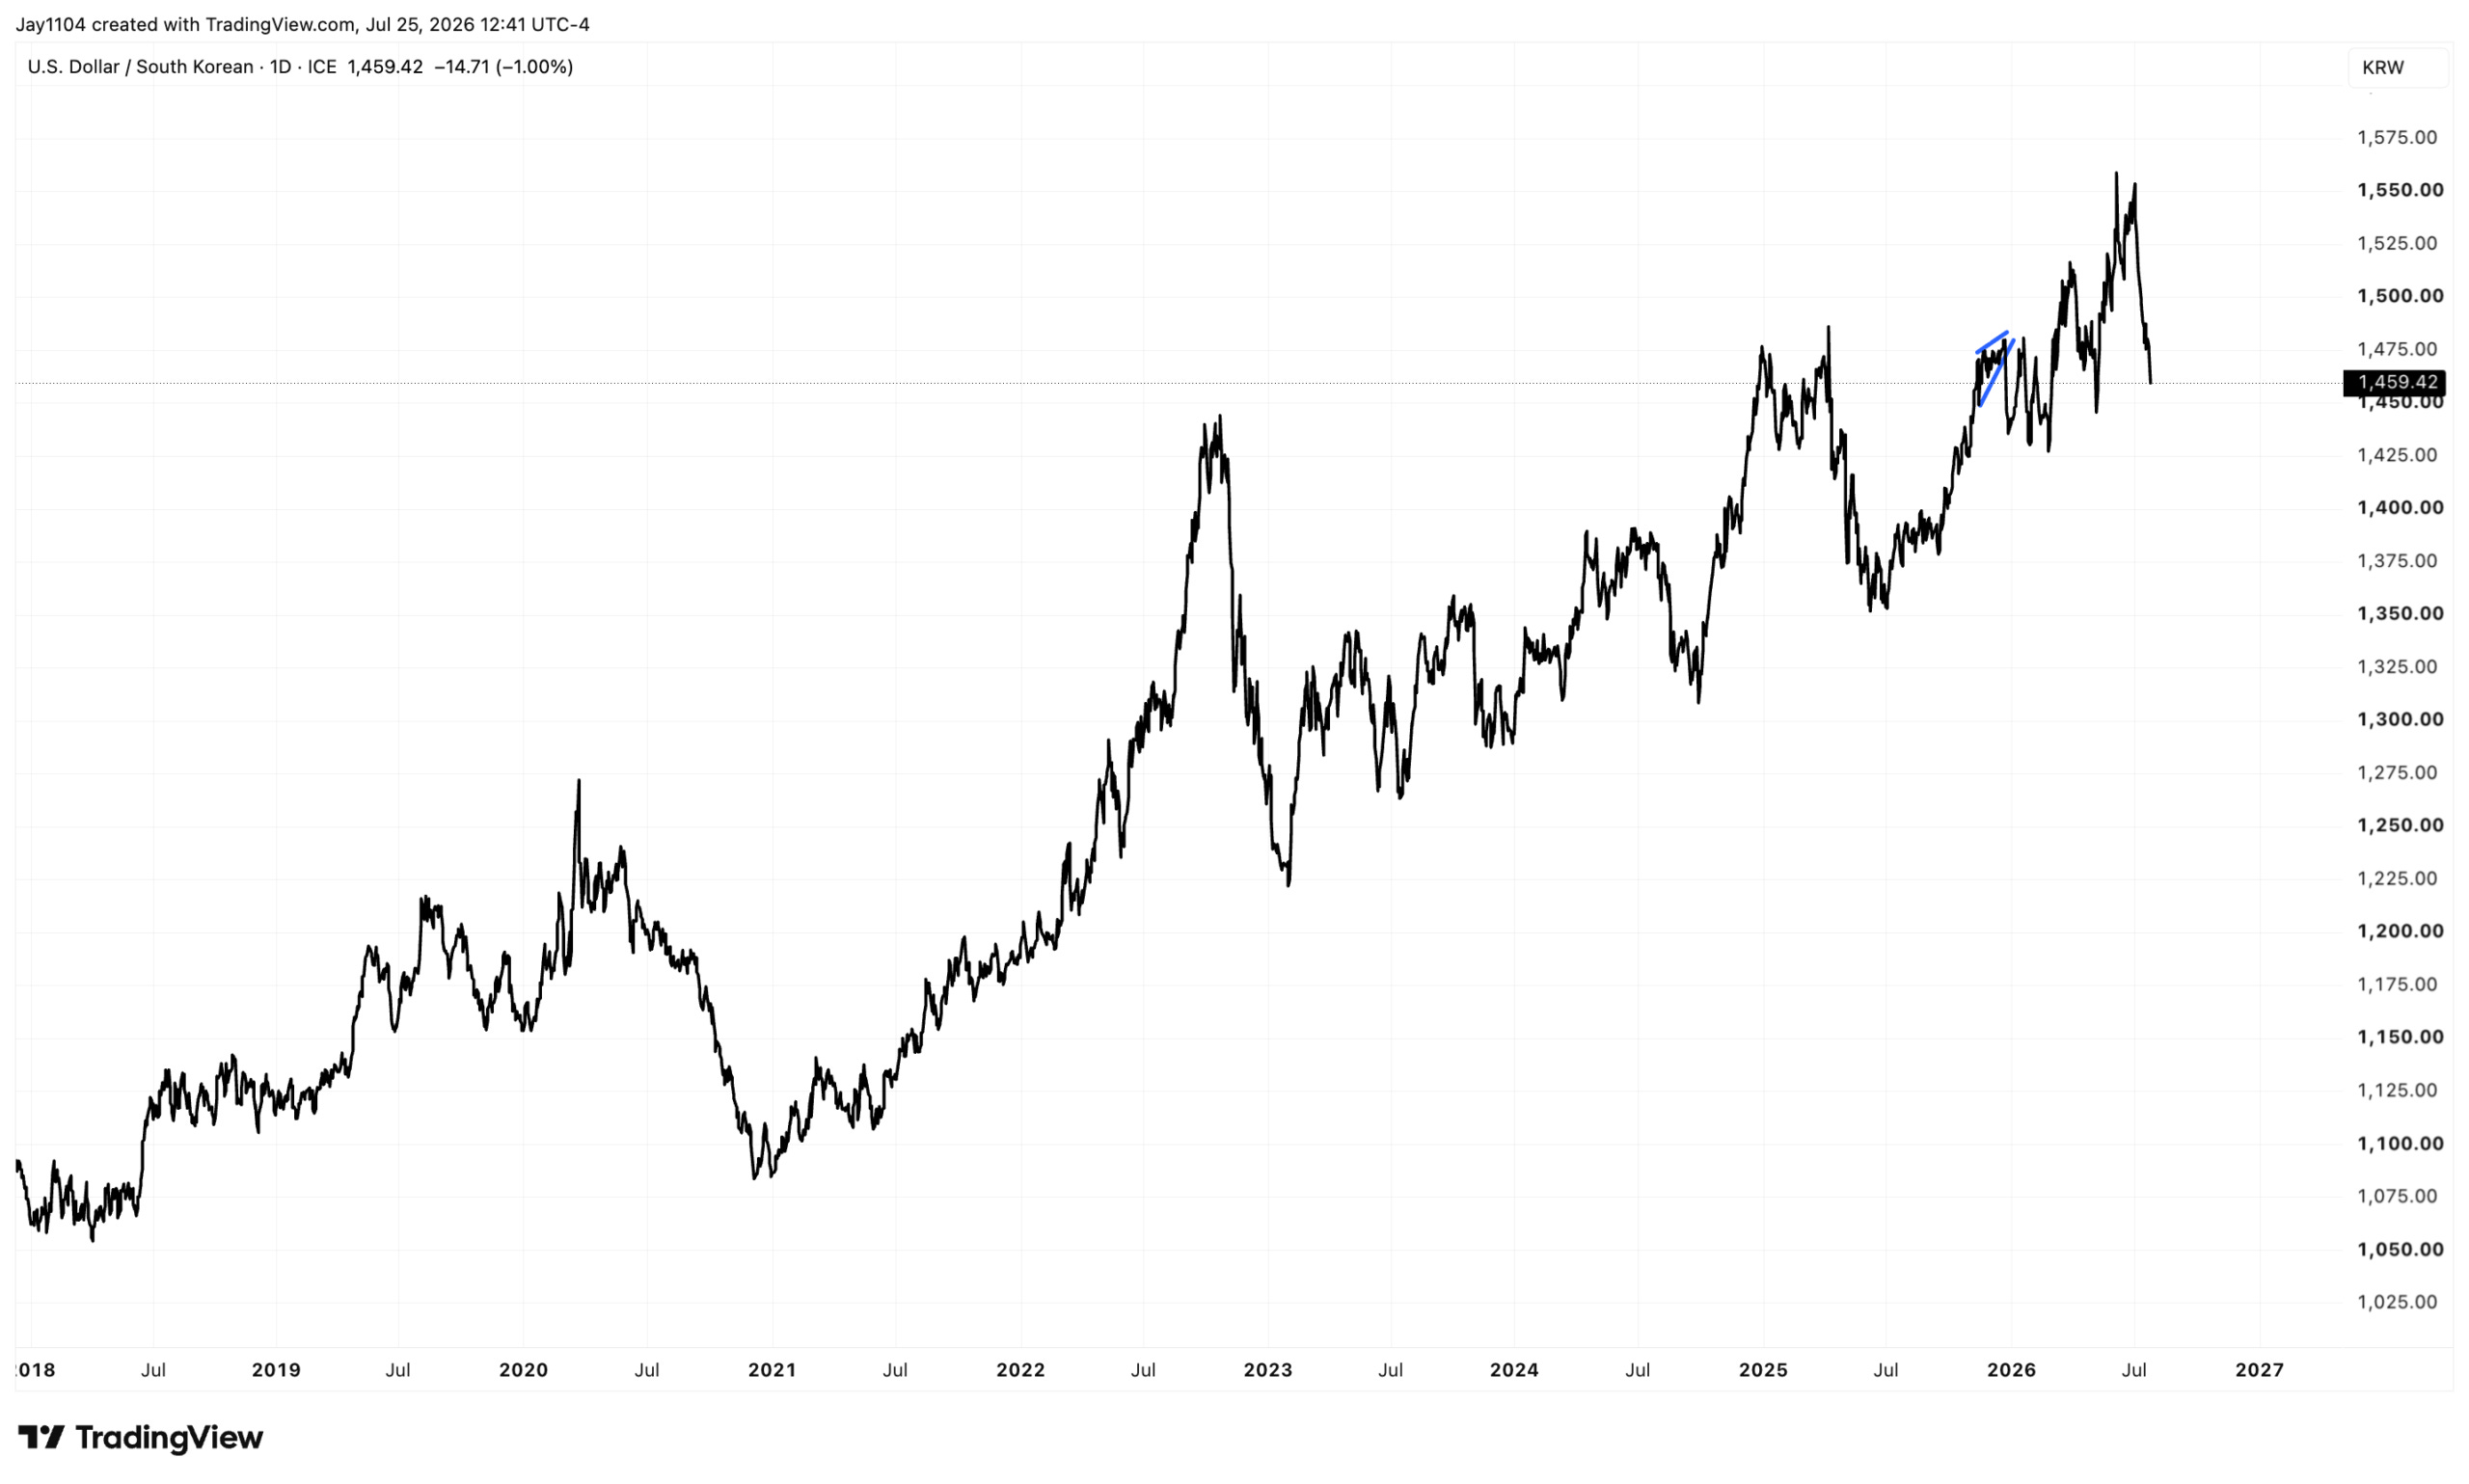
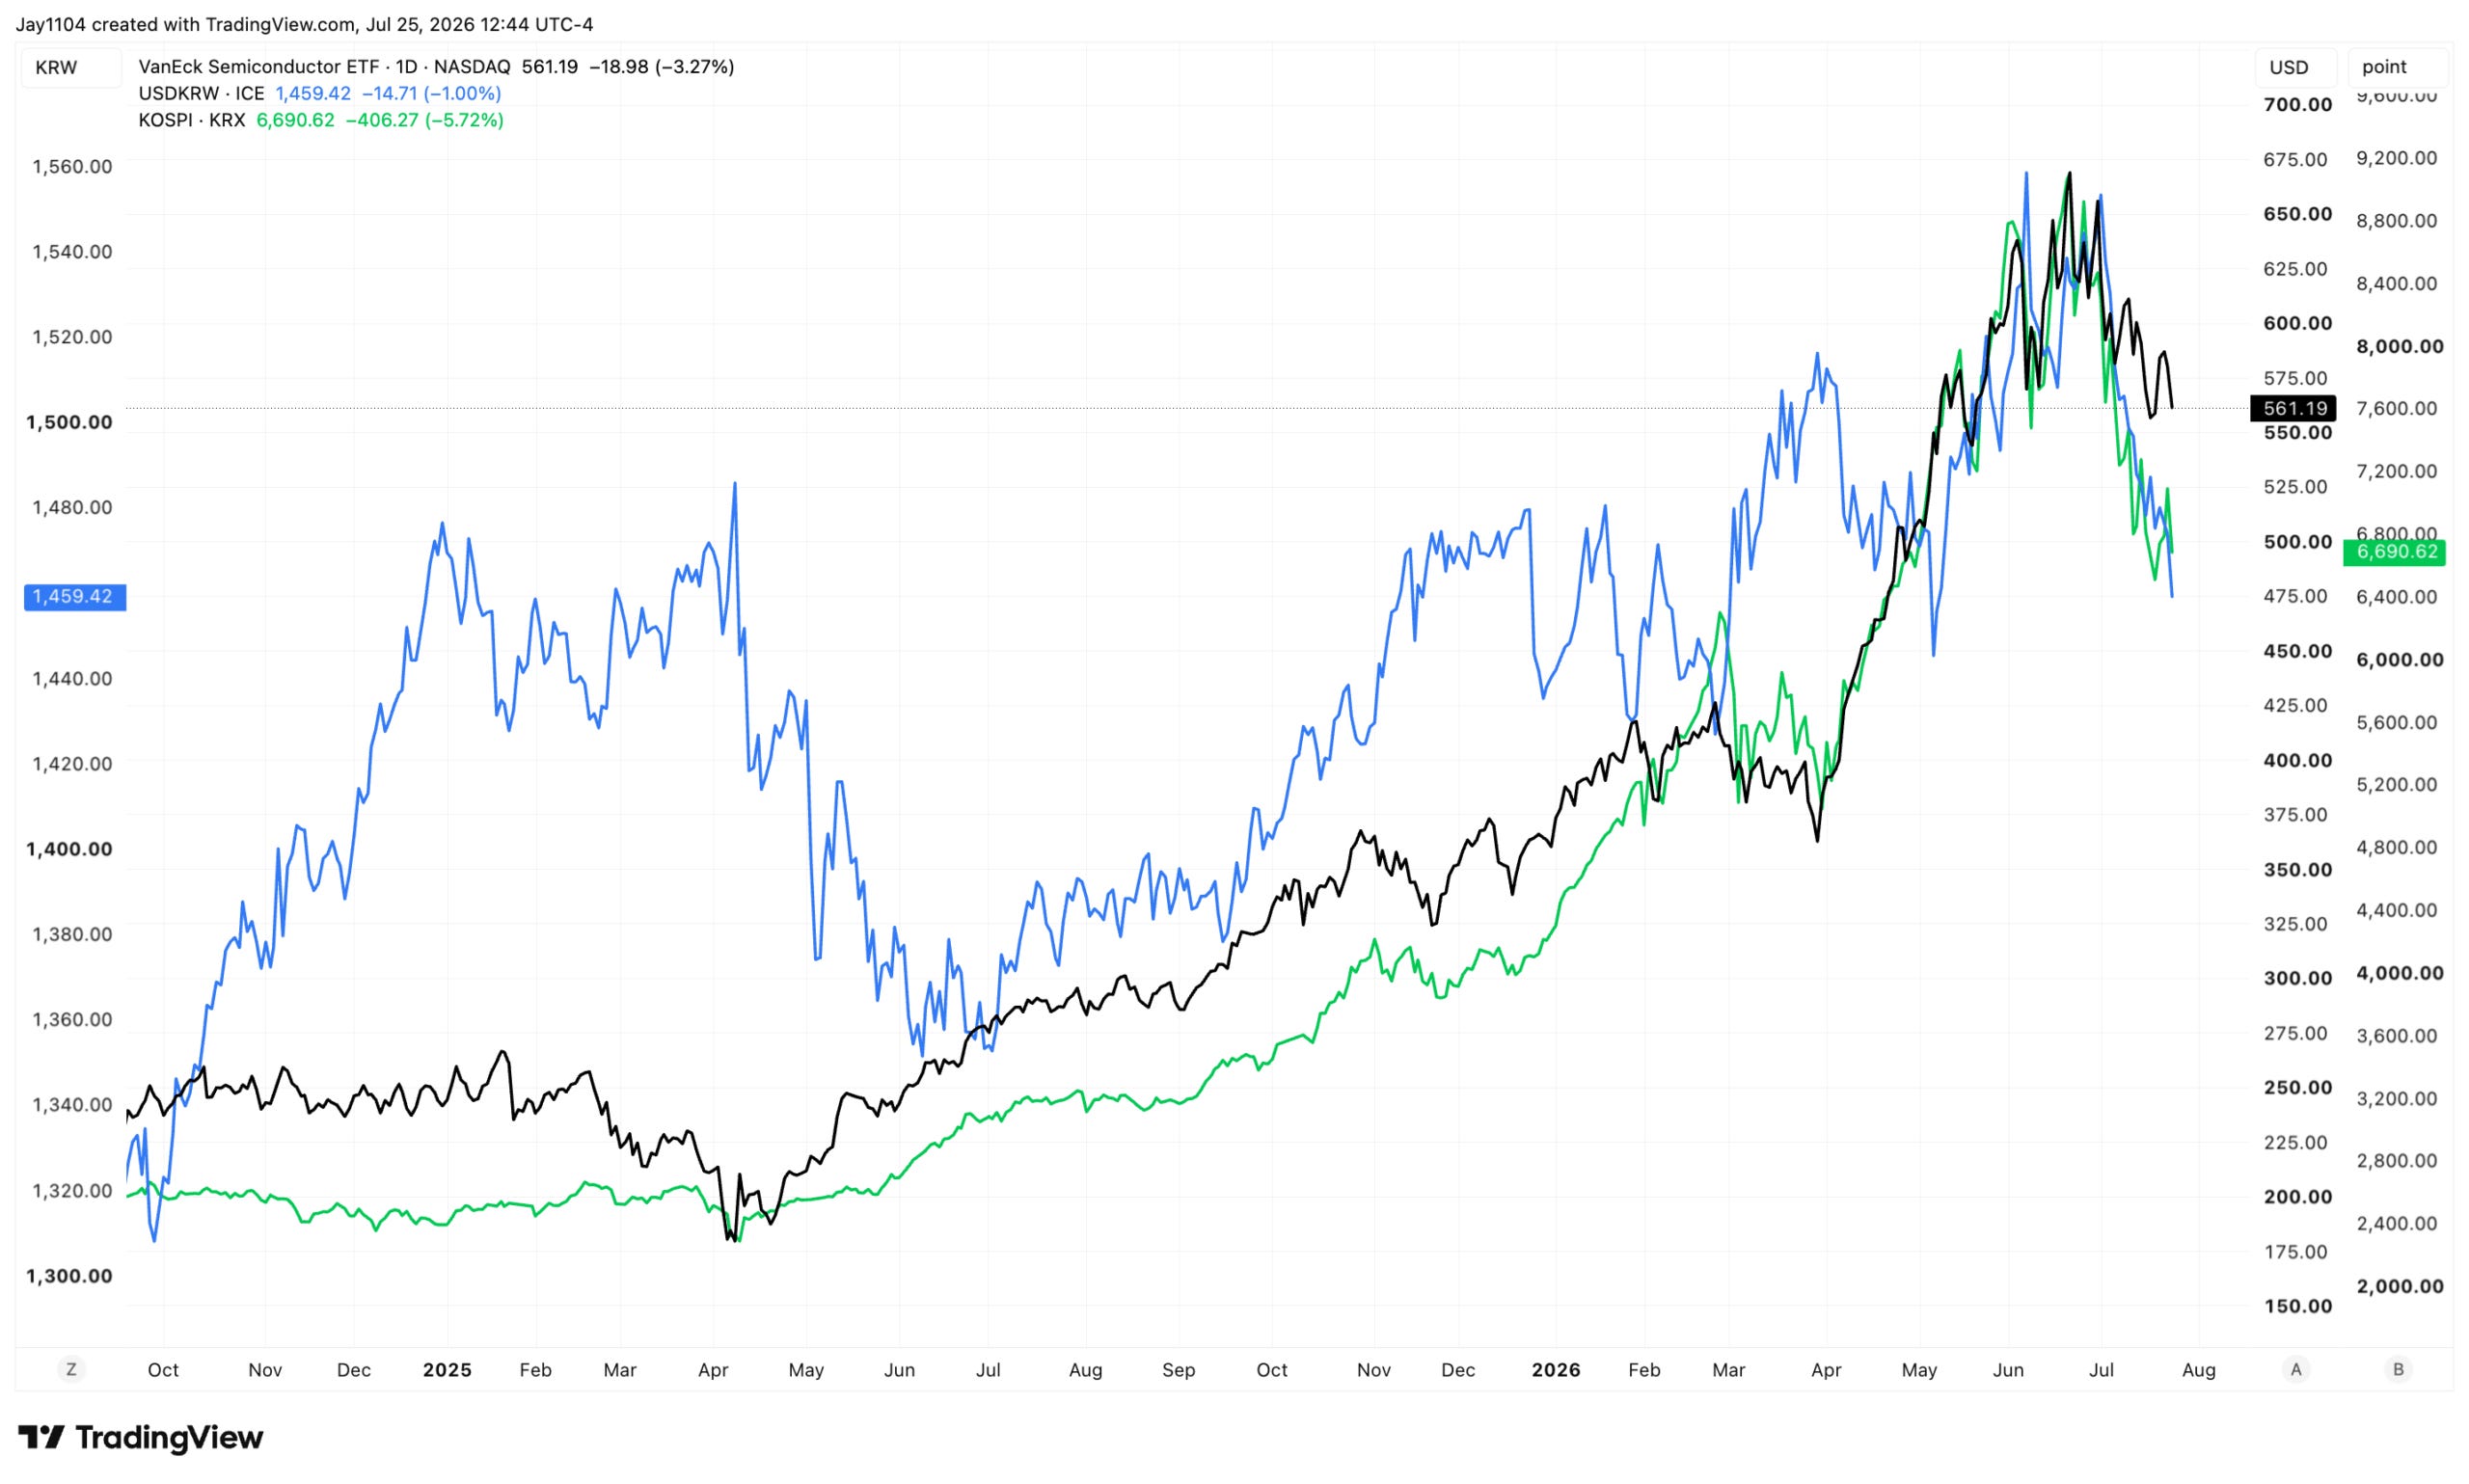
Meanwhile, the market has not a single Bank of Japan hike priced in, while the Bank of Korea already raised rates on July 15 and is expected to reach roughly 3% in August with another hike in November. The won has been strengthening meaningfully as a result. The Fed is likely to be more aggressive than the ECB, the BOE, and the BOJ, but less aggressive than the Bank of Korea.
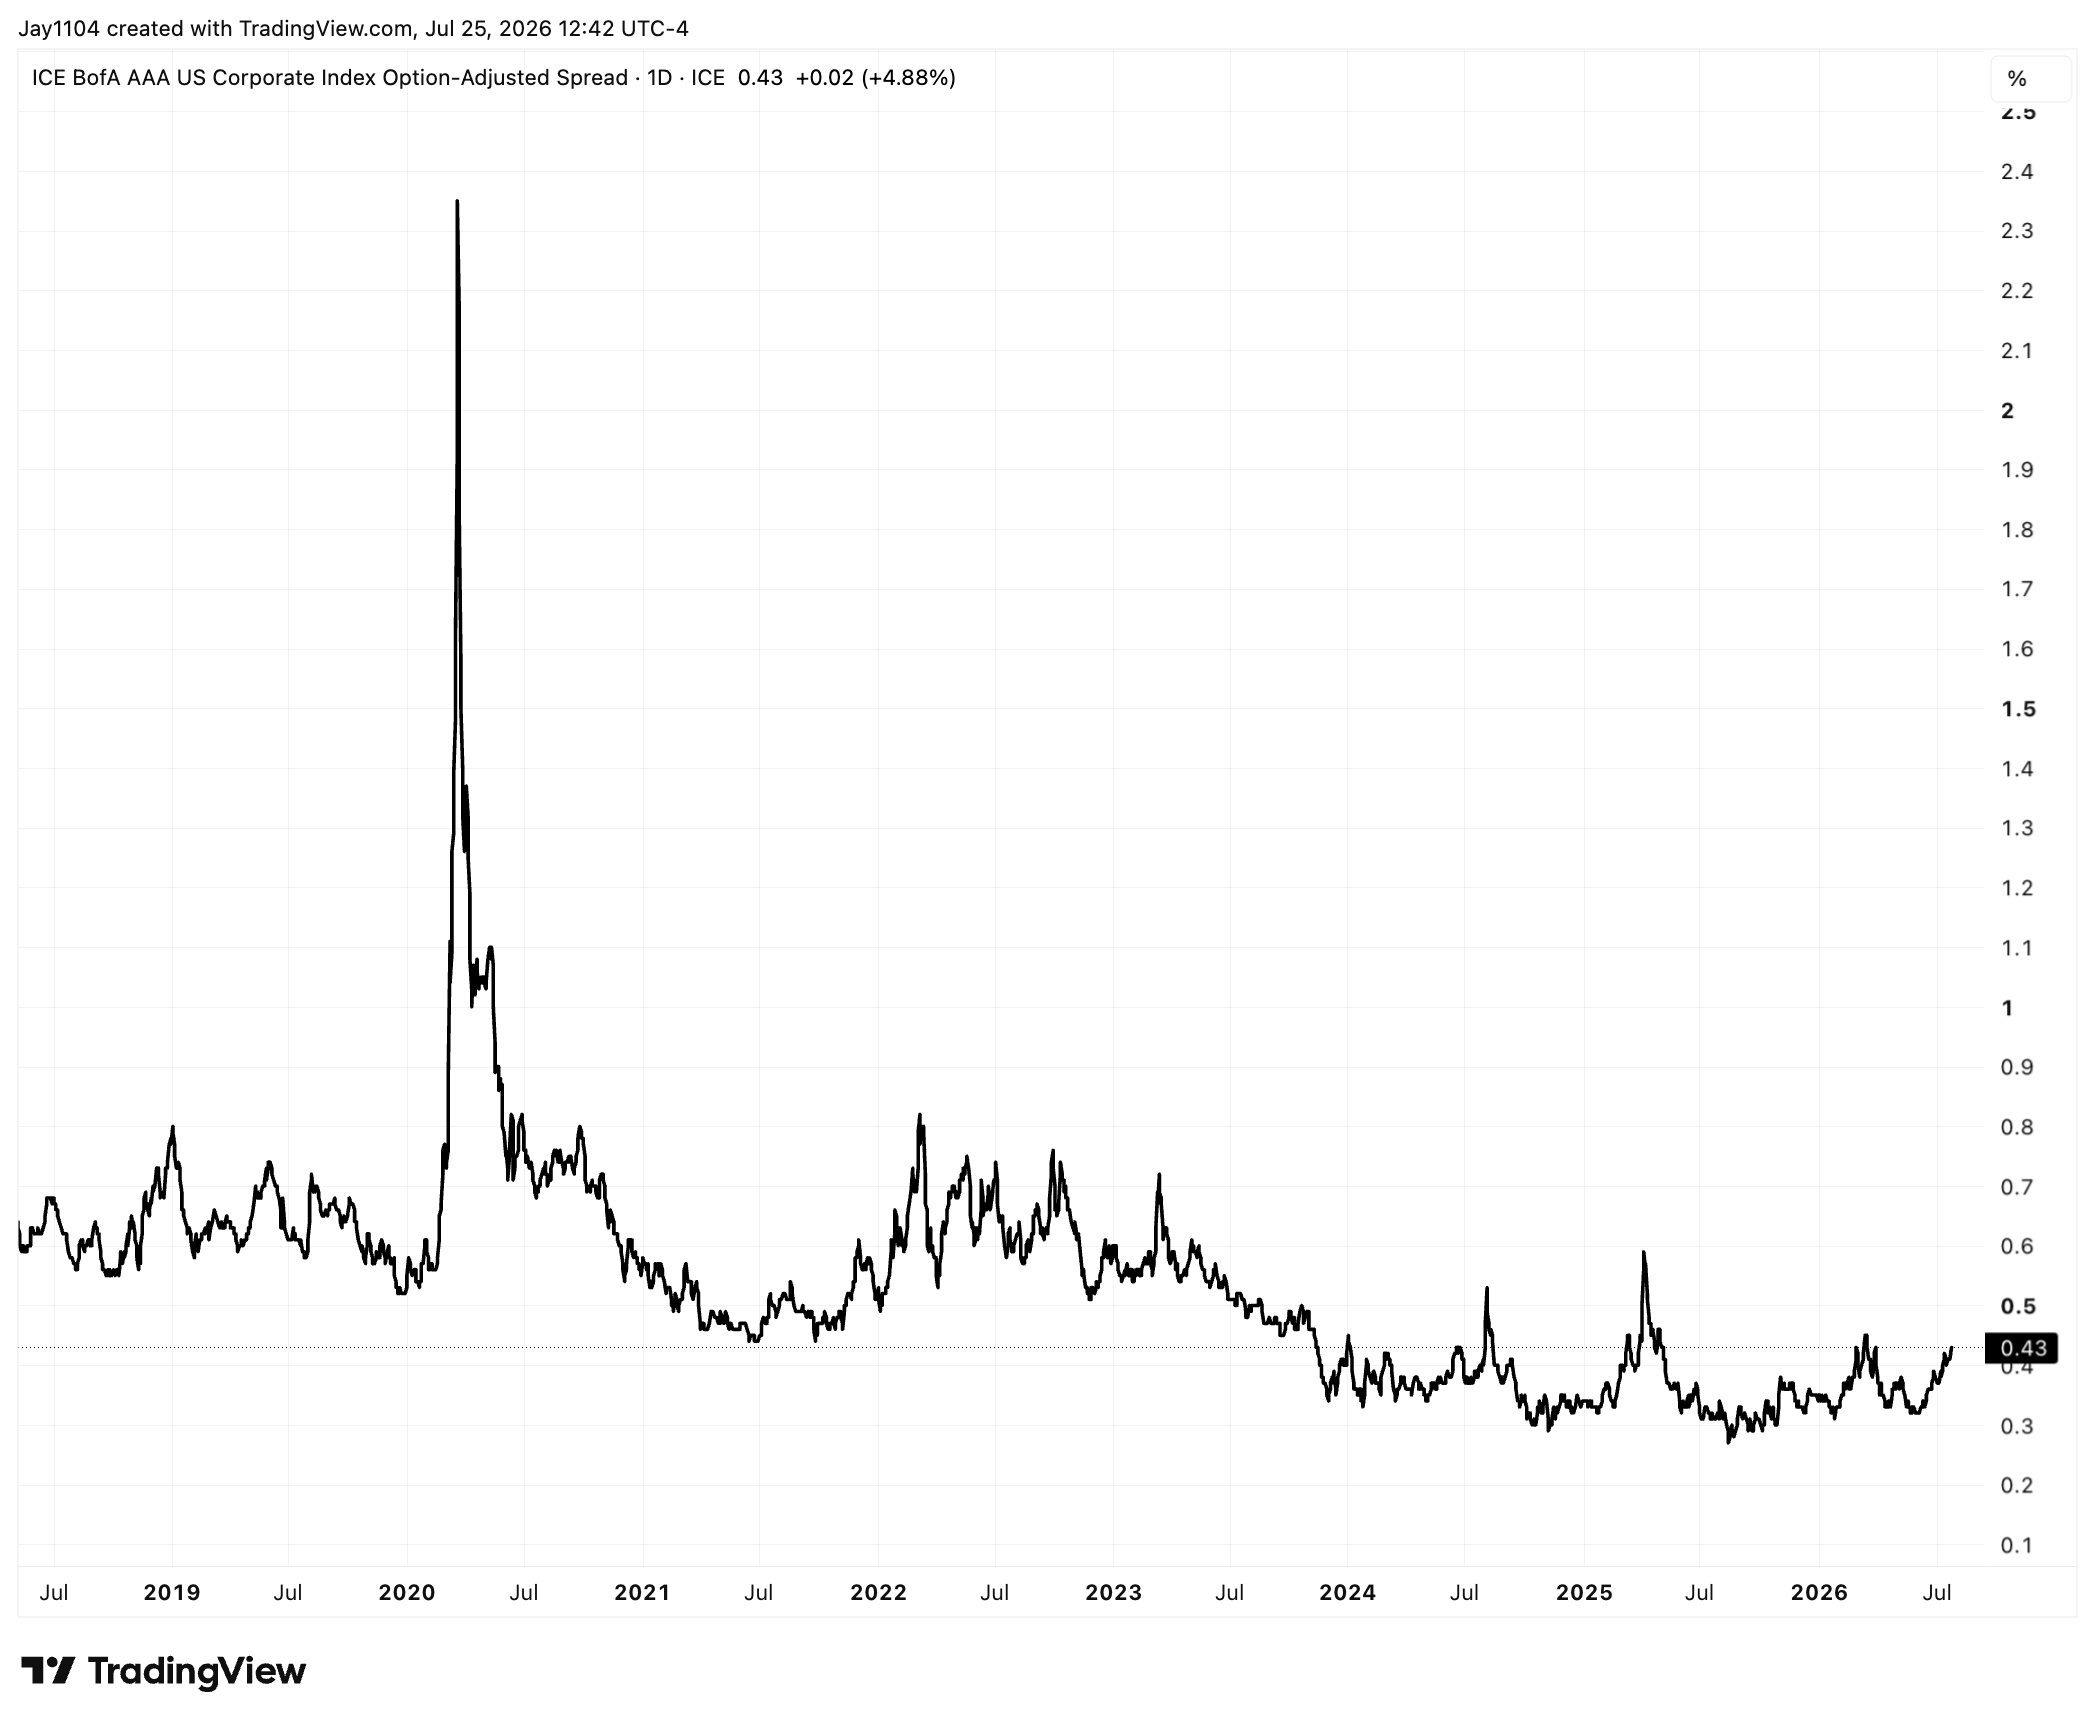
It is starting to show up, very mildly, in credit. The AAA option-adjusted spread has widened back to March levels, and while high-yield spreads haven’t widened yet, I would expect them to if AAA spreads continue to move. HYG and LQD haven’t been performing well either. Nothing major is brewing yet, but widening corporate spreads are another sign of conditions tightening, even if the weekly, lagging NFCI doesn’t show it.
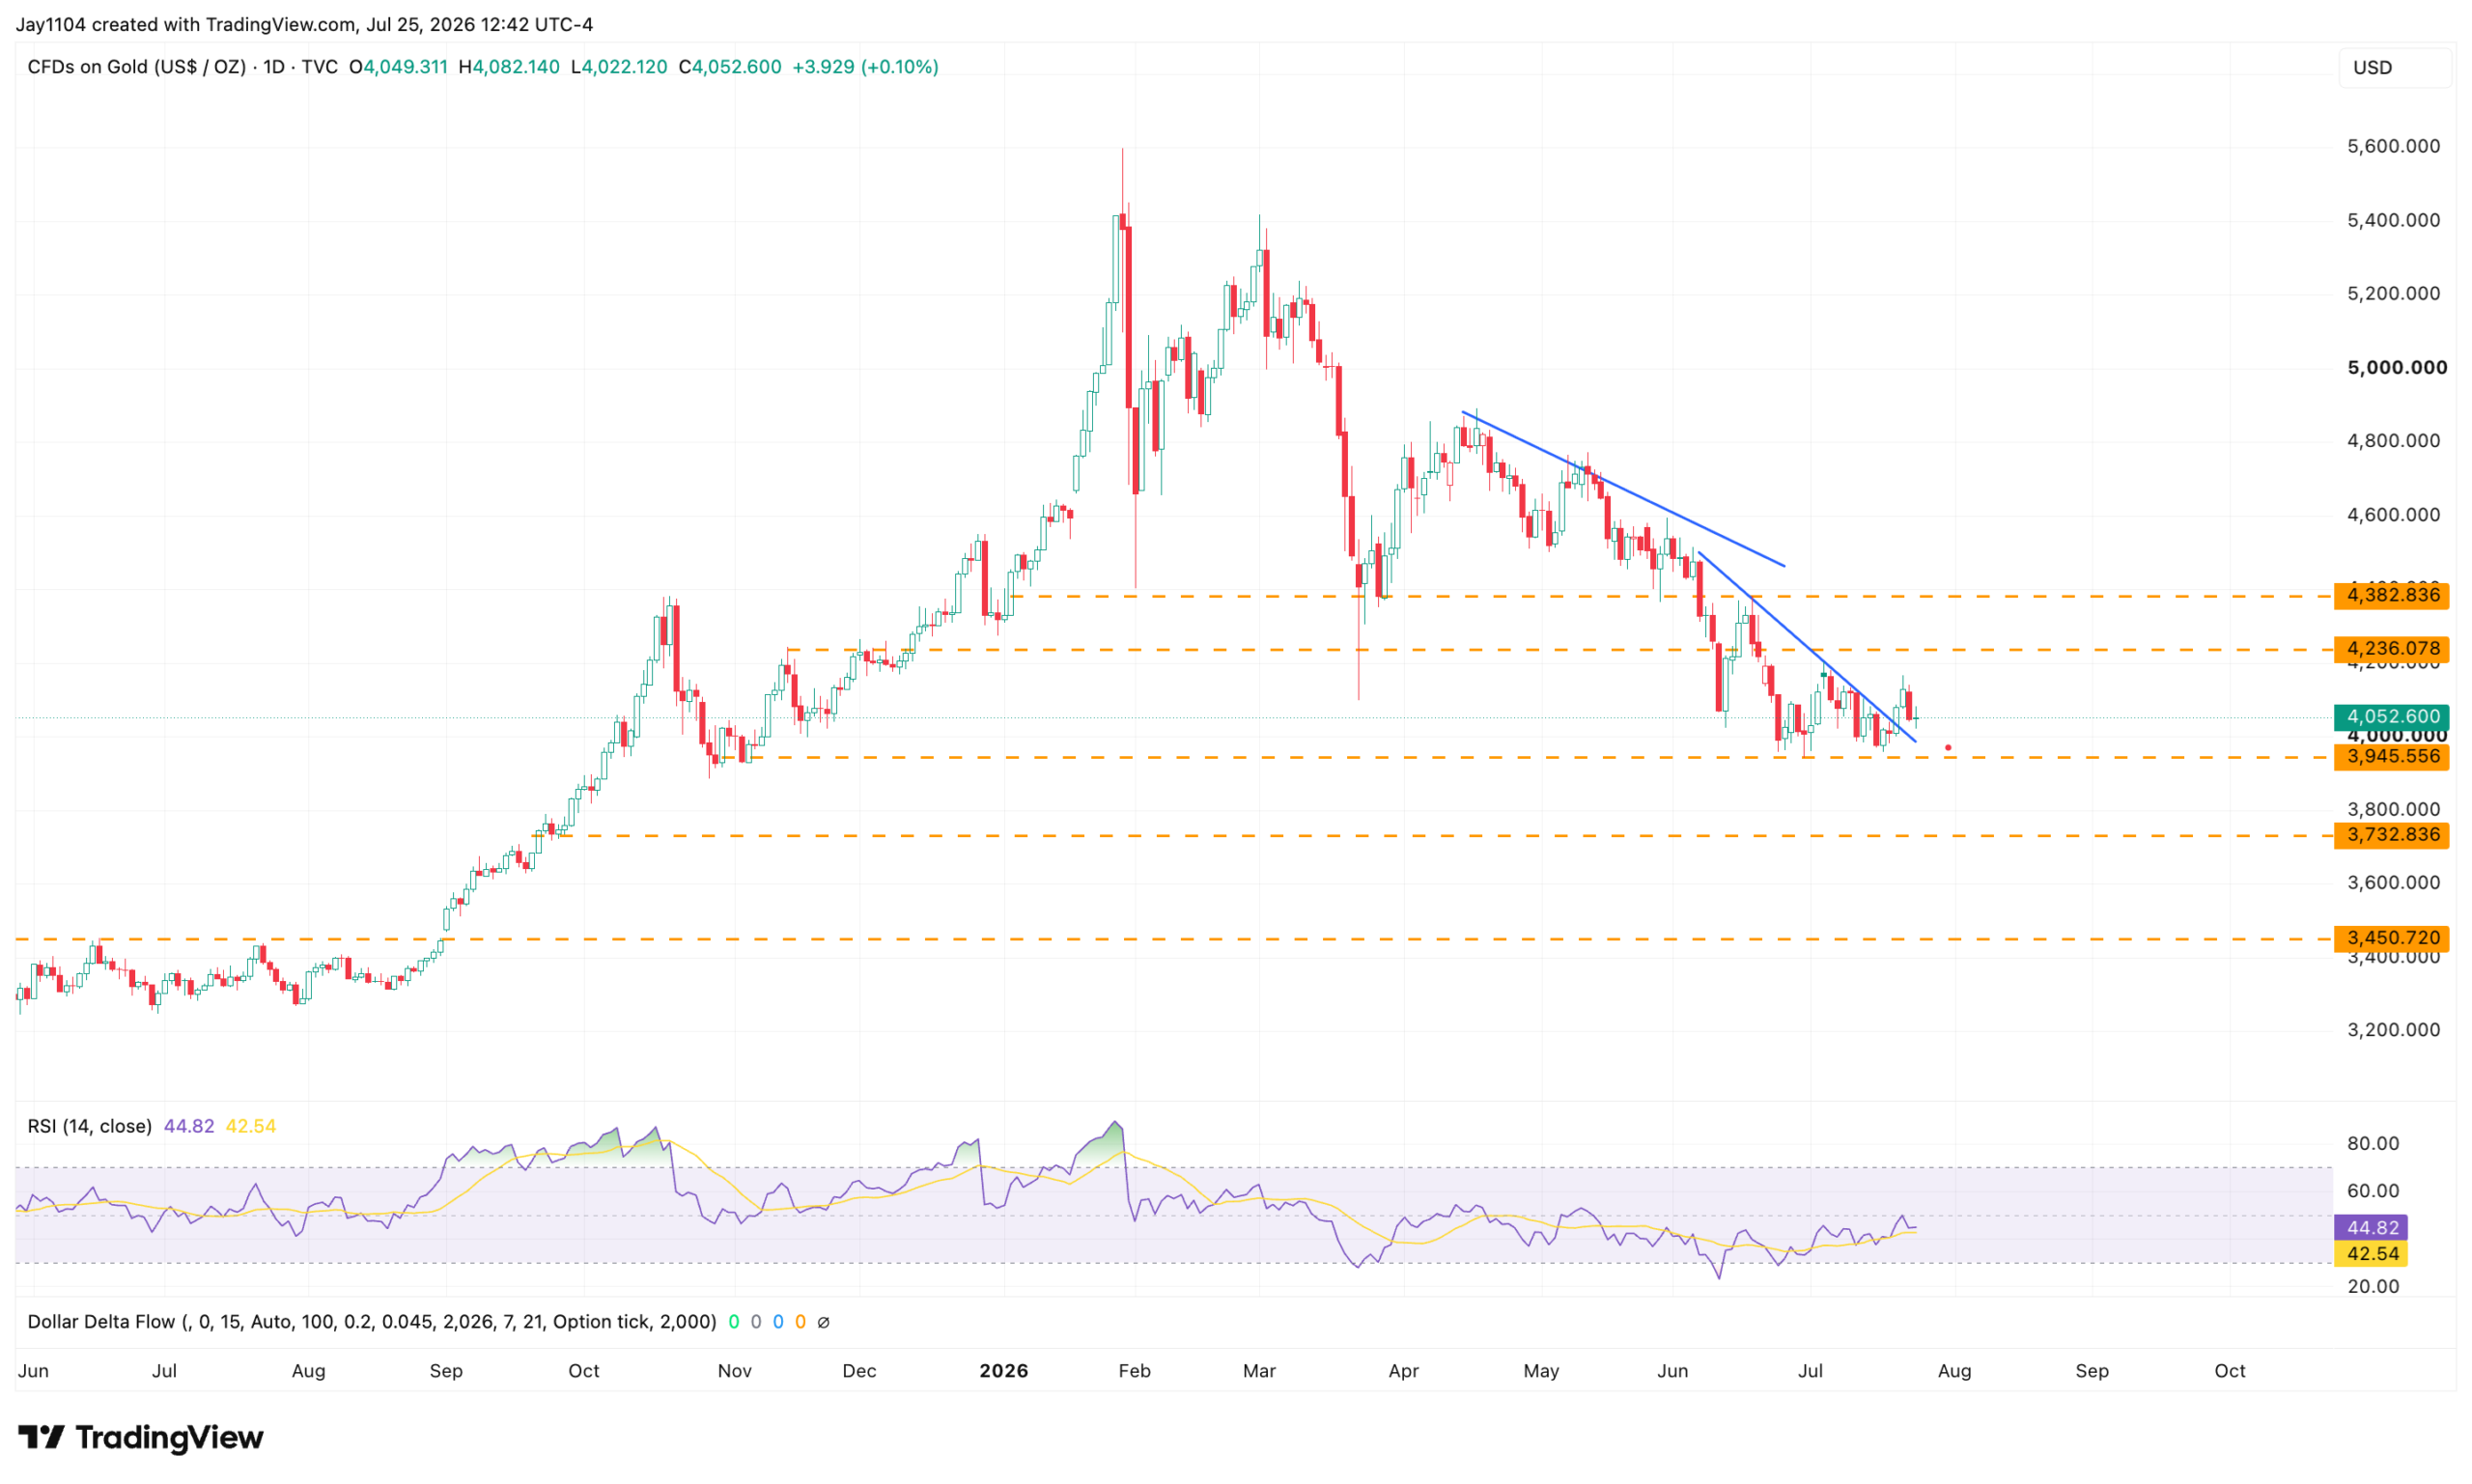
For risk assets, rising real yields, a stronger dollar, and tighter conditions are probably not a good mix. Gold has been coming down fairly hard and hasn’t closed meaningfully above its 20-day moving average, with momentum lower and support not far below. Silver looks similar, and Bitcoin failed at resistance, so a break lower in its momentum readings could signal a shift as well.
In equities, the Nasdaq 100 closed below a prior intraday low that could mark the neckline of a consolidation pattern, suggesting a further break lower. The SMH is in a downtrend, and its volatility index is no longer rising with price; the deviation suggests a return to the normal regime of vol up, prices down rather than the vol-up, spot-up, gamma-squeeze dynamic. The strengthening won matters here too, since Samsung and SK Hynix benefit when the won weakens; the SMH and KOSPI have both benefited from a weaker won since the summer of 2025, and if the won was part of a carry trade on the semis, its unwind would be another headwind.
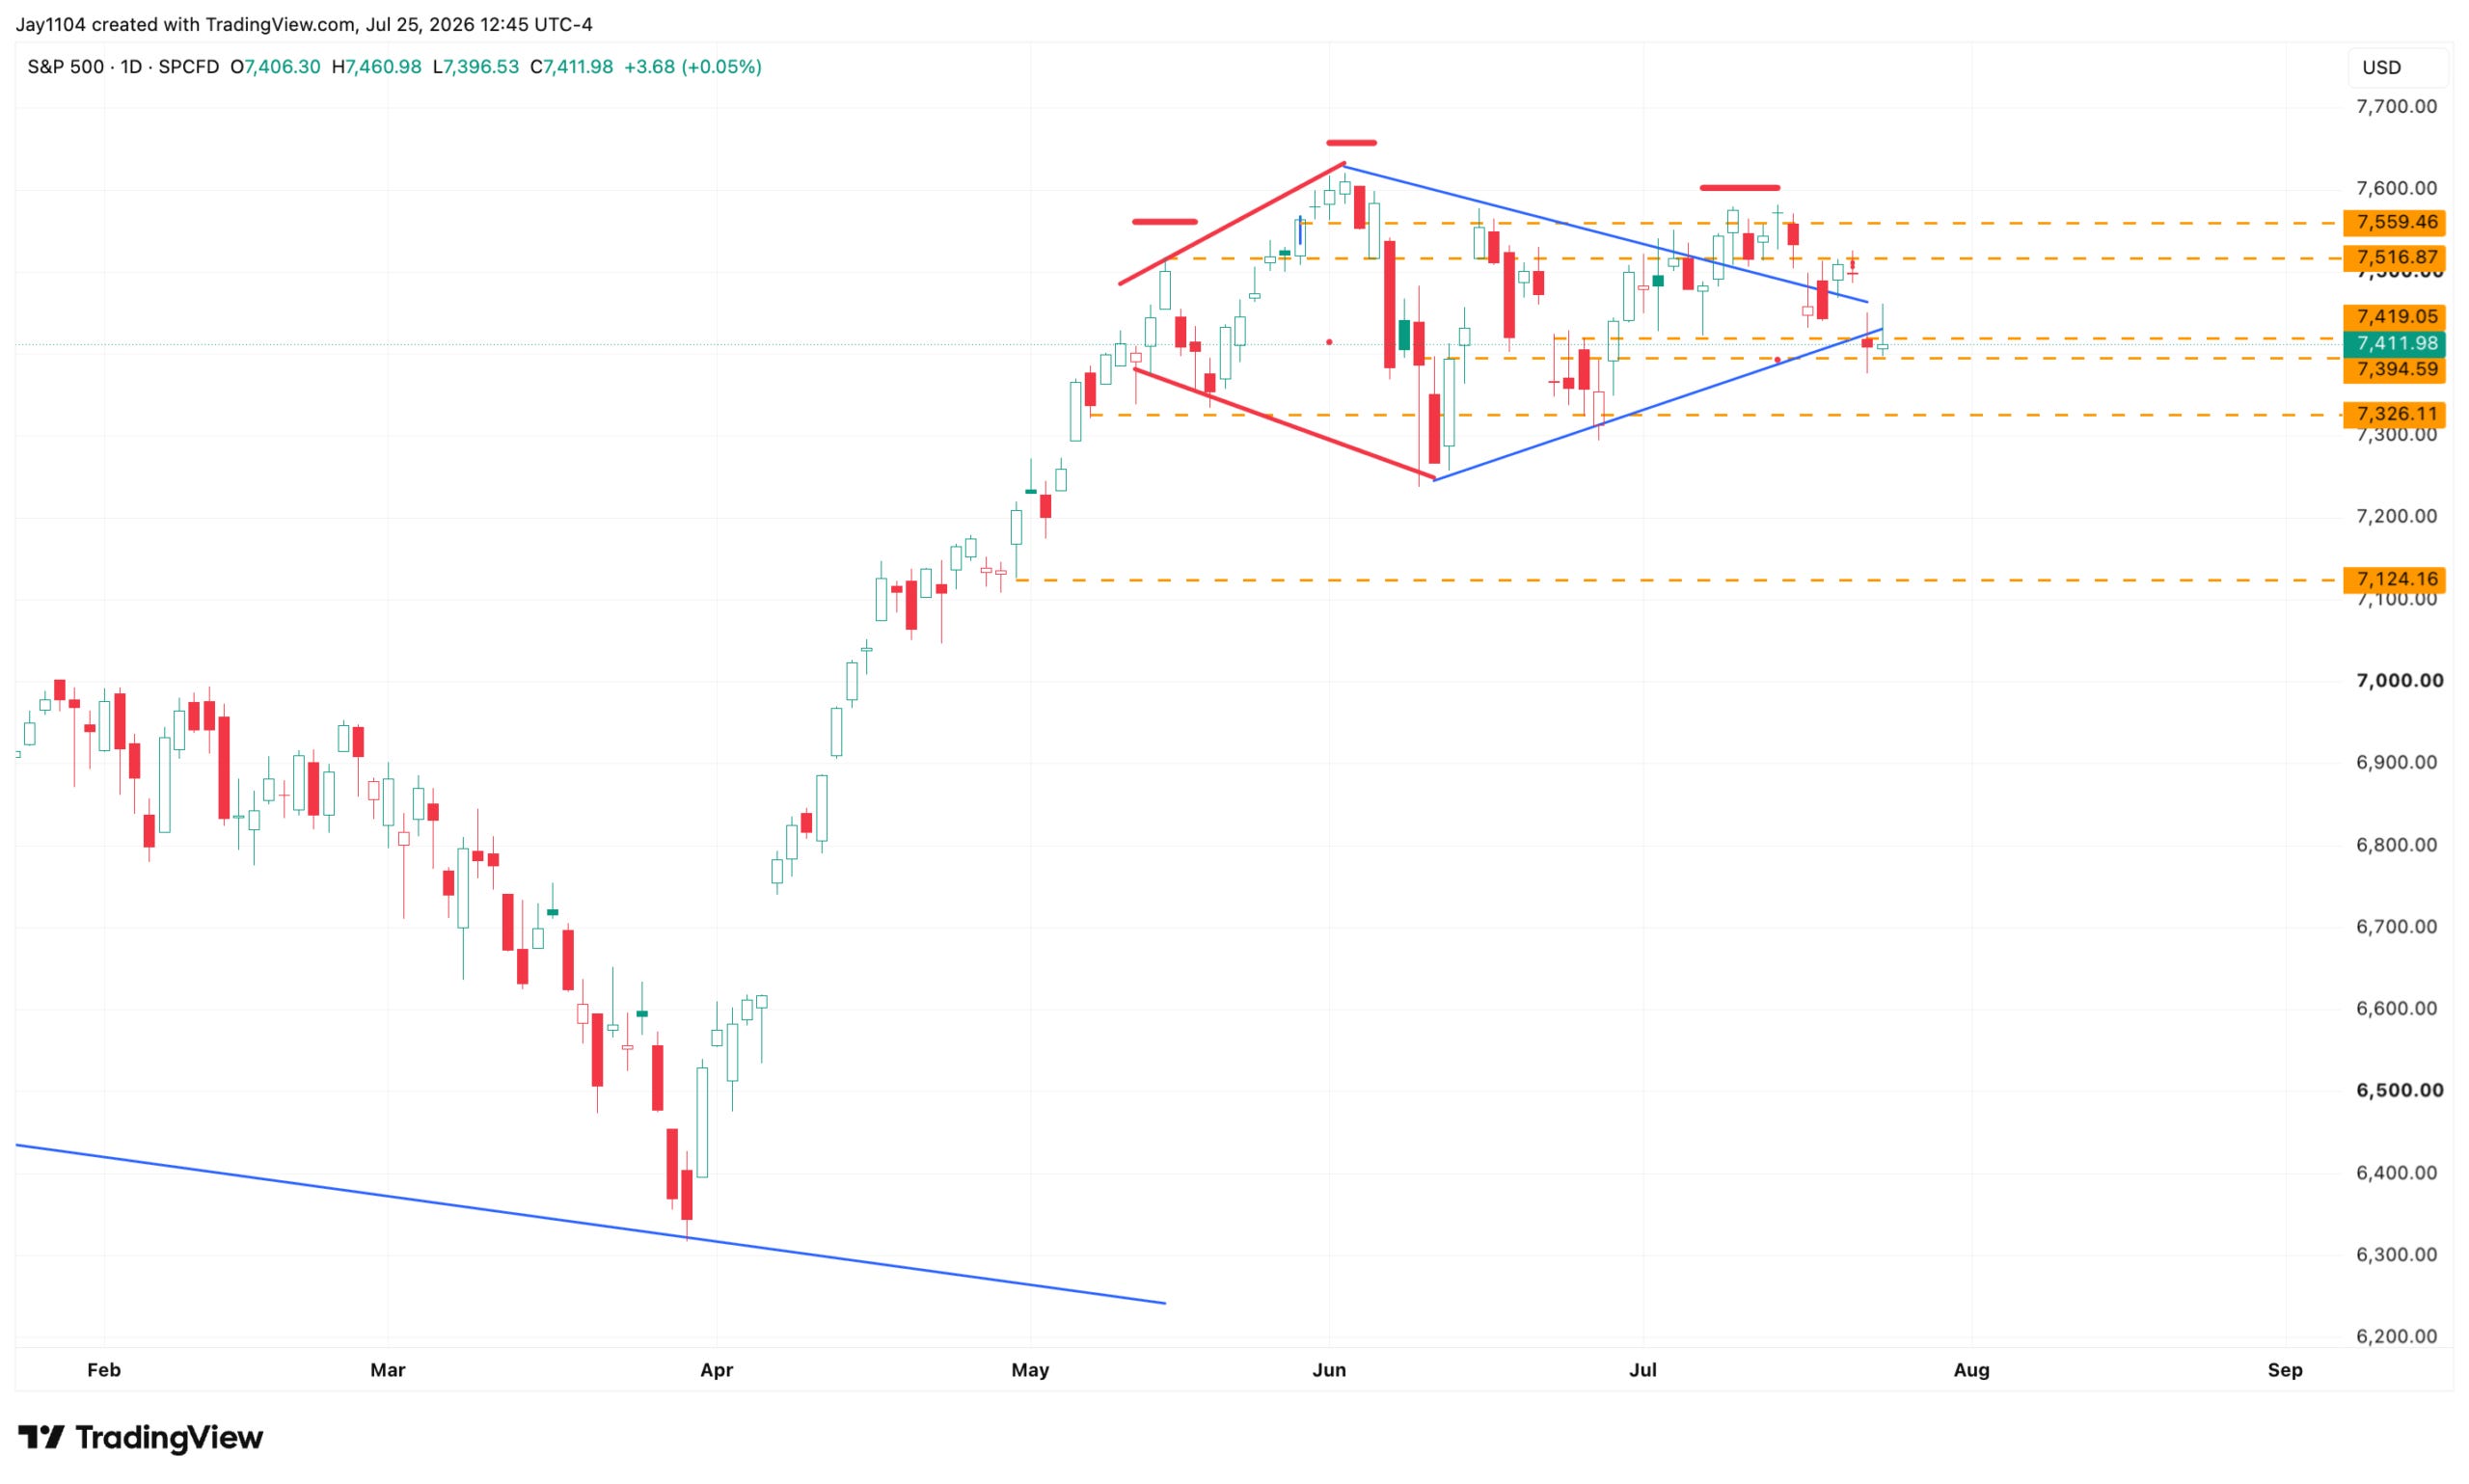
The S&P 500 tried to break out and is coming back down through a diamond pattern, back below its 10-day exponential moving average, though there is still a lot of support just below that would need to break first. If real yields keep moving up, markets can continue to struggle. And if the market keeps pricing in as many as three hikes from a Fed that is giving less forward guidance, a momentum shift may be taking place beneath the surface, where the trades that have been working unwind while beaten-up stocks begin to rebound.
-Mike
Glossary by Claude
Overnight index swaps (OIS): Derivative contracts tied to the expected path of the Fed’s policy rate; the market uses them to read the odds of rate moves at upcoming meetings.
12-month forward rate: The rate the market implies the 3-month Treasury bill will carry one year from now; the gap between it and today’s bill reflects the rate hikes the market expects over that span.
Real yield: The nominal Treasury yield minus the breakeven inflation rate; a measure of the cost of money after inflation, and a key driver of financial conditions.
Breakeven inflation rate: The inflation rate implied by the gap between nominal Treasury yields and TIPS yields; it represents the market’s inflation expectation over that horizon.
Option-adjusted spread (OAS): The extra yield a corporate bond pays over Treasuries after accounting for any embedded options; widening spreads are a sign of tightening financial conditions.
NFCI (National Financial Conditions Index): The Chicago Fed’s weekly composite of money-market, debt, and equity indicators; because it prints weekly, it can lag the most current market data.
Bear flag: A brief, upward-drifting consolidation within a downtrend that often resolves with another move lower.
Inverse head and shoulders / neckline: A bottoming pattern of three troughs with the middle one deepest; a break above the neckline projects a move measured from the pattern, in this case back toward its origin.
Carry trade: Borrowing in a low-yielding currency to fund positions elsewhere; when the funding currency strengthens, the trade unwinds and can pressure the assets it was funding.
Vol up, spot up (gamma squeeze): A dynamic where options hedging pushes prices and volatility higher together; when it fades, markets tend to return to the normal pattern of volatility rising as prices fall.
Disclaimer
This report contains independent commentary to be used for informational and educational purposes only. Michael Kramer is a member and investment adviser representative with Mott Capital Management. Mr. Kramer is not affiliated with this company and does not serve on the board of any related company that issued this stock. All opinions and analyses presented by Michael Kramer in this analysis or market report are solely Michael Kramer’s views. Readers should not treat any opinion, viewpoint, or prediction expressed by Michael Kramer as a specific solicitation or recommendation to buy or sell a particular security or follow a particular strategy. Michael Kramer’s analyses are based upon information and independent research that he considers reliable, but neither Michael Kramer nor Mott Capital Management guarantees its completeness or accuracy, and it should not be relied upon as such. Michael Kramer is not under any obligation to update or correct any information presented in his analyses. Mr. Kramer’s statements, guidance, and opinions are subject to change without notice. Past performance is not indicative of future results. Neither Michael Kramer nor Mott Capital Management guarantees any specific outcome or profit. You should be aware of the real risk of loss in following any strategy or investment commentary presented in this analysis. Strategies or investments discussed may fluctuate in price or value. Investments or strategies mentioned in this analysis may not be suitable for you. This material does not consider your particular investment objectives, financial situation, or needs and is not intended as a recommendation appropriate for you. You must make an independent decision regarding investments or strategies in this analysis. Upon request, the advisor will provide a list of all recommendations made during the past twelve months. Before acting on information in this analysis, you should consider whether it is suitable for your circumstances and strongly consider seeking advice from your own financial or investment adviser to determine the suitability of any investment.