
Extreme Volatility Positioning Raises Pullback Risk

For Today Only - Take 35% off the annual tier. End Of May Special
This week brings the ISM report, ADP employment report, and the BLS jobs report. Data releases like these used to matter a great deal, but for the moment the market is no longer trading on macro — it is trading on the gamma of seven stocks. Whether and when traditional data begins to matter again remains an open question.
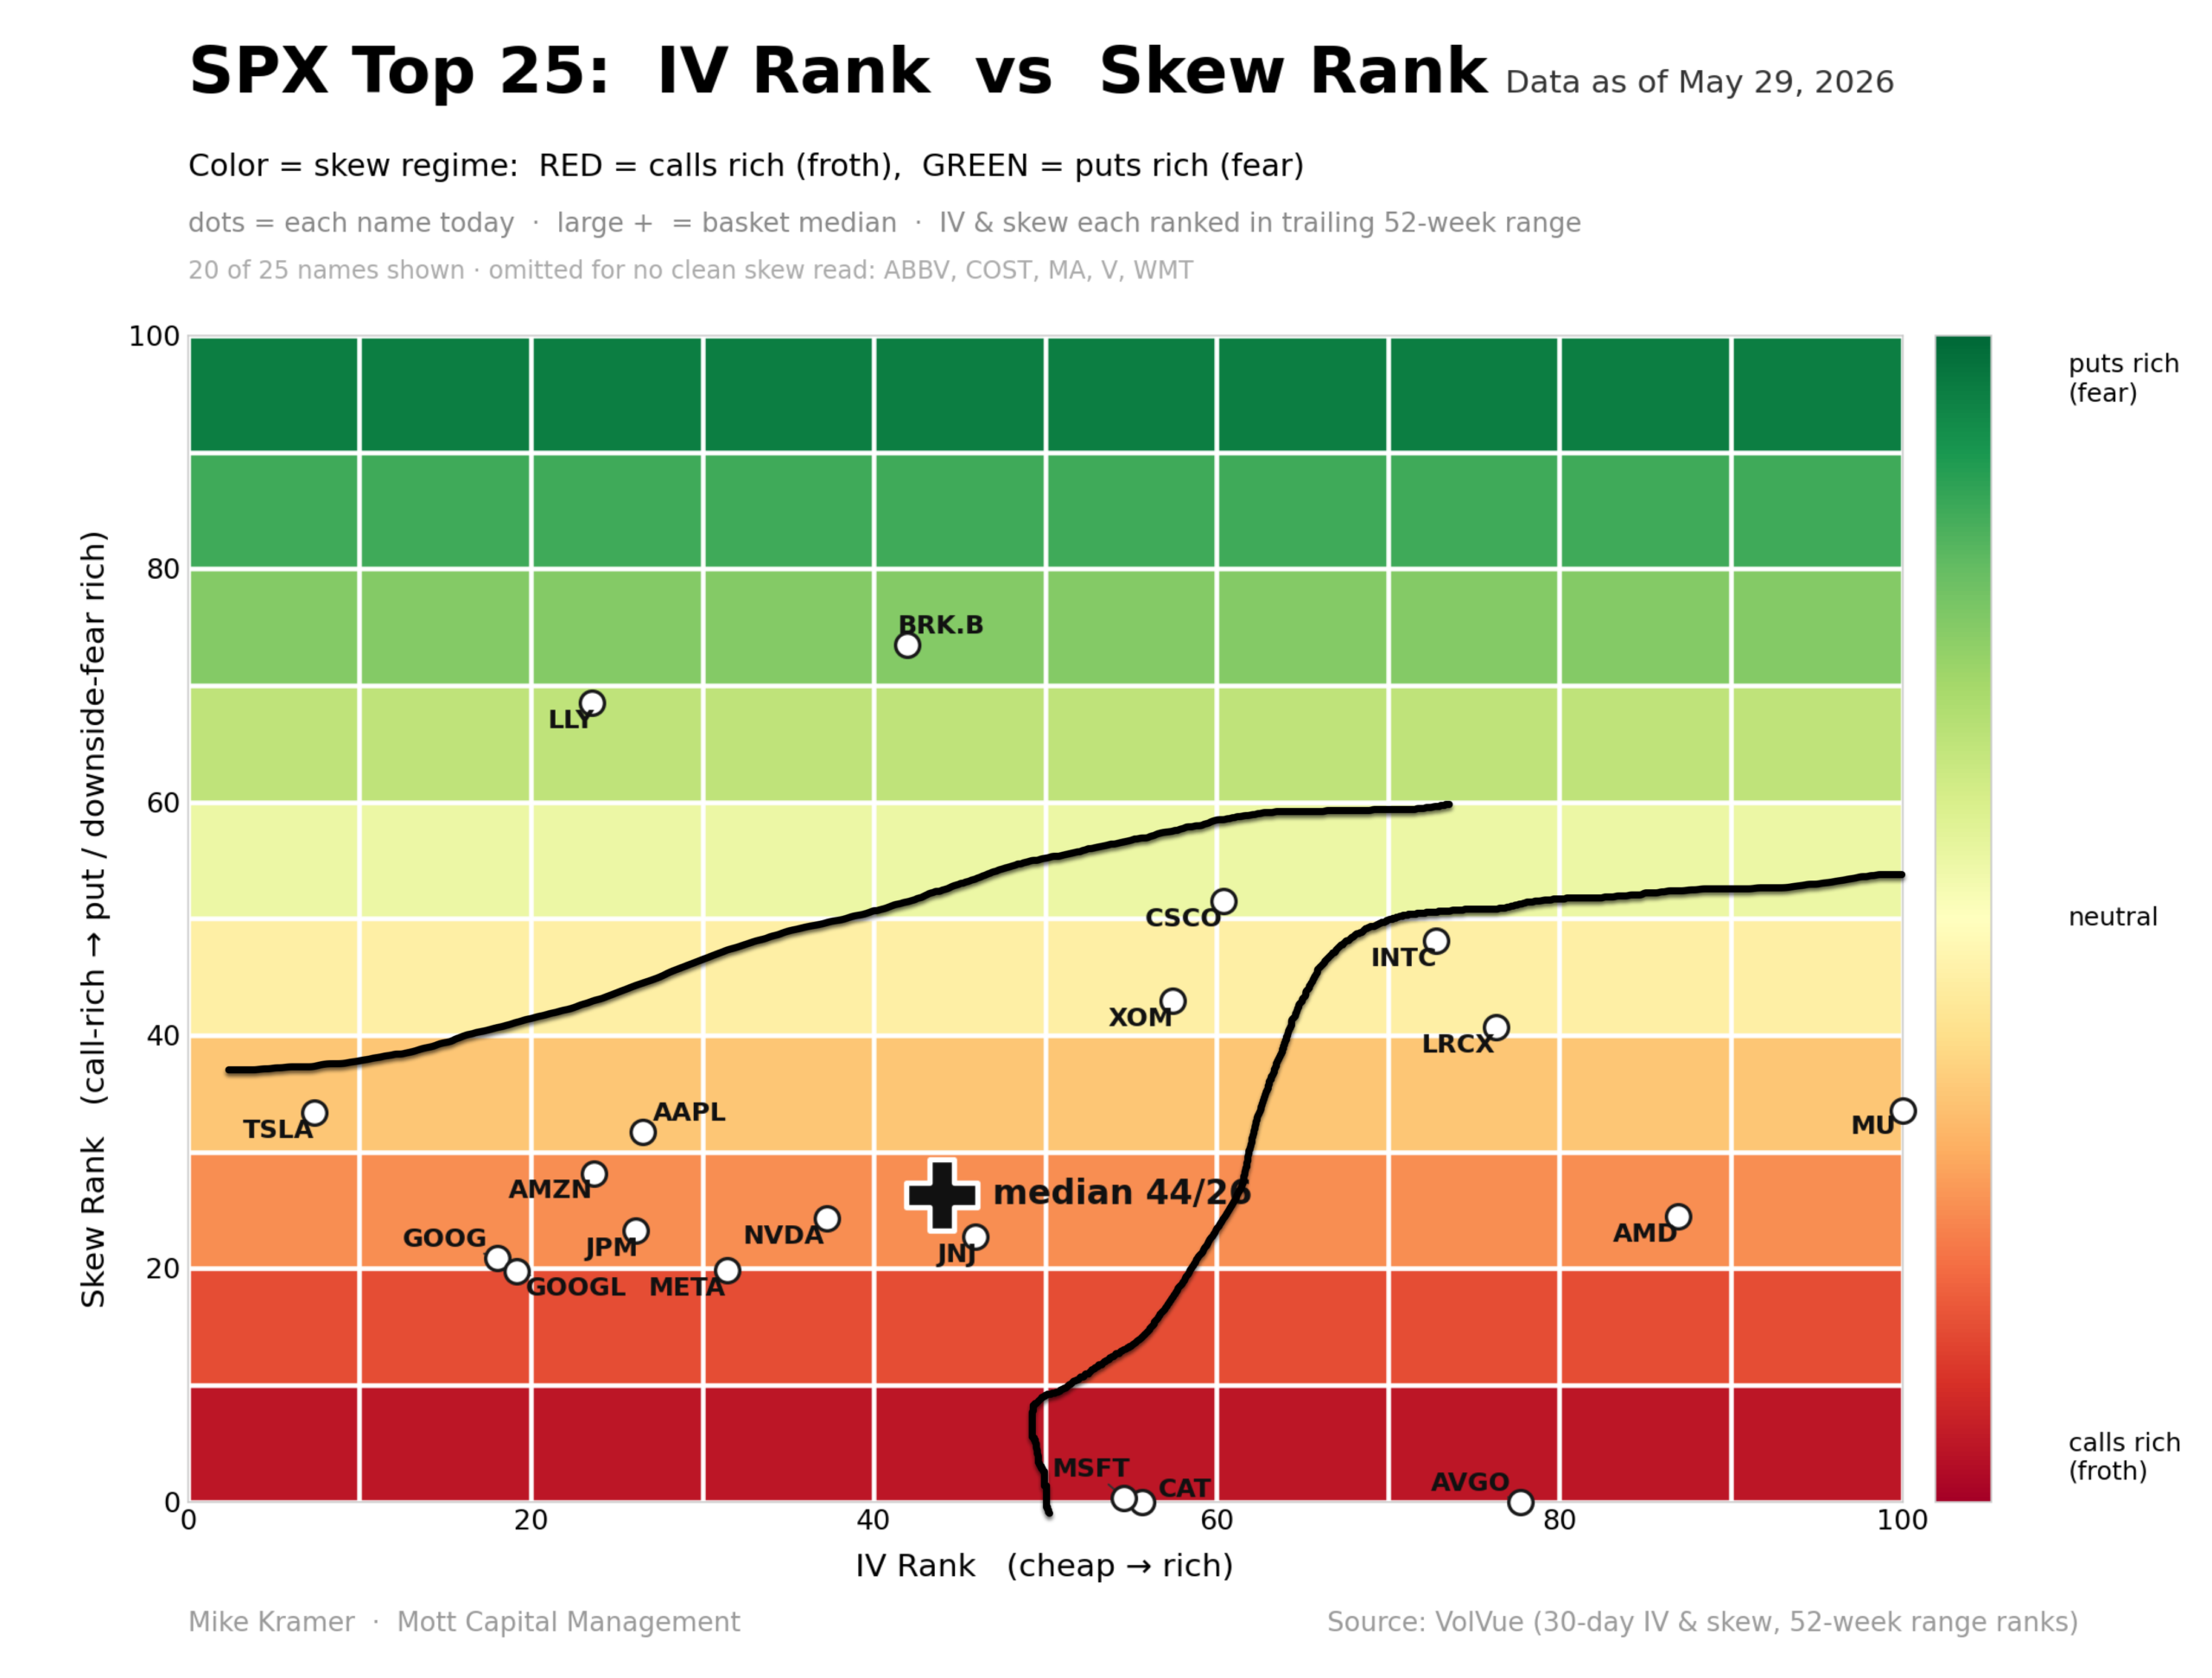
What stands out right now is that the options market appears to be the dominant force, particularly in technology and semiconductor stocks, which should come as no surprise. Oddly enough, Caterpillar also falls into that grouping, having been pulled into the AI complex via the data-center power story, and given the stock’s performance over the past year, that is not especially surprising either.
Ultimately, one would think that if call pricing continues to rise through higher implied volatility, it will become increasingly difficult for these stocks to sustain their rallies. Based on the chart, many already appear to be at, or rapidly approaching, extreme levels. The biggest risk for many of these names is overheating.
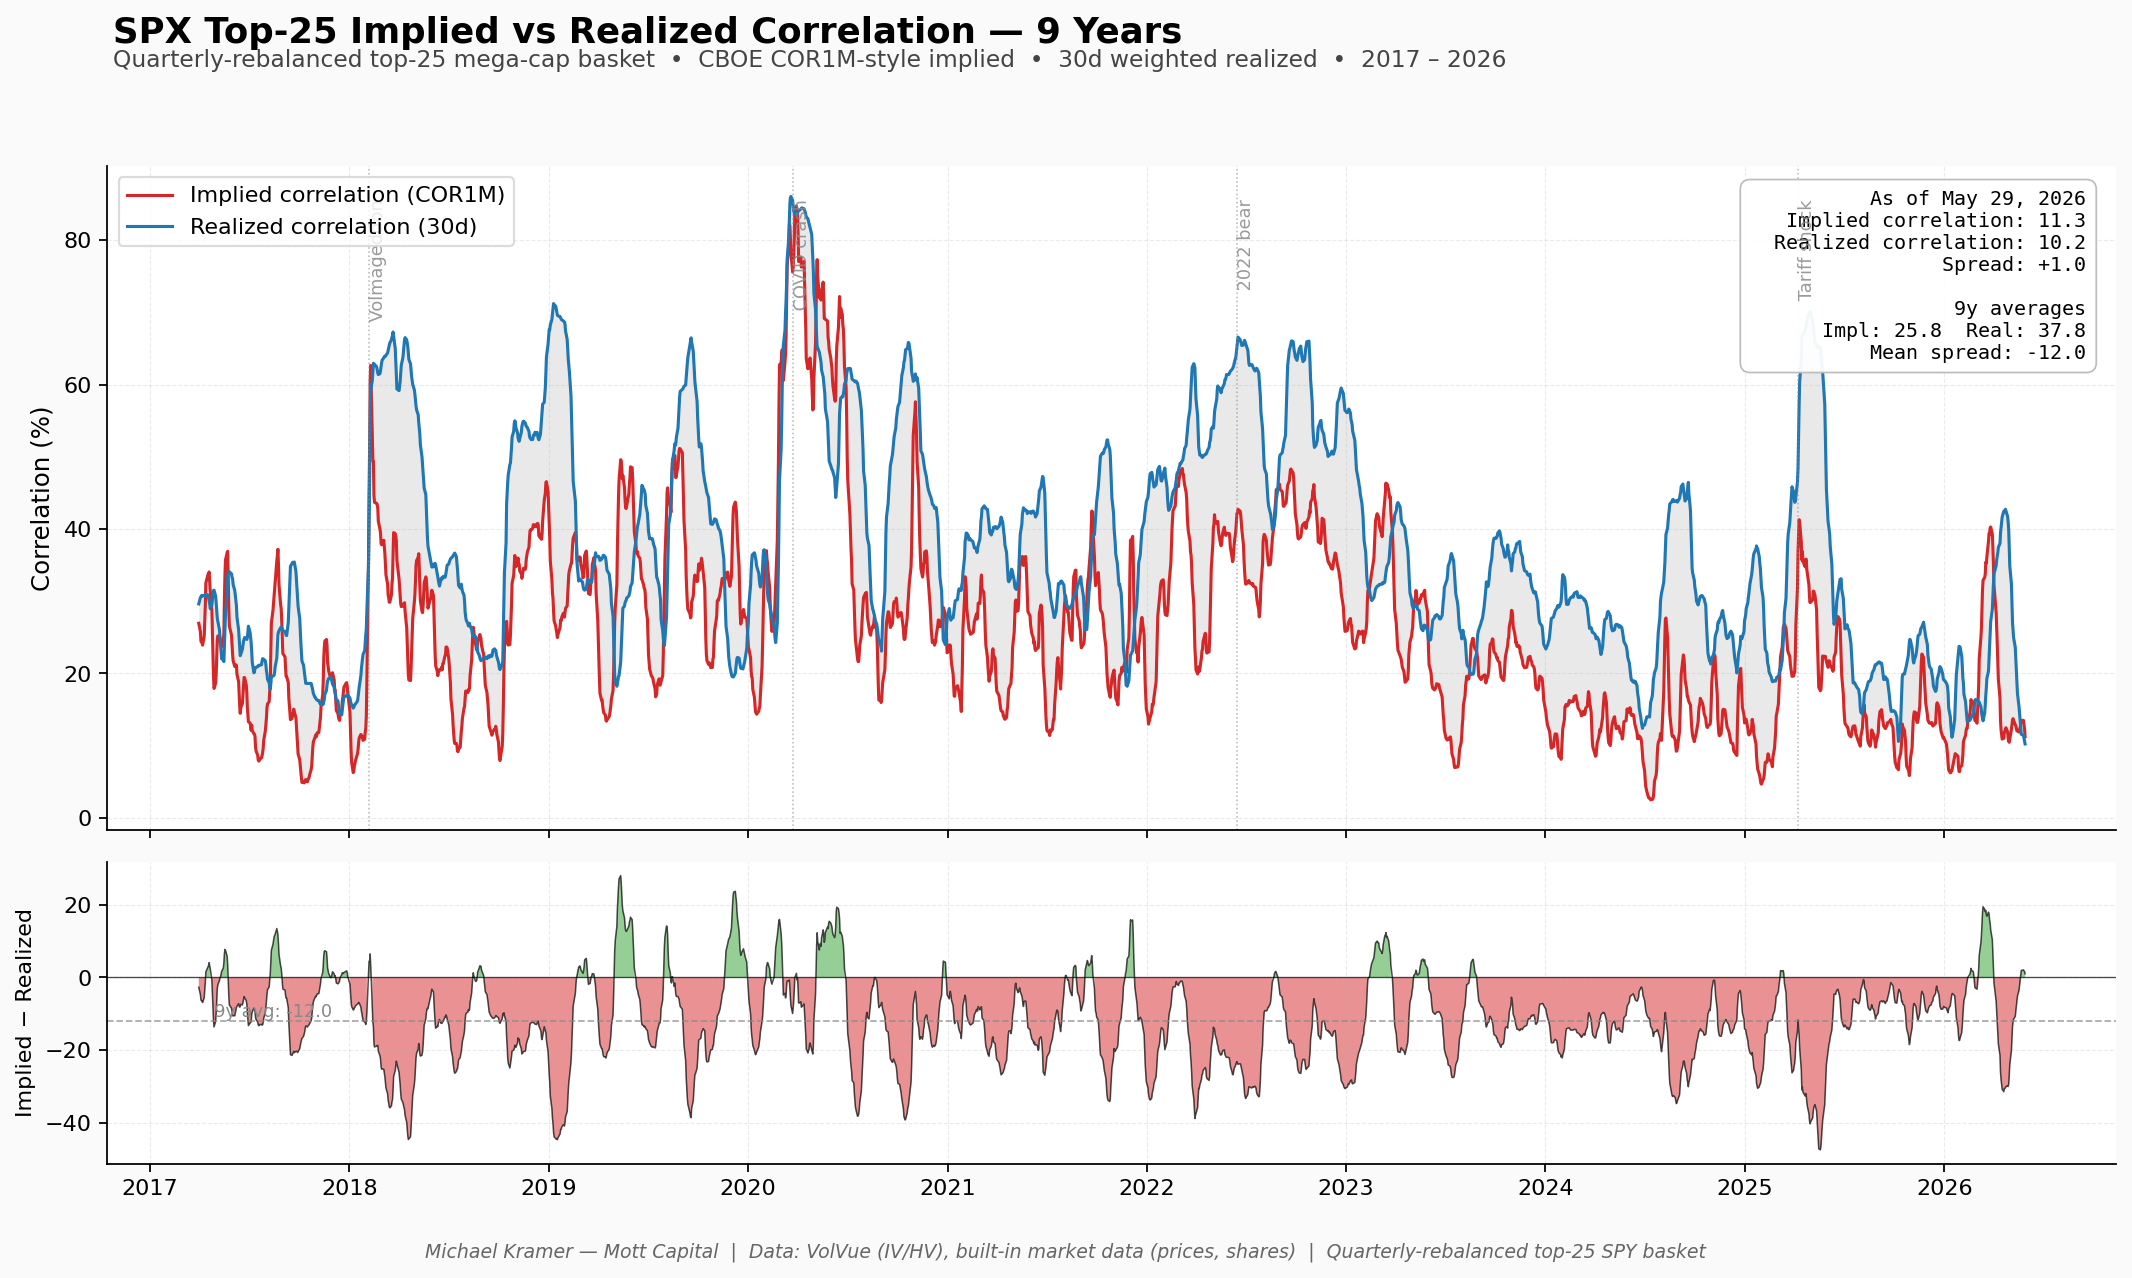
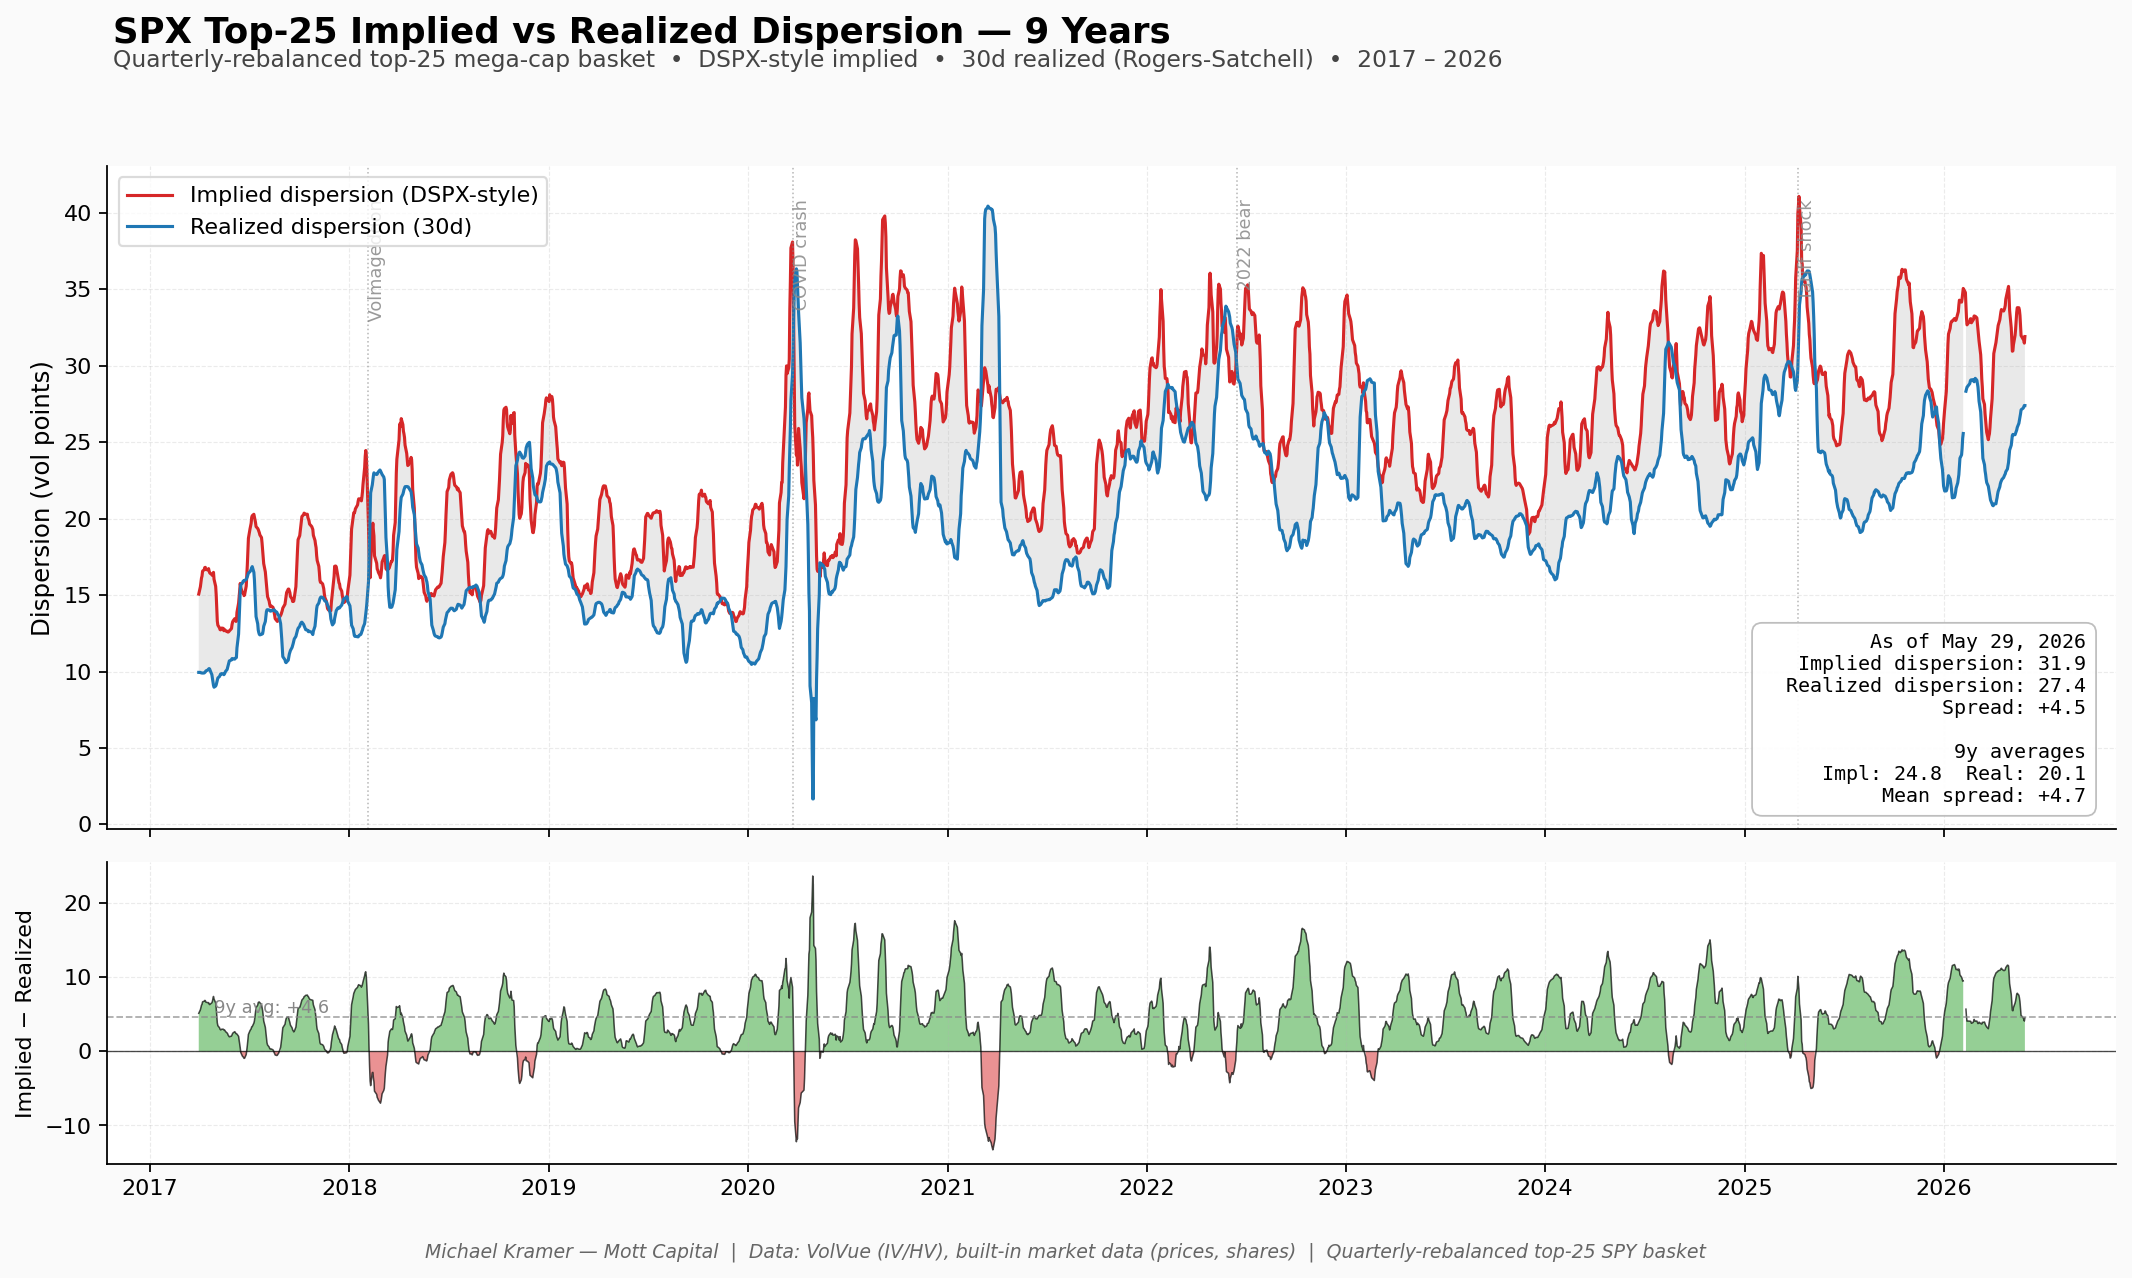
The deeper issue is that the trade that has driven the indexes higher since the end of March — short index vol, long single-name vol via the dispersion trade — is no longer paying. Implied correlations have reached their lower bound, implied dispersion has reached its upper bound, and, when comparing implied and realized measures, the advantage of the trade has collapsed.
Taking the top 25 stocks in the S&P 500 over the past nine years and rebalancing those holdings quarterly, we find that the average implied-to-realized correlation spread is -12, compared with roughly +1 today.
Meanwhile, the same is true on the dispersion side of the equation, where the average spread between implied and realized dispersion is +4.7 points, versus roughly +4.5 points today.
Both spreads are at extreme levels. That would mean traders are likely to begin flipping and move short single-stock volatility and long index-level volatility, and would be evident as the spread between measures such as VIXEQ and the VIX narrows. Right now, that spread is at an extreme, whether measured in absolute terms or relative terms.
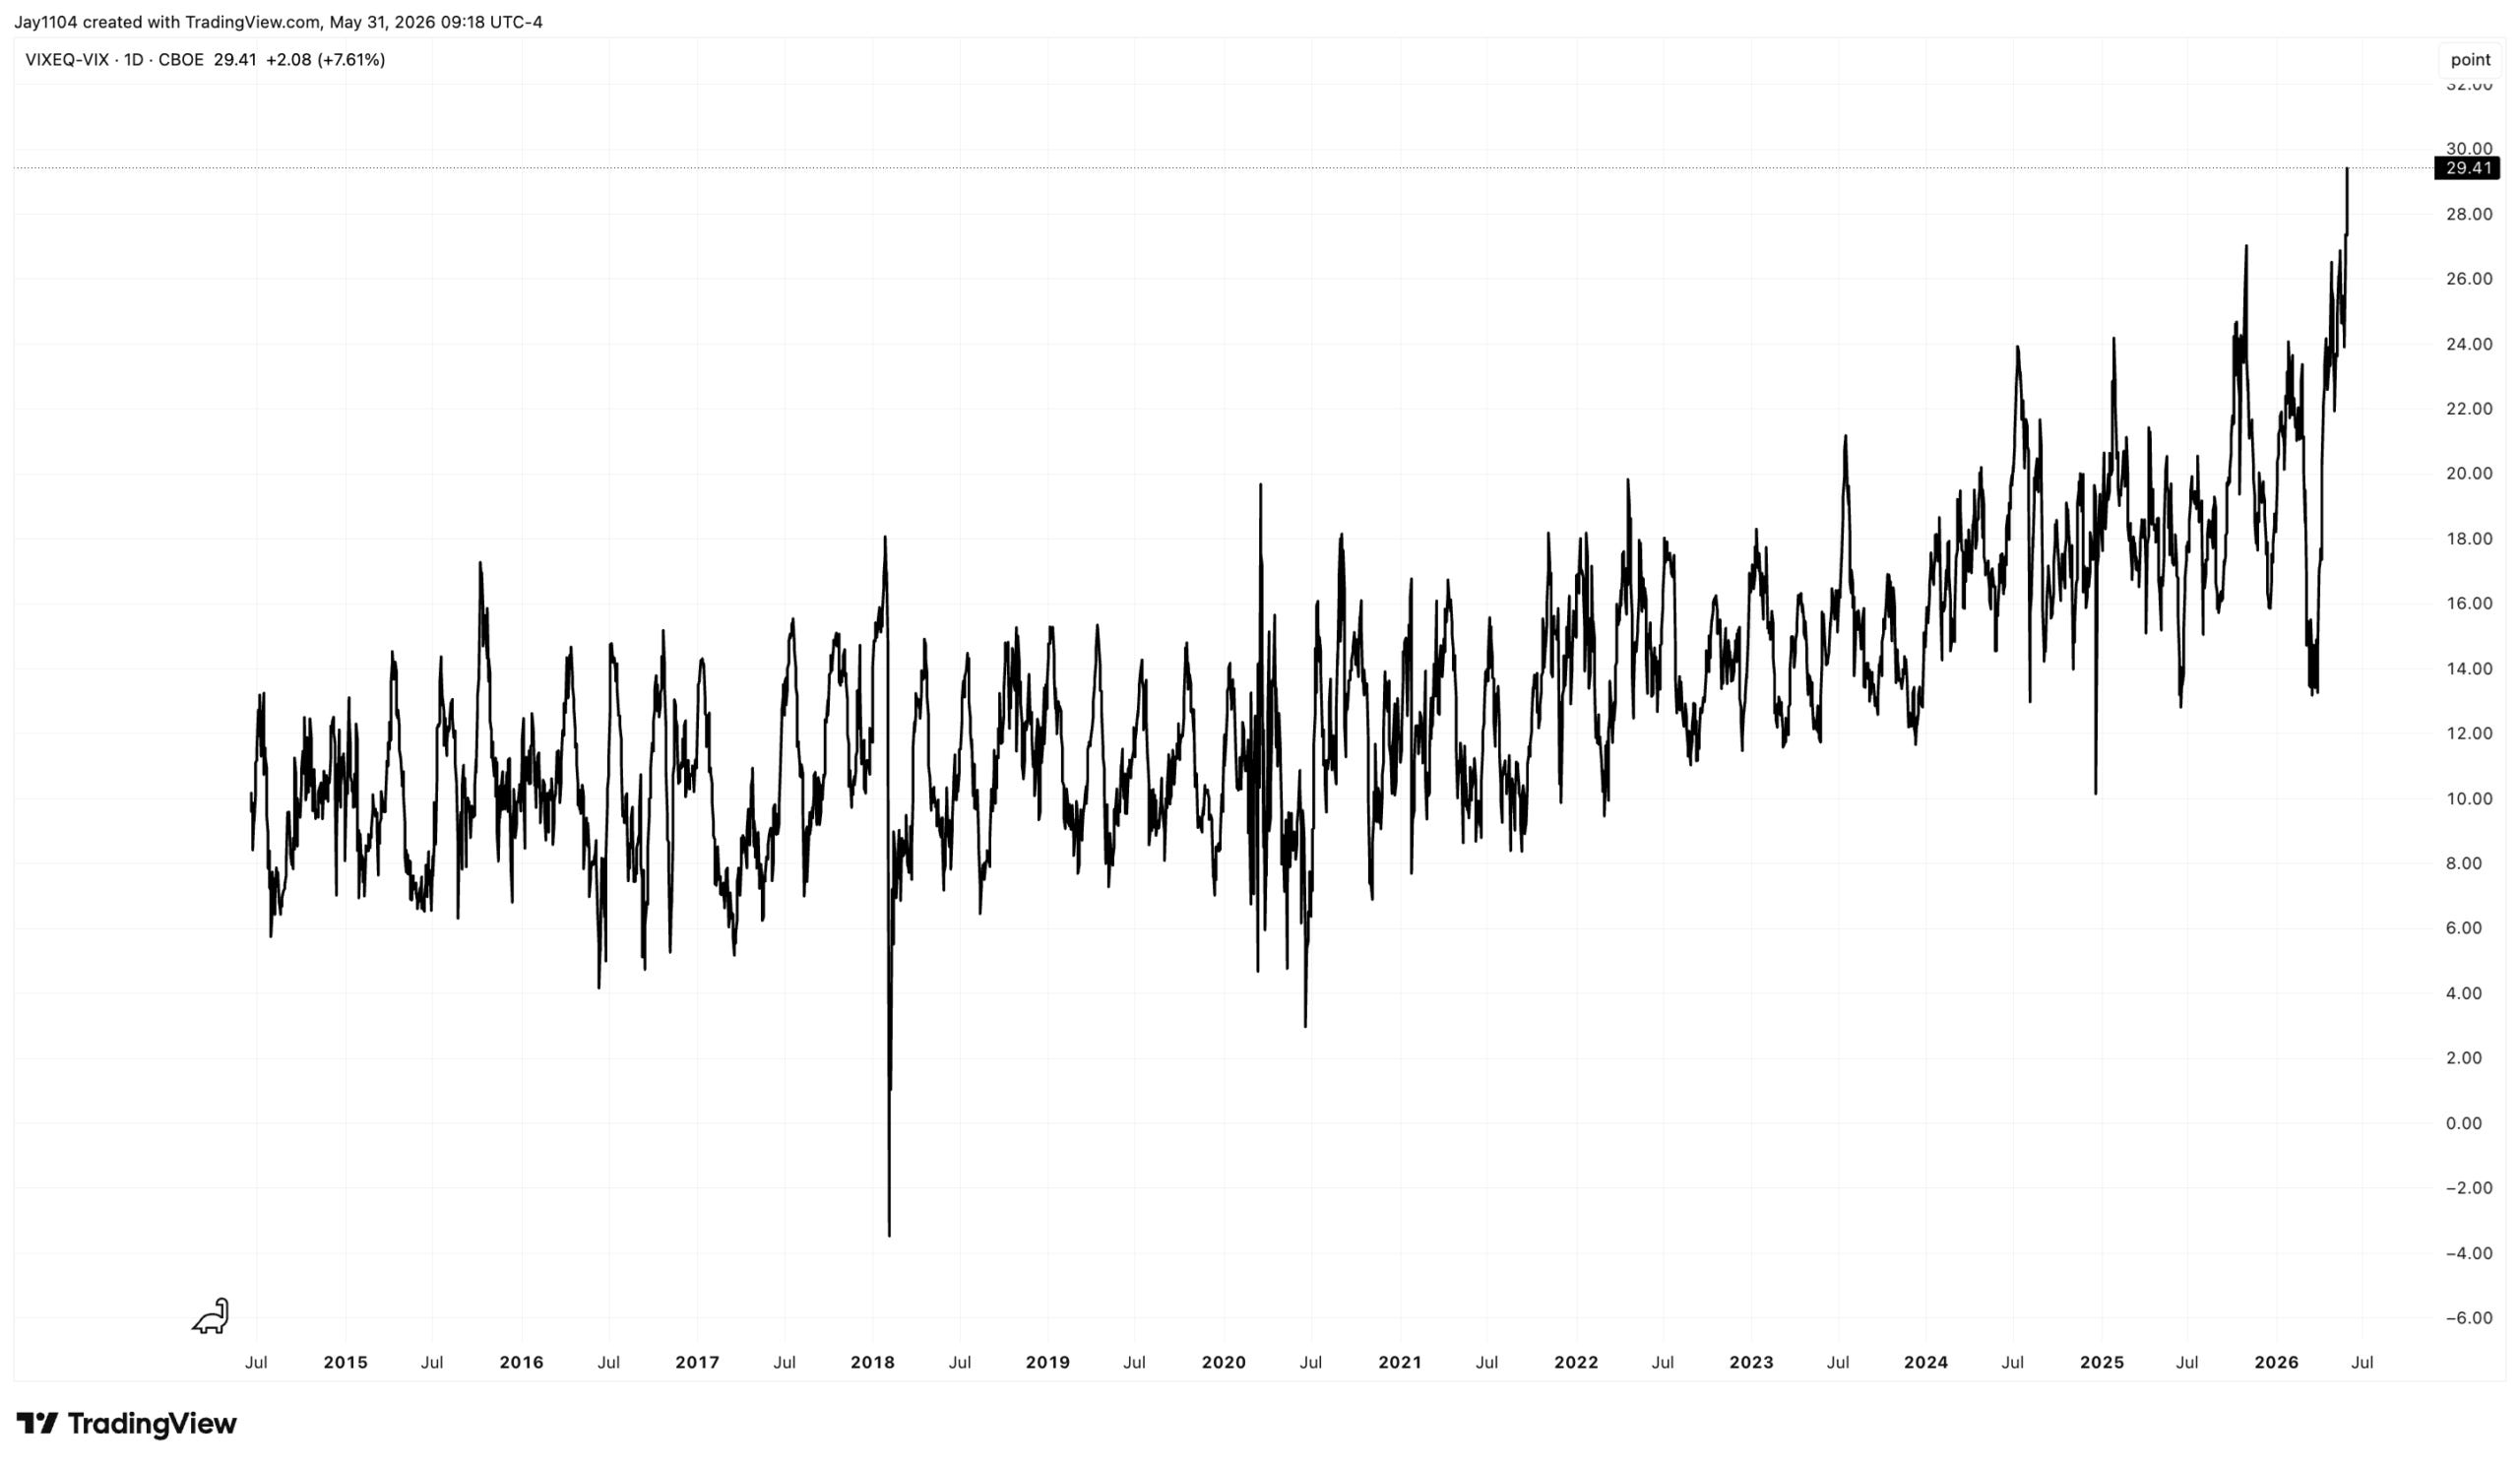
The ratio is also at an all-time high, but perhaps more interesting is that it highlights the most comparable periods more clearly: early 2018, mid-2024, and mid-2025. Each of those periods was followed by a pullback in the S&P 500 of roughly 8-10%. I may just need a catalyst to happen again.
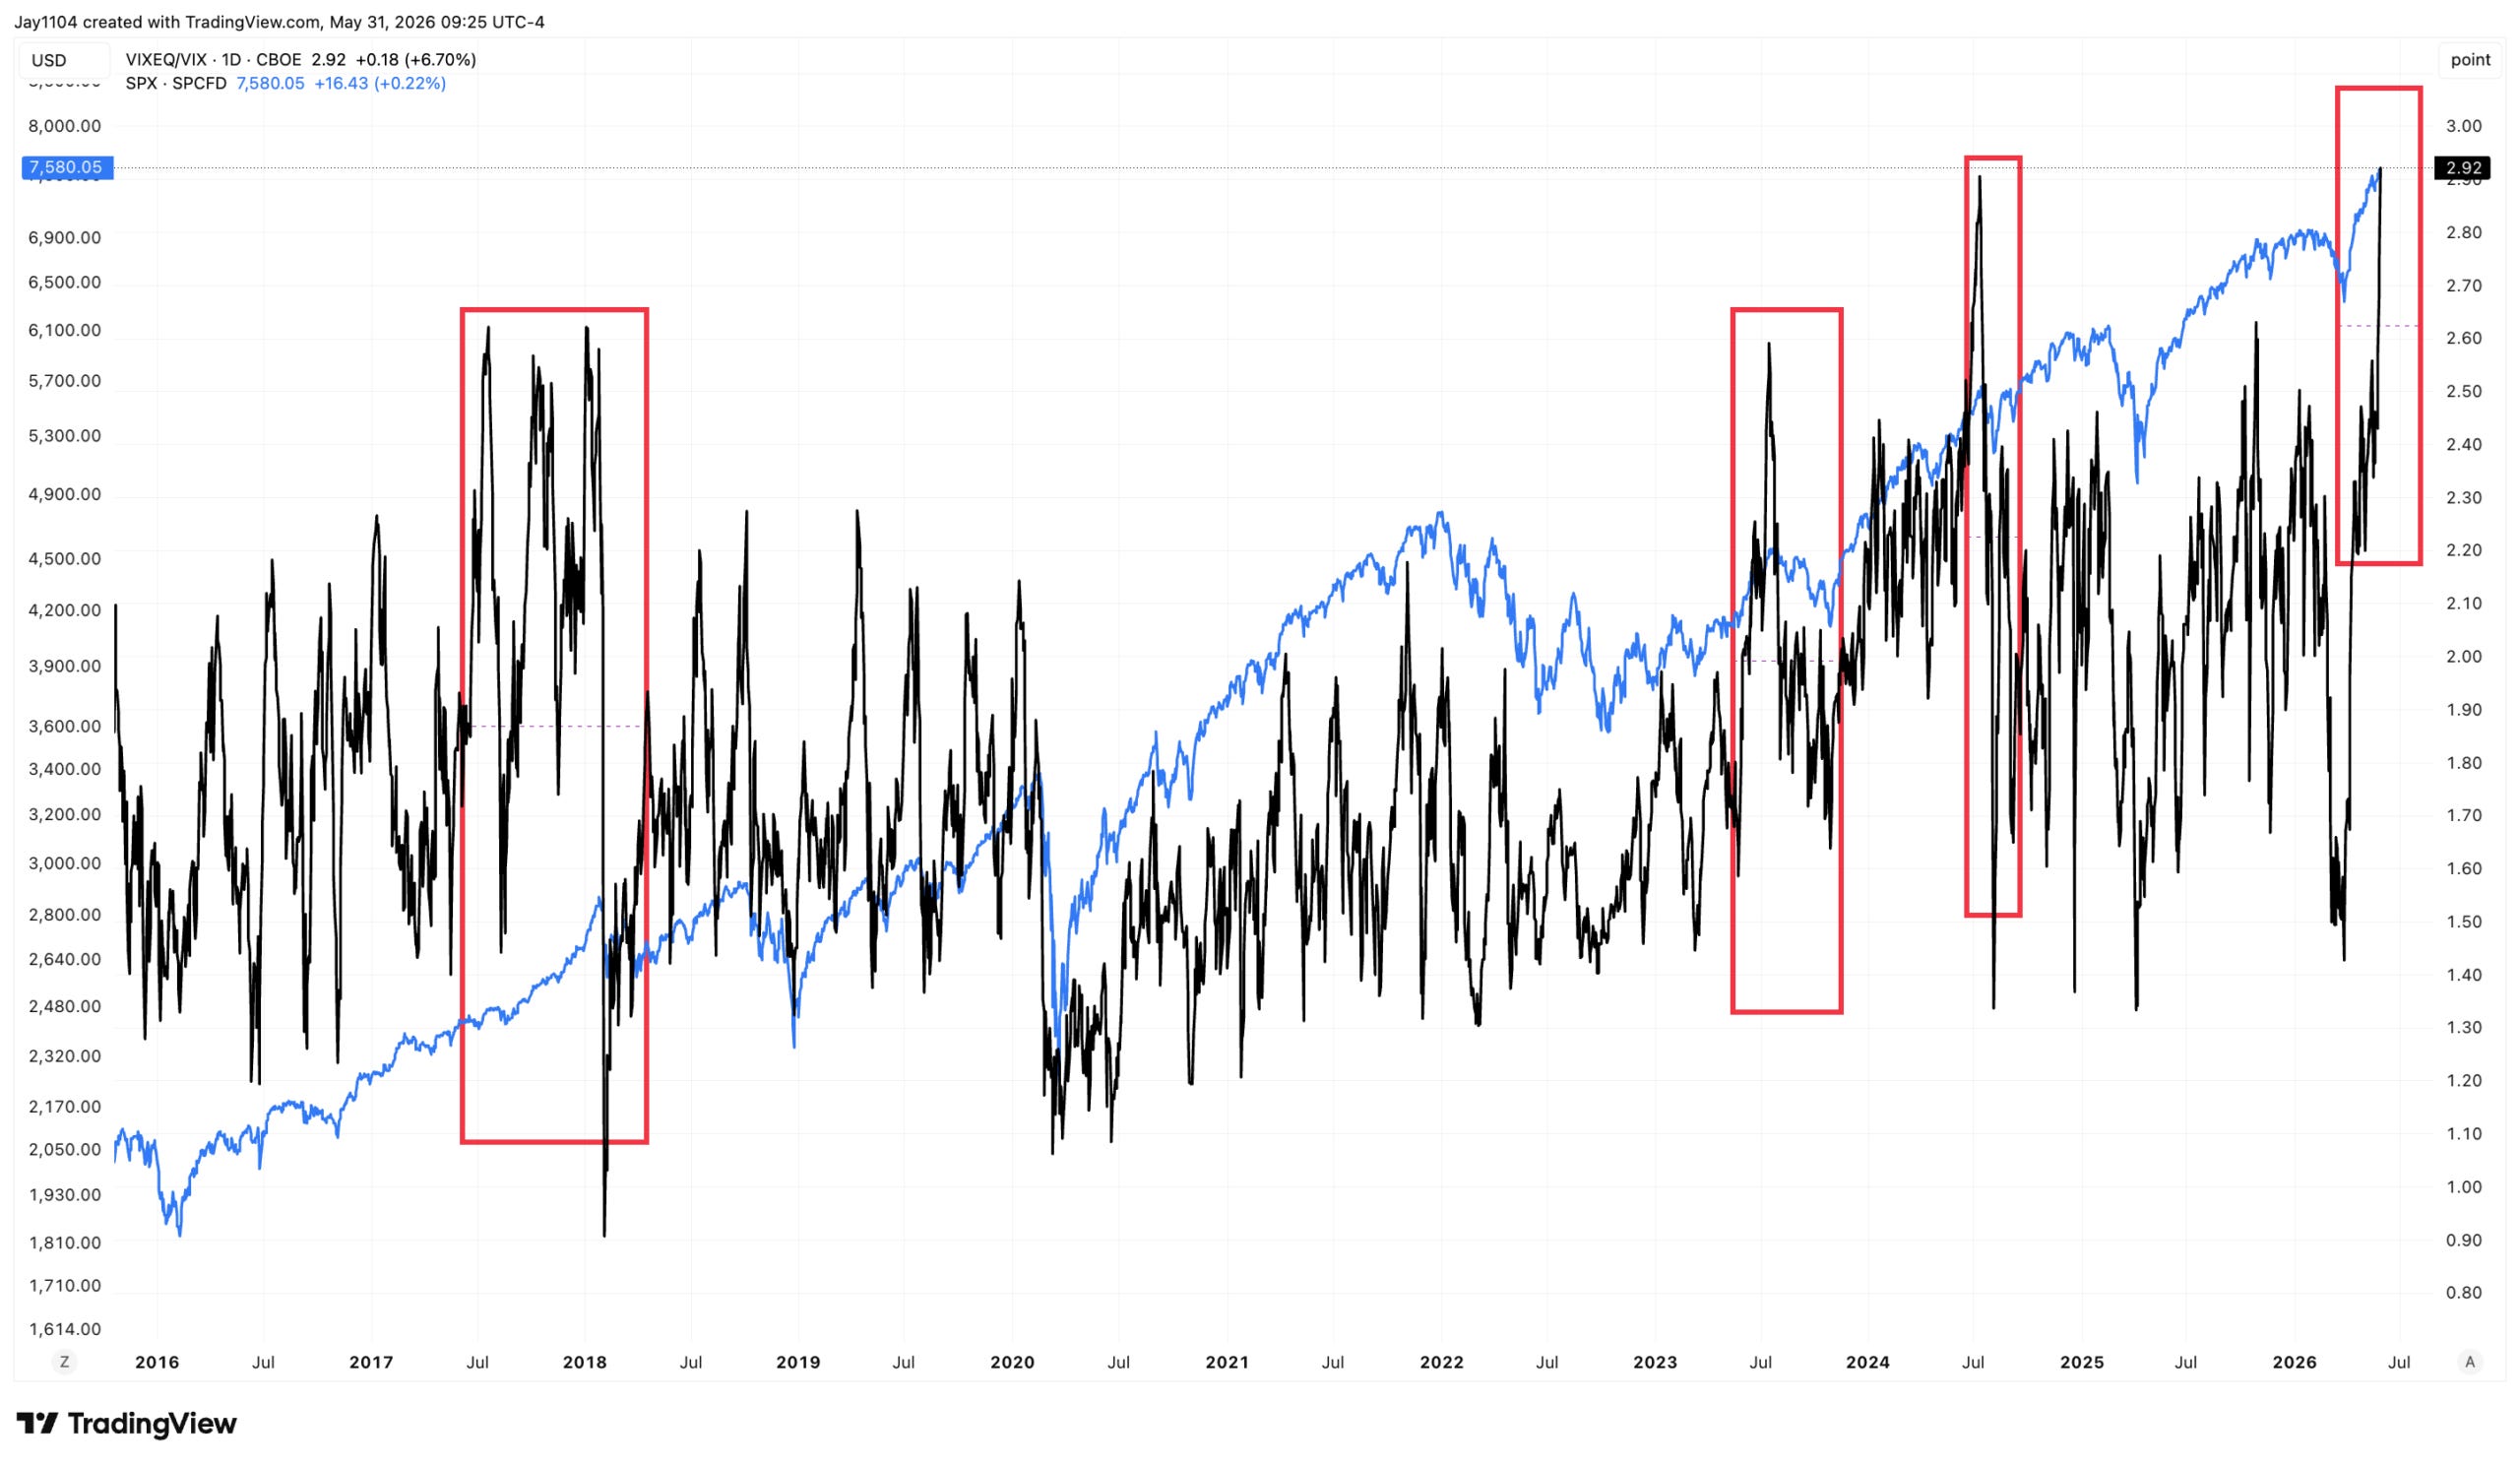
When you look at the economic calendar this week, the upcoming slate of central bank meetings over the next two weeks, and the ongoing geopolitical developments, there appears to be no shortage of potential catalysts, any one of which could trigger an unwind. Given the positioning and technical levels in some of the market’s most important stocks, the opportunities for a trigger event seem more than ample.
-Mike
Glossary by ChatGPT
ADP Employment Report — A monthly private-sector payroll report often used as a preview of labor market trends ahead of official government employment data.
BLS Jobs Report — The U.S. Bureau of Labor Statistics employment report that provides data on payrolls, unemployment, wages, and labor force participation.
Dispersion Trade — A strategy that typically involves shorting index volatility while buying volatility on individual stocks to profit from differences in their price movements.
Gamma — An options metric that measures the rate of change in an option’s delta as the underlying asset price moves.
Implied Correlation — The market-implied degree to which stocks within an index are expected to move together.
Implied Dispersion — A measure derived from options markets that reflects the expected variation in performance among individual stocks.
Implied Volatility — The market’s expectation of future price fluctuations embedded in option prices.
ISM Report — A monthly survey of business activity that provides insight into economic conditions in the manufacturing and services sectors.
Realized Correlation — The actual historical degree to which assets have moved together over a specific period.
Realized Dispersion — The actual observed variation in returns among a group of stocks over a given period.
S&P 500 — A market-capitalization-weighted index tracking 500 leading U.S. publicly traded companies.
VIX — The CBOE Volatility Index, widely viewed as a measure of expected volatility for the S&P 500.
VIXEQ — A volatility index based on S&P 500 constituent stock options that provides a measure of expected single-stock volatility.
Disclosure
This report contains independent commentary to be used for informational and educational purposes only. Michael Kramer is a member and investment adviser representative with Mott Capital Management. Mr. Kramer is not affiliated with this company and does not serve on the board of any related company that issued this stock. All opinions and analyses presented by Michael Kramer in this analysis or market report are solely Michael Kramer’s views. Readers should not treat any opinion, viewpoint, or prediction expressed by Michael Kramer as a specific solicitation or recommendation to buy or sell a particular security or follow a particular strategy. Michael Kramer’s analyses are based upon information and independent research that he considers reliable, but neither Michael Kramer nor Mott Capital Management guarantees its completeness or accuracy, and it should not be relied upon as such. Michael Kramer is not under any obligation to update or correct any information presented in his analyses. Mr. Kramer’s statements, guidance, and opinions are subject to change without notice. Past performance is not indicative of future results. Neither Michael Kramer nor Mott Capital Management guarantees any specific outcome or profit. You should be aware of the real risk of loss in following any strategy or investment commentary presented in this analysis. Strategies or investments discussed may fluctuate in price or value. Investments or strategies mentioned in this analysis may not be suitable for you. This material does not consider your particular investment objectives, financial situation, or needs and is not intended as a recommendation appropriate for you. You must make an independent decision regarding investments or strategies in this analysis. Upon request, the advisor will provide a list of all recommendations made during the past twelve months. Before acting on information in this analysis, you should consider whether it is suitable for your circumstances and strongly consider seeking advice from your own financial or investment adviser to determine the suitability of any investment.