
Credit Markets Raise Questions Equity Investors Choose To Ignore

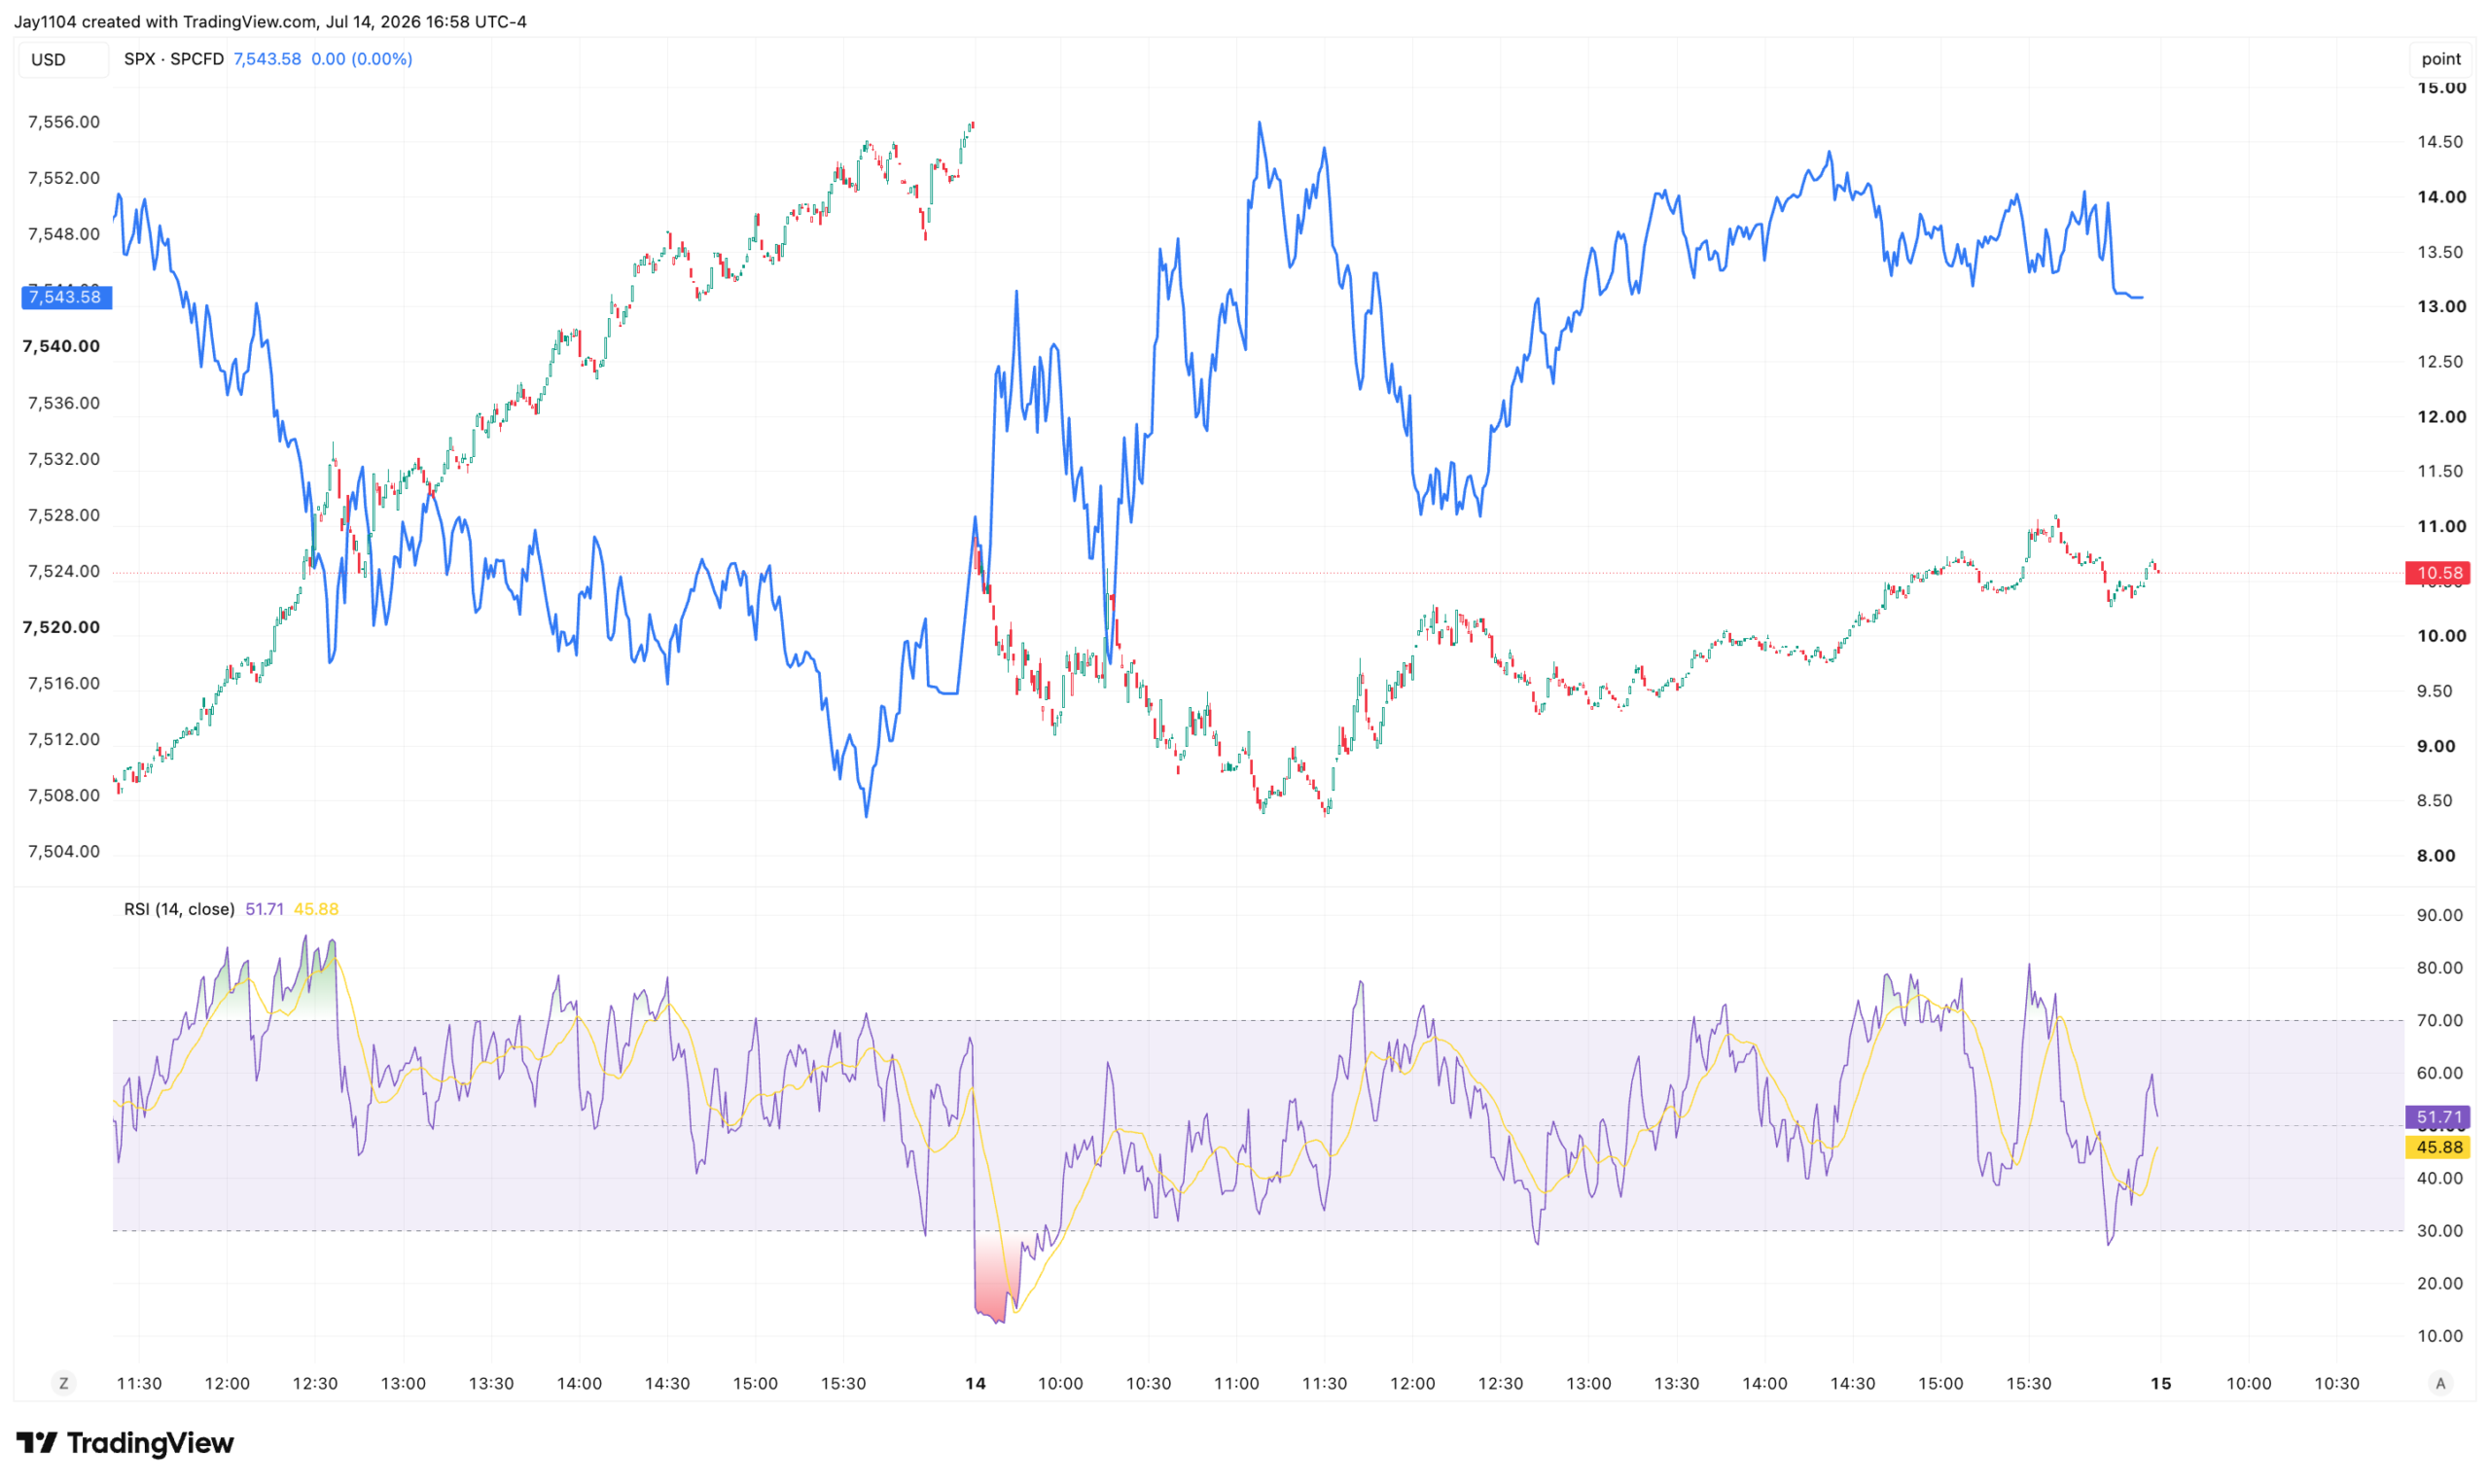
Stocks finished the day higher, with the S&P 500 up 38 basis points. However, today’s move appeared to be driven more by a decline in implied volatility than by anything else. The one-day VIX fell four points to close at 10.5 after rising to nearly 15 on July 13.

The increase in volatility reflected uncertainty surrounding this morning’s CPI report and Kevin Warsh’s testimony before the House. Once the market moved past the opening and implied volatility in the one-day VIX fell sharply, stocks did very little for the rest of the session, trading mostly sideways after the initial move. At this point, the effect of the decline in implied volatility has largely worn off.
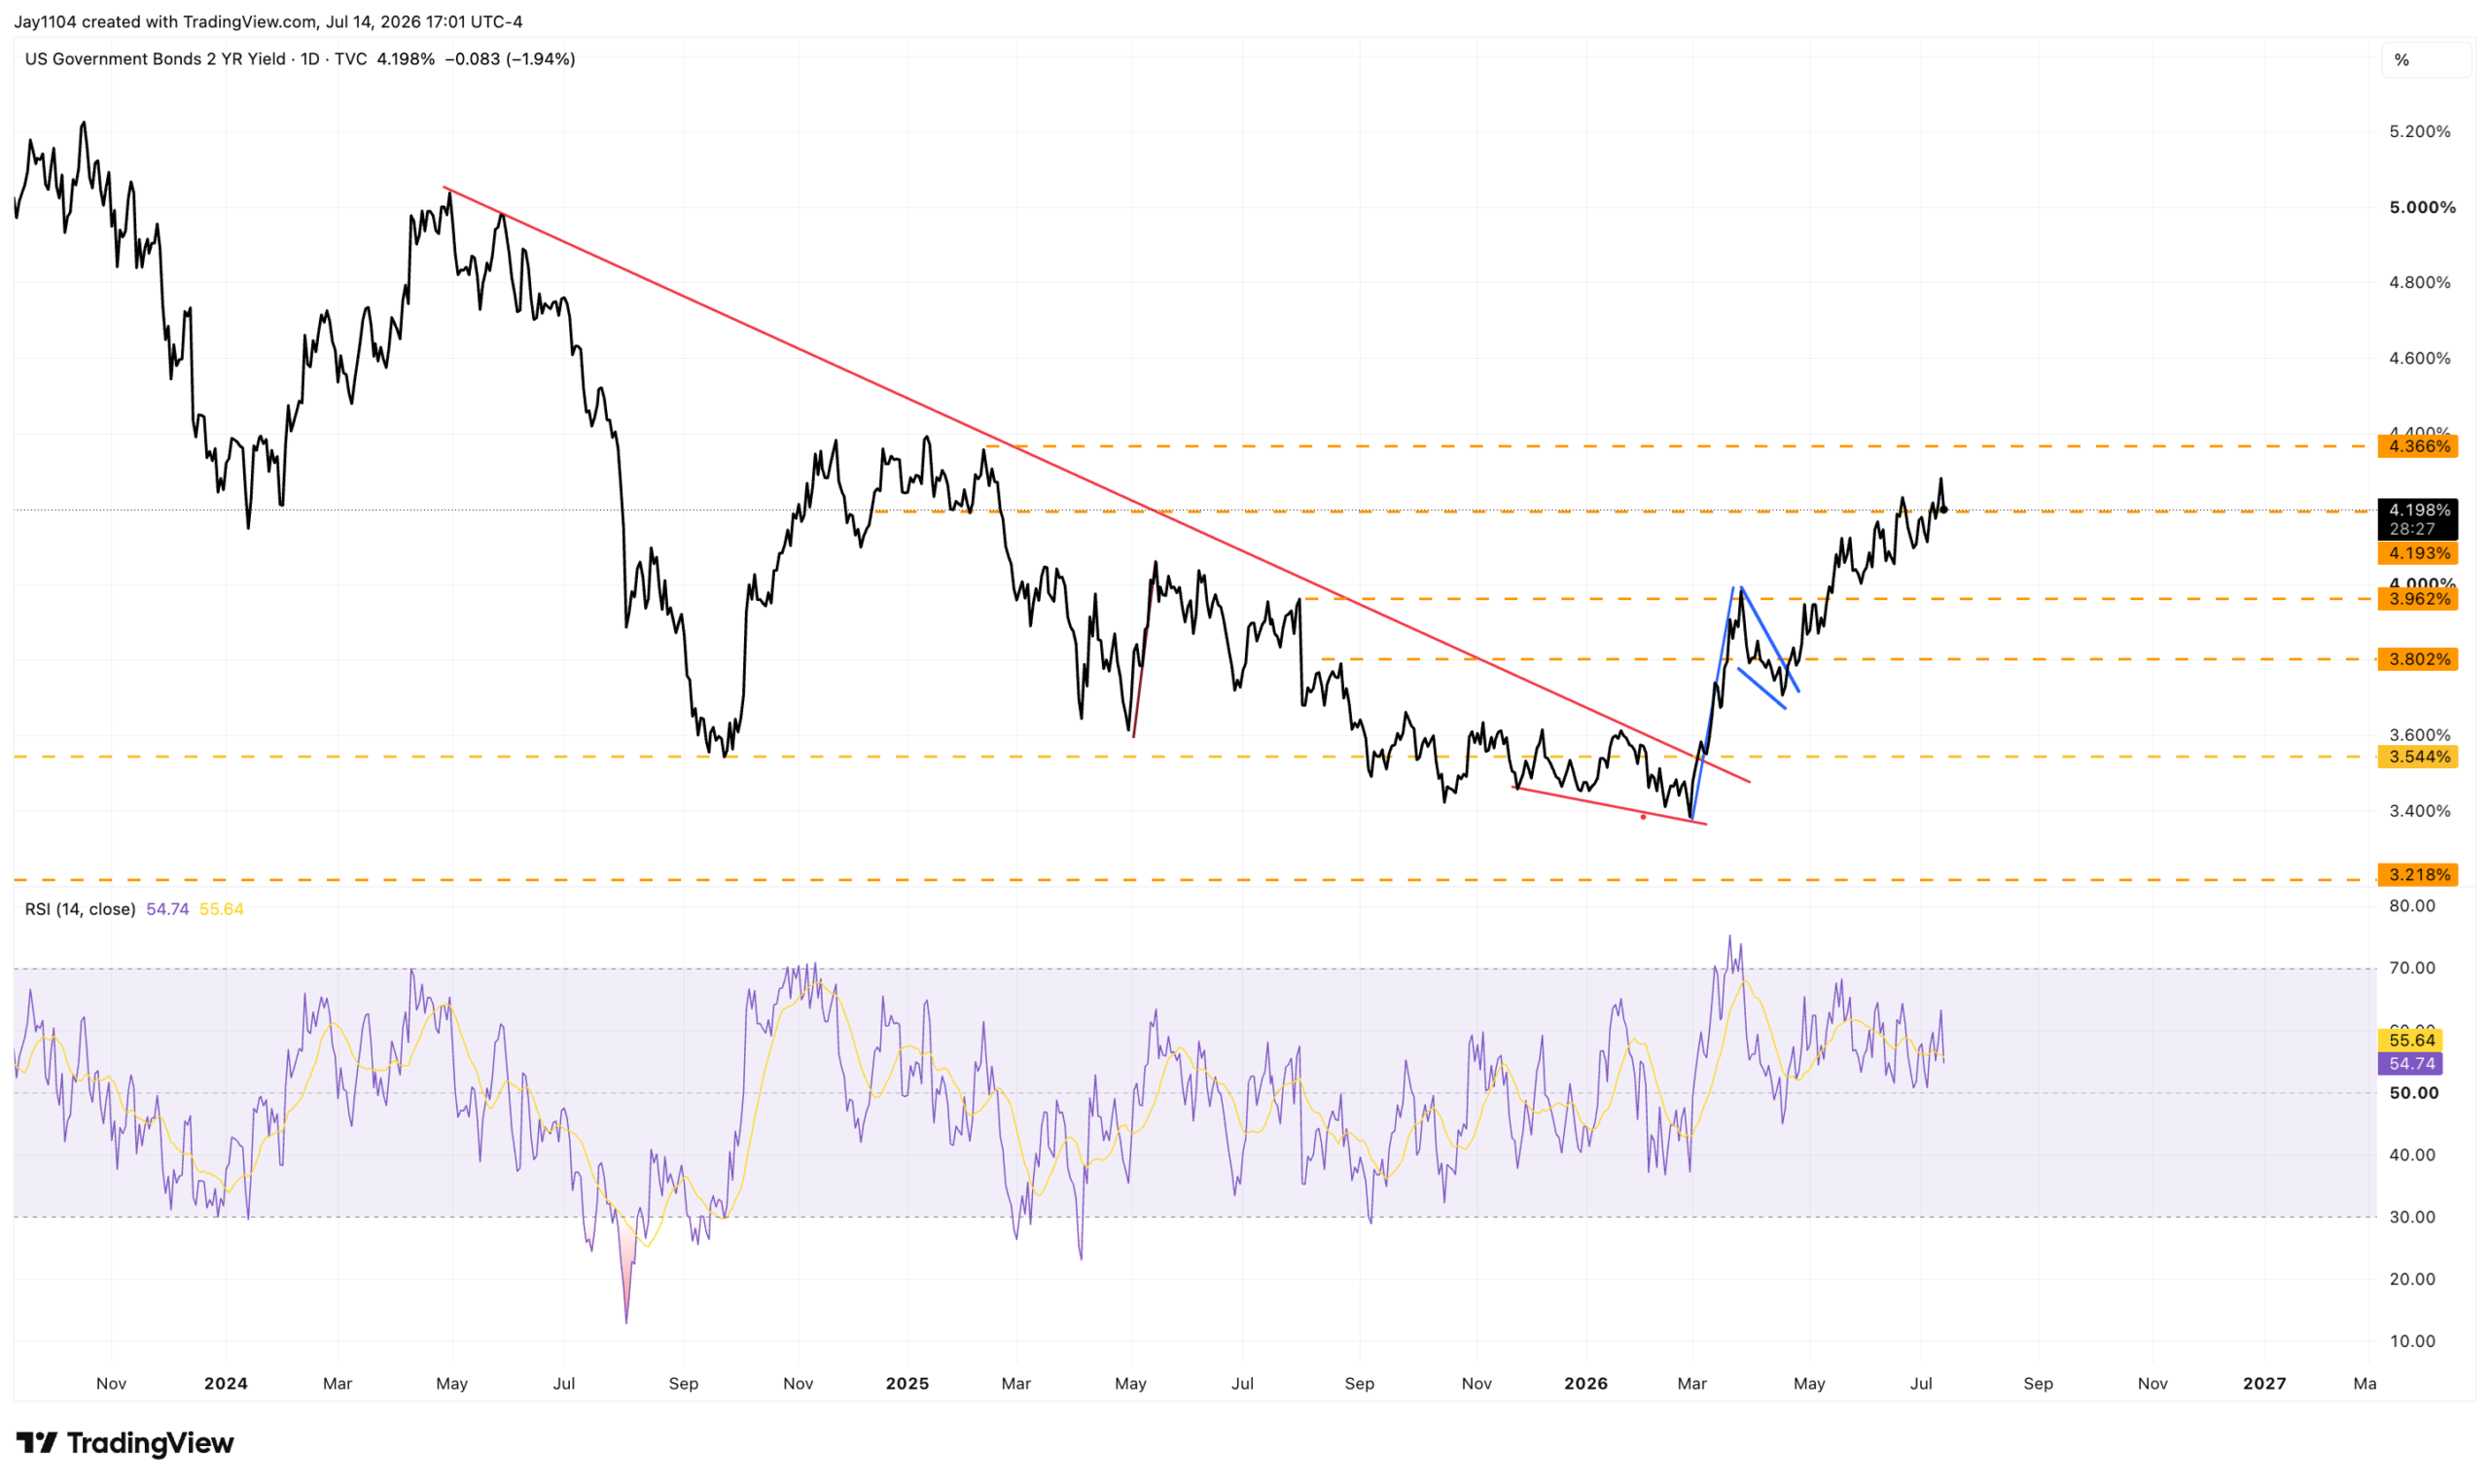
With the CPI report coming in cooler than expected on both the headline and core measures, it was not surprising to see Treasury yields fall. The decline was particularly sharp at the front end of the curve, with the two-year yield losing eight basis points to close at around 4.20%.
However, Fed Chair Kevin Warsh’s comments during today’s House hearing suggested that he believes inflation remains too high and that more must be done to bring it back to the Fed’s target. His remarks ultimately sounded fairly hawkish, raising questions about whether the market has adequately priced in the possibility of future rate hikes.
Even after falling to 4.20% today, the two-year yield is merely sitting at support. Now that it has broken above its previous resistance level, it still has room to move significantly higher—potentially toward the 4.35%-4.40% range. It is also possible that the Fed will need to raise rates again to finish the job that Jay Powell was never able to complete.
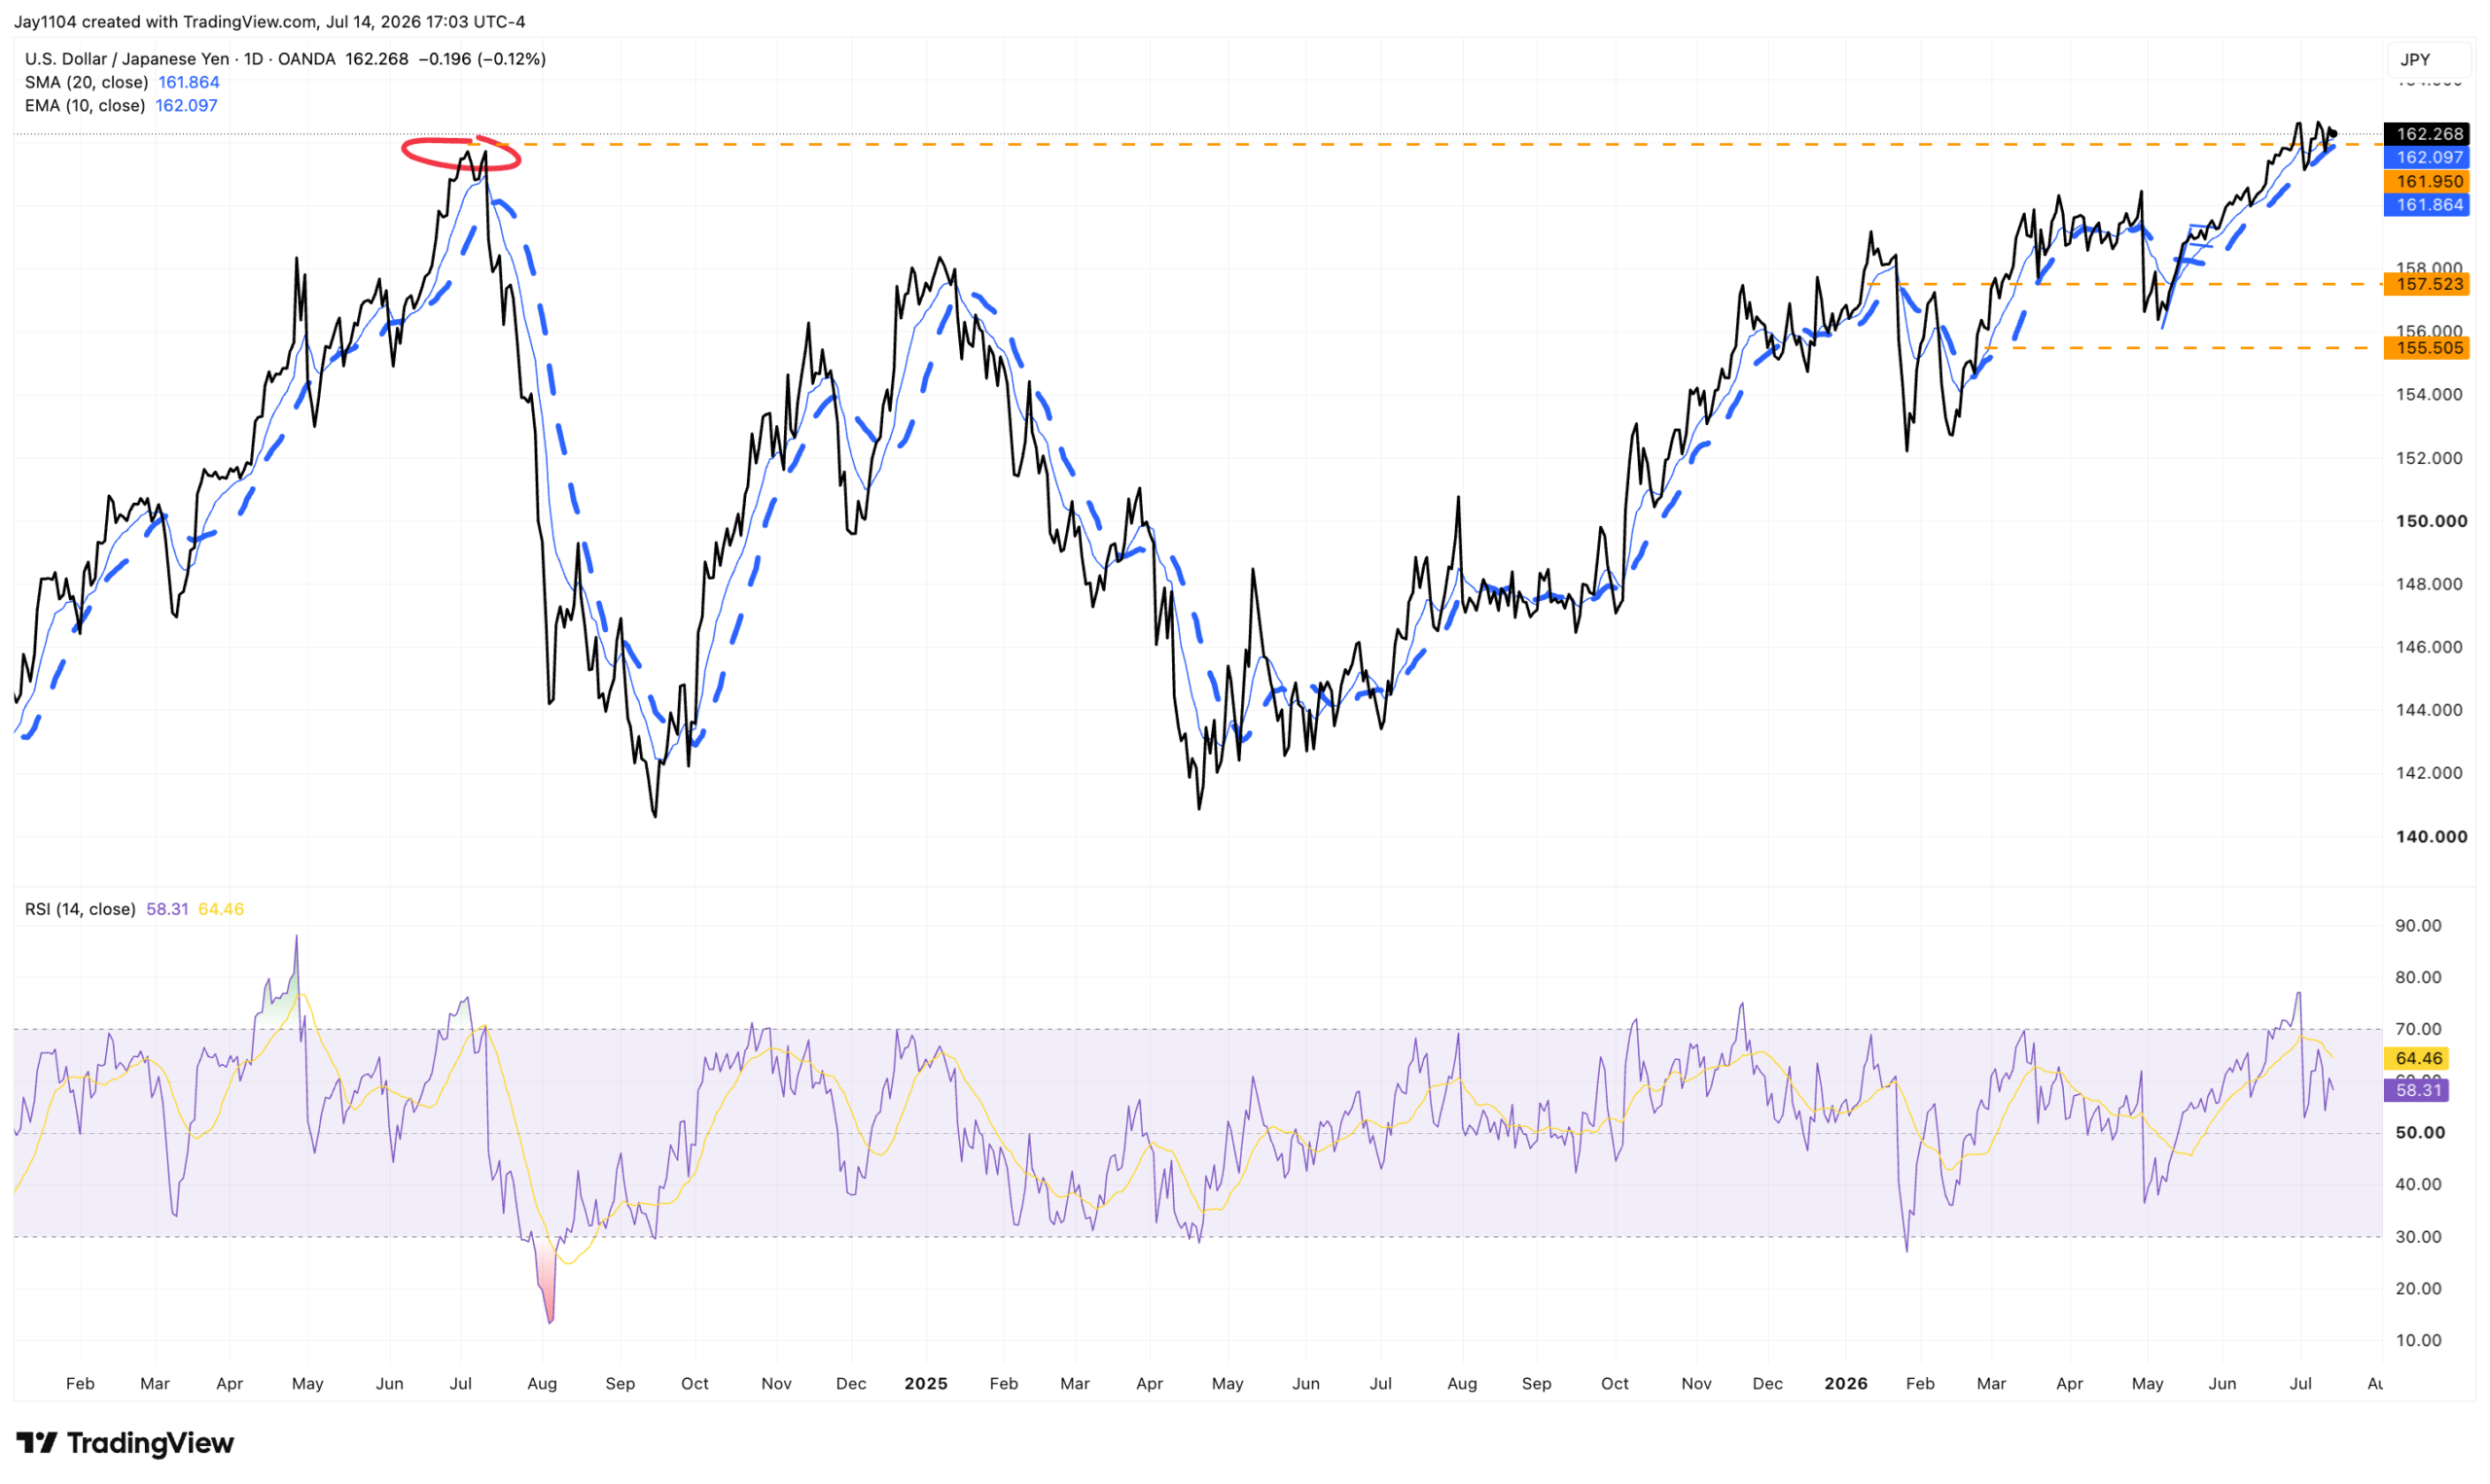
Even with the weaker-than-expected CPI report, you would never know it from the Japanese yen. The currency strengthened by just 12 basis points on the day, with USD/JPY closing at around 162.25.
The yen still appears vulnerable to significant further weakness. So far, very little has been done to persuade investors to change course, and the path of least resistance continues to point toward a weaker yen.
USD/JPY has also been hugging its 10-day and 20-day simple moving averages. A breakout above the 162.50 area could send the pair toward 166—a level not seen since the mid-1980s.
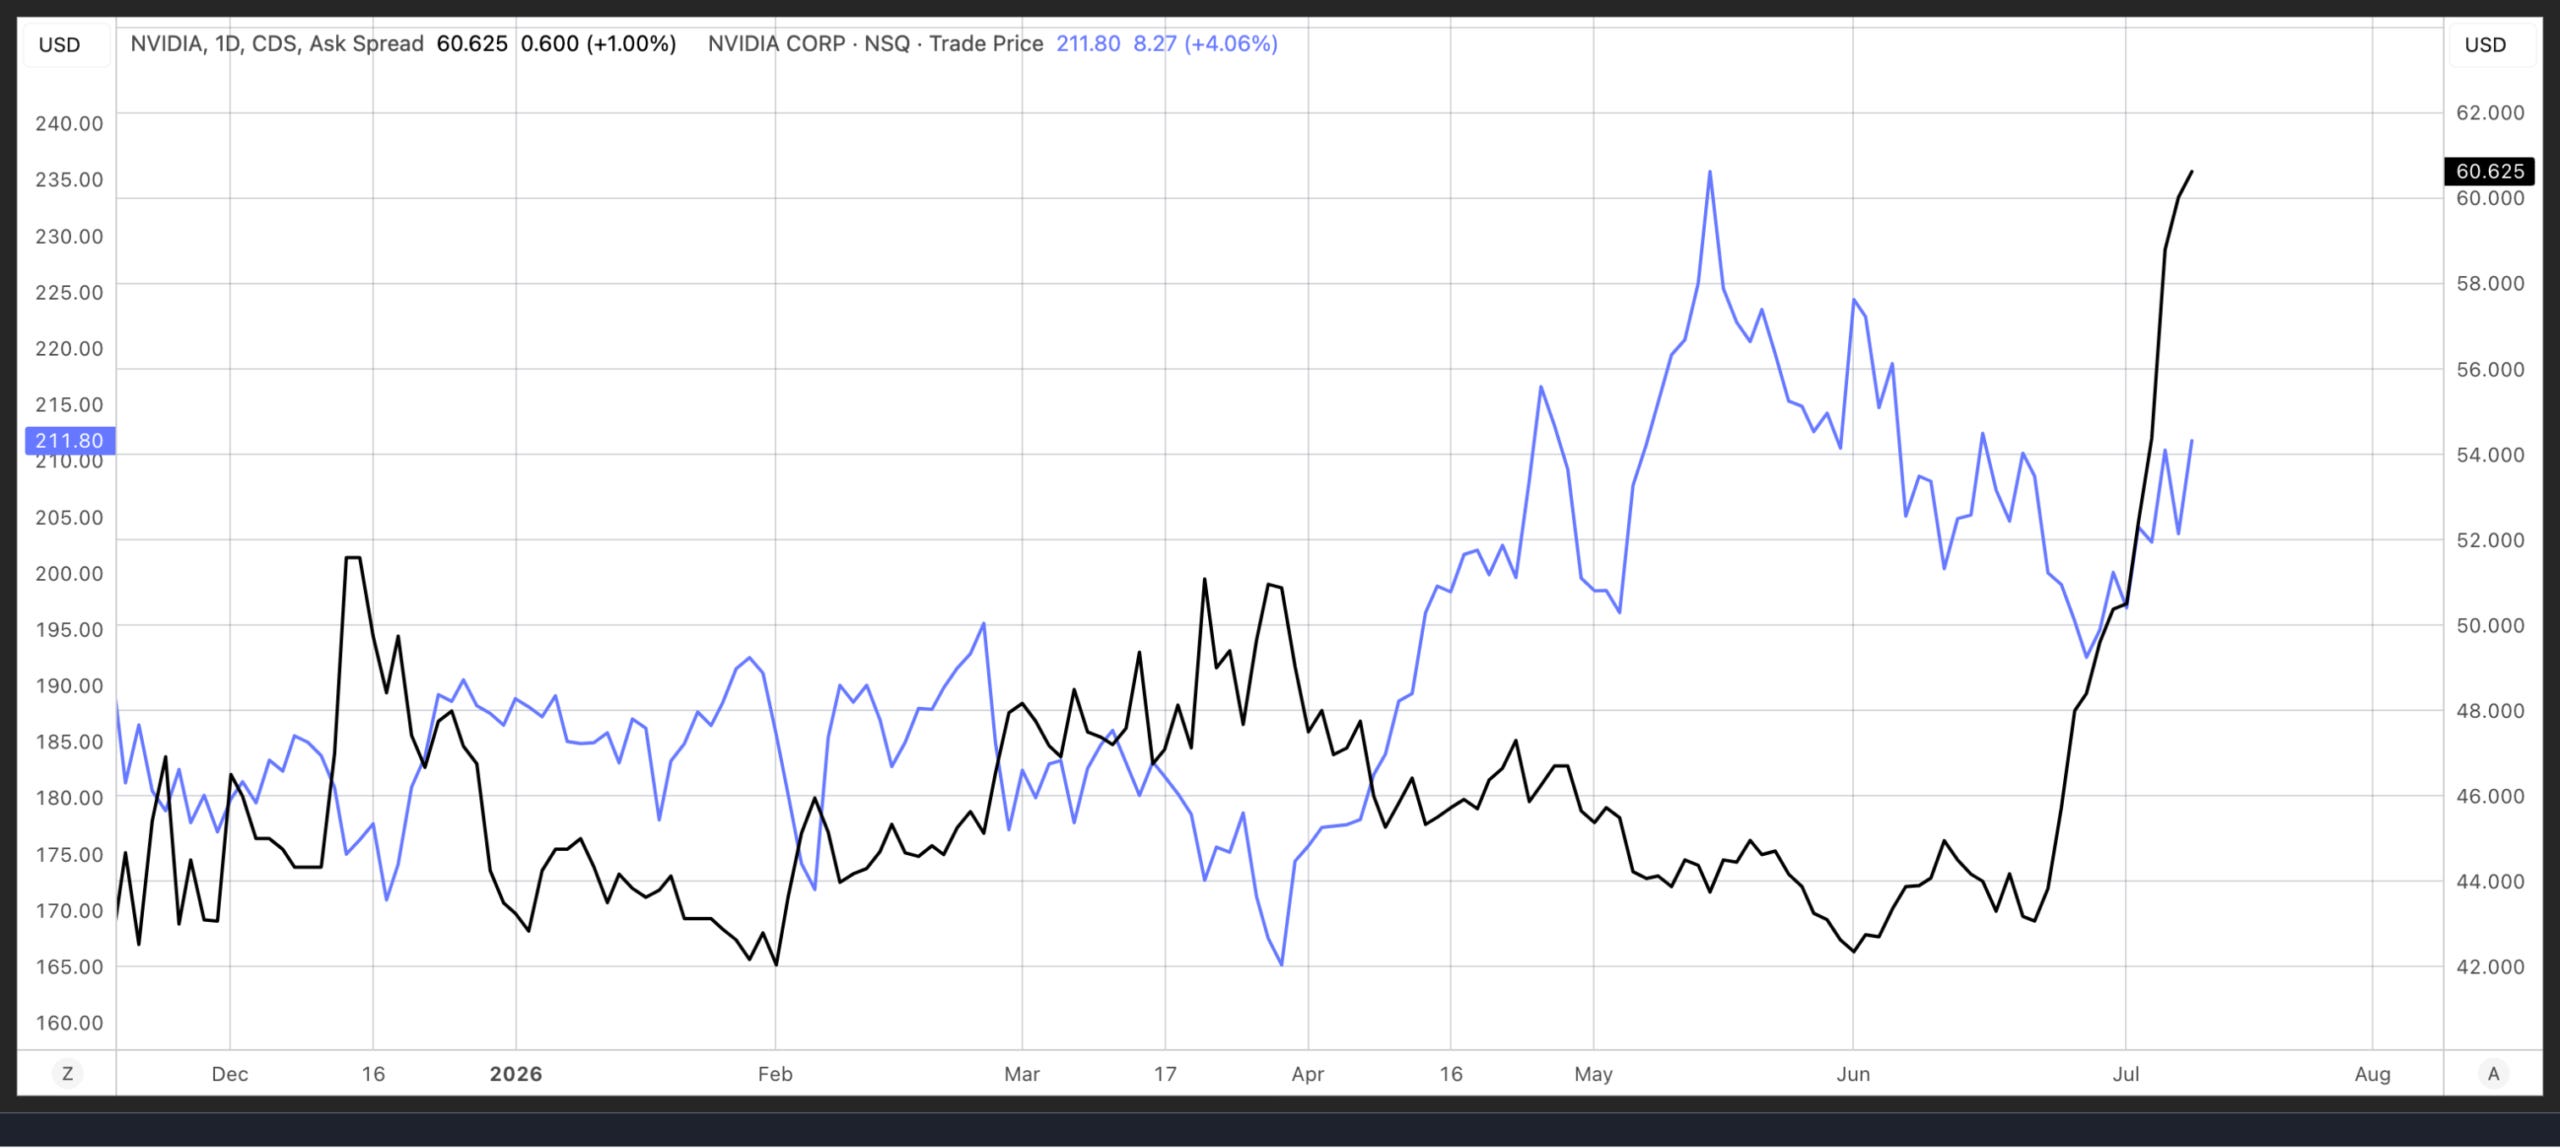
Finally, it seemed odd that Nvidia rose roughly 4% today while its five-year credit default swap spread widened to 60.6 basis points. Nvidia’s five-year CDS spread has increased from approximately 42 basis points on June 22 to more than 60 basis points as of July 14. Meanwhile, the stock has climbed from around $192, after bottoming on June 26, to approximately $211 today.
Typically, widening CDS spreads are accompanied by falling stock prices. Something therefore appears misaligned in the market. Either Nvidia’s CDS spread will begin tightening again, or whatever is concerning the credit market will eventually weigh on the company’s share price.
My guess is that the credit market sees something—or is worried about something—that the equity market, which is not always the sharpest tool in the shed, has yet to recognize. If that is the case, Nvidia’s recent rally is unlikely to last.
-Mike
Glossary by ChatGPT
Basis Point (bp): One one-hundredth of a percentage point (0.01%), commonly used to describe changes in interest rates or yields.
Core CPI: A measure of consumer inflation that excludes food and energy prices to better reflect underlying inflation trends.
Credit Default Swap (CDS): A derivative contract that provides insurance against the default of a borrower, with wider spreads generally indicating higher perceived credit risk.
Federal Reserve (Fed): The central bank of the United States responsible for monetary policy, financial stability, and supervising the banking system.
Headline CPI: The broad Consumer Price Index that includes all categories of goods and services, including food and energy.
Hawkish: A monetary policy stance favoring tighter financial conditions or higher interest rates to combat inflation.
Implied Volatility: The market’s expectation of future price fluctuations derived from option prices.
Resistance: A technical price level where upward price movements have historically encountered selling pressure.
Simple Moving Average (SMA): A technical indicator that calculates the average price over a specified number of periods to identify trends.
Support: A technical price level where buying interest has historically been strong enough to prevent further declines.
Treasury Yield: The annual return investors earn from holding U.S. Treasury securities.
USD/JPY: The exchange rate showing how many Japanese yen are required to purchase one U.S. dollar.
VIX: The Cboe Volatility Index, which measures expected volatility in the S&P 500 over the coming 30 days.
Disclosure
This report contains independent commentary to be used for informational and educational purposes only. Michael Kramer is a member and investment adviser representative with Mott Capital Management. Mr. Kramer is not affiliated with this company and does not serve on the board of any related company that issued this stock. All opinions and analyses presented by Michael Kramer in this analysis or market report are solely Michael Kramer’s views. Readers should not treat any opinion, viewpoint, or prediction expressed by Michael Kramer as a specific solicitation or recommendation to buy or sell a particular security or follow a particular strategy. Michael Kramer’s analyses are based upon information and independent research that he considers reliable, but neither Michael Kramer nor Mott Capital Management guarantees its completeness or accuracy, and it should not be relied upon as such. Michael Kramer is not under any obligation to update or correct any information presented in his analyses. Mr. Kramer’s statements, guidance, and opinions are subject to change without notice. Past performance is not indicative of future results. Neither Michael Kramer nor Mott Capital Management guarantees any specific outcome or profit. You should be aware of the real risk of loss in following any strategy or investment commentary presented in this analysis. Strategies or investments discussed may fluctuate in price or value. Investments or strategies mentioned in this analysis may not be suitable for you. This material does not consider your particular investment objectives, financial situation, or needs and is not intended as a recommendation appropriate for you. You must make an independent decision regarding investments or strategies in this analysis. Upon request, the advisor will provide a list of all recommendations made during the past twelve months. Before acting on information in this analysis, you should consider whether it is suitable for your circumstances and strongly consider seeking advice from your own financial or investment adviser to determine the suitability of any investment.