
CPI Report Market Outlook as Stocks Swing and Precious Metals Break Down

Stock market volatility ahead of CPI was the dominant theme on Tuesday, as traders navigated sharp intraday swings while positioning for the latest inflation report. The index rose about 1% at the start of the day, then fell nearly 3.25%, before rebounding by roughly 2%.
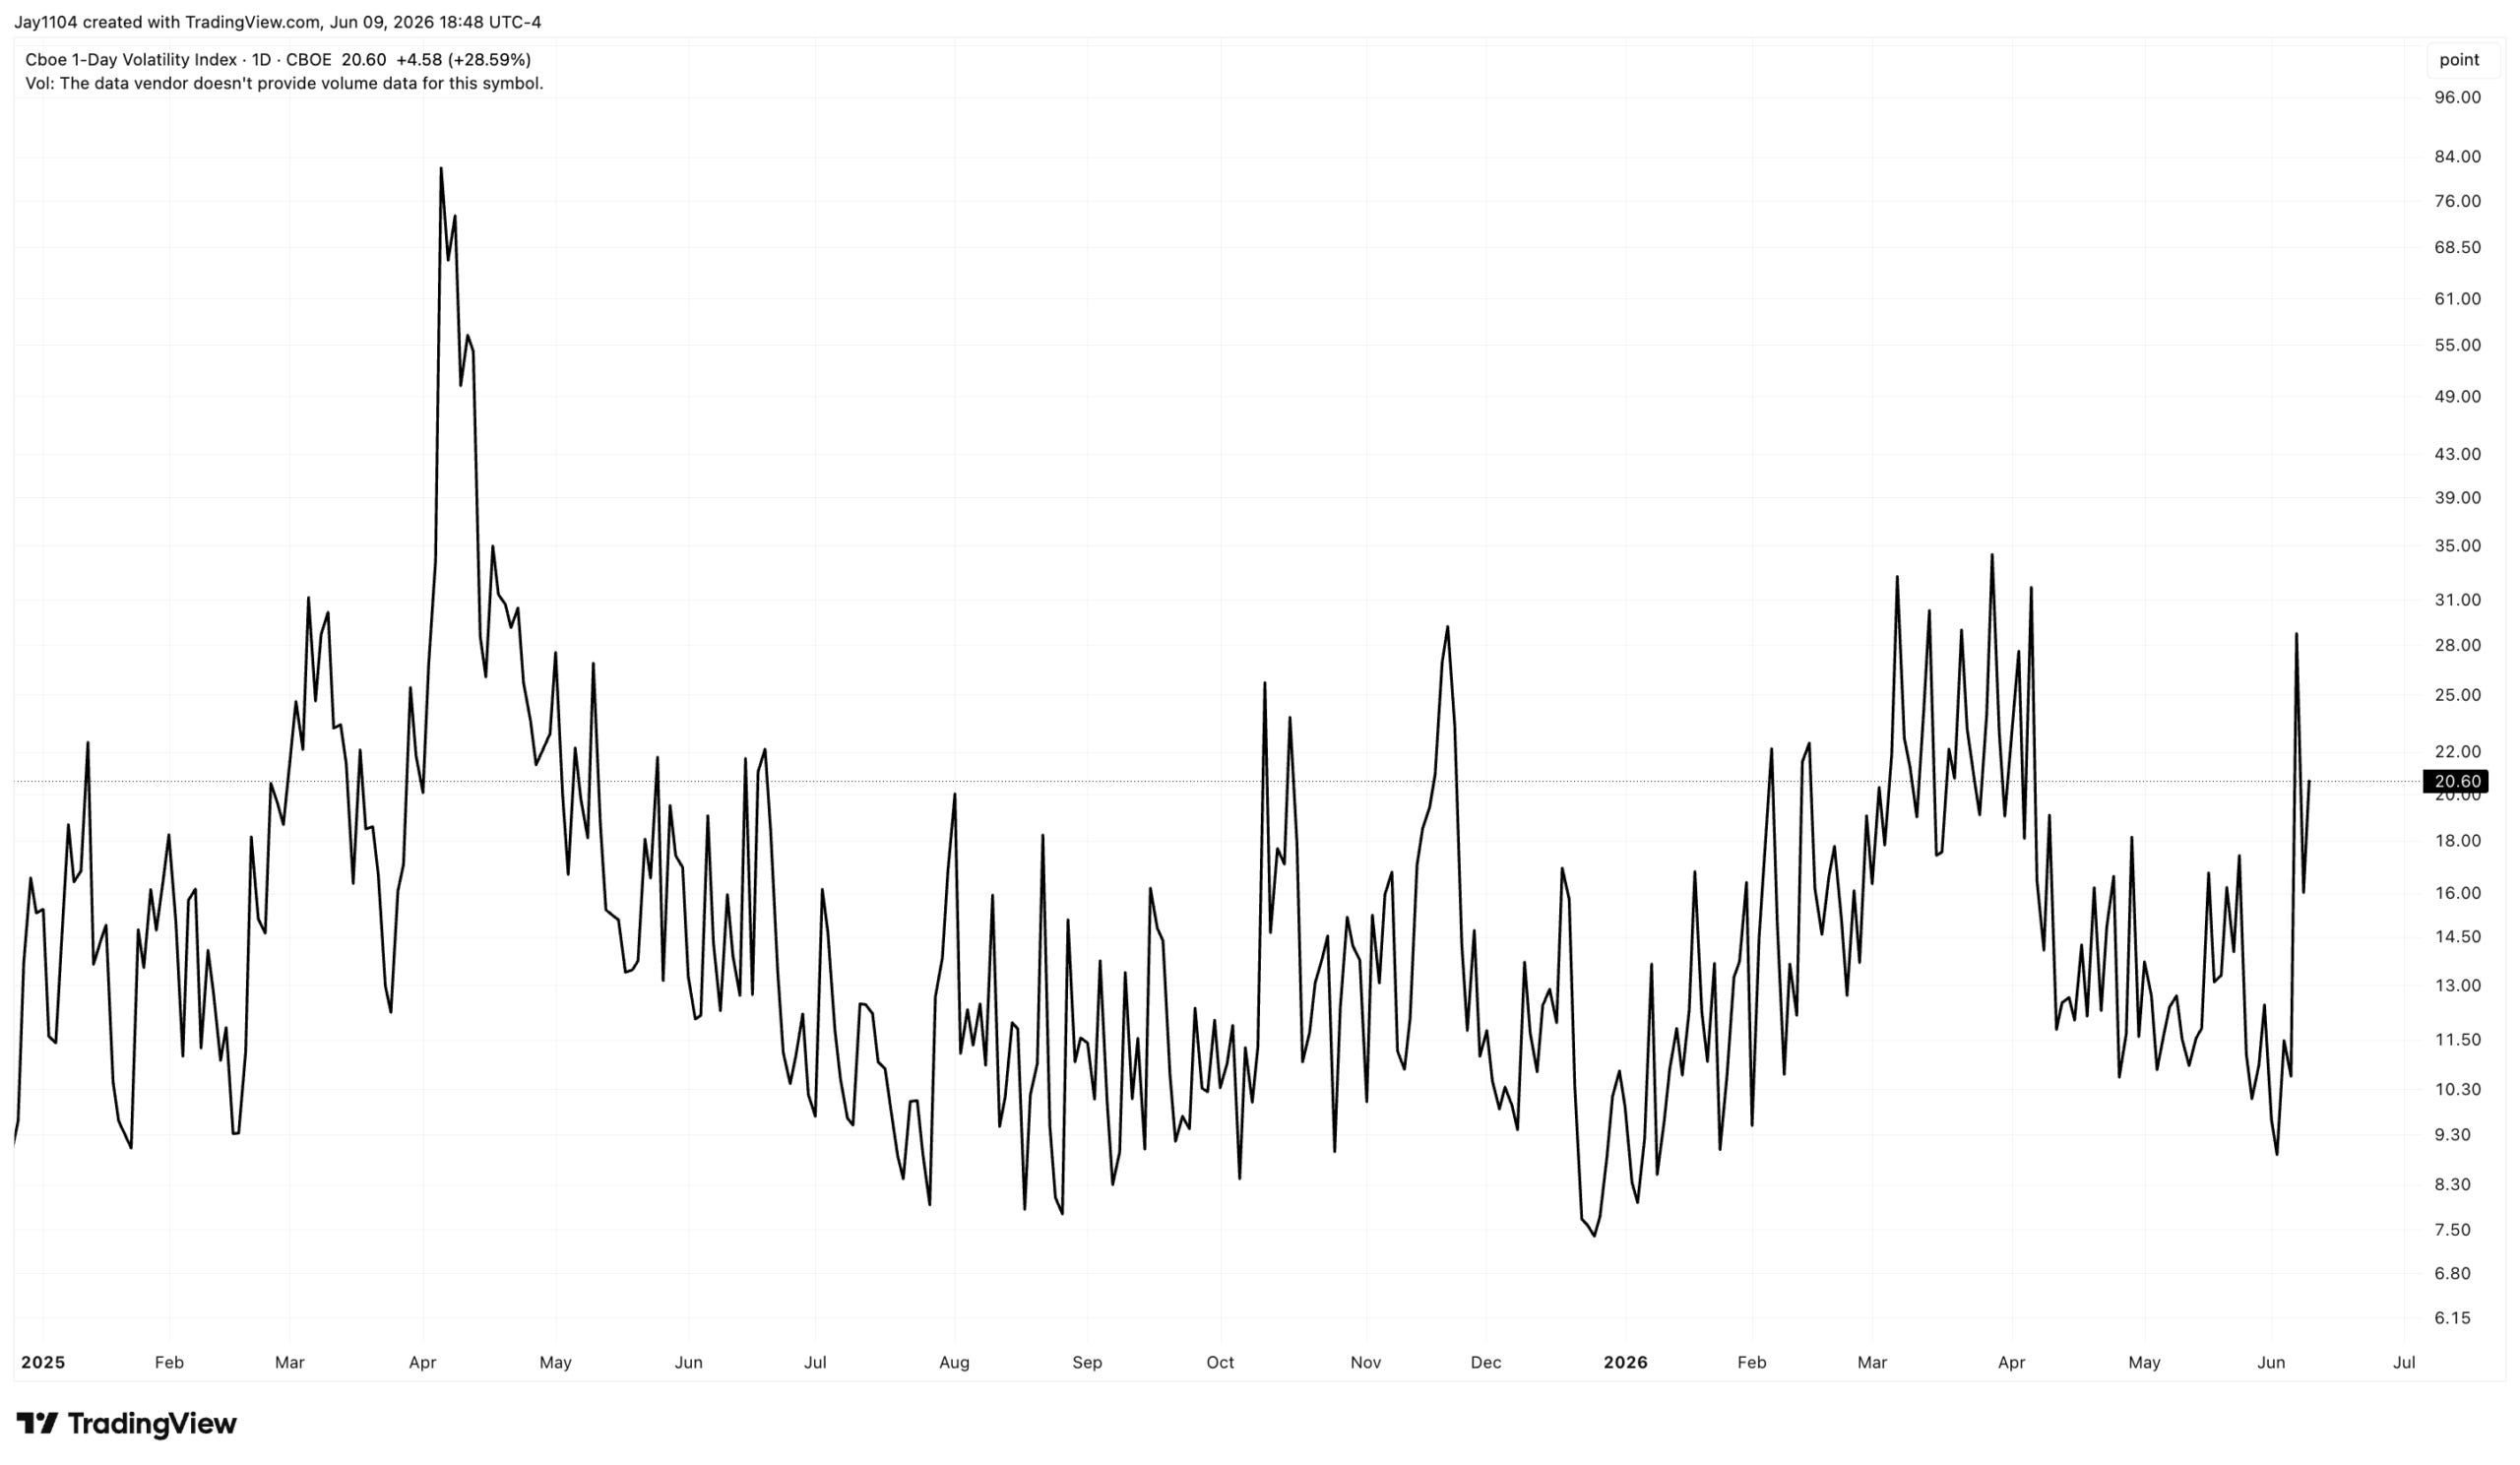
The swings in the market also helped push the VIX 1-Day to around 20, which is elevated and could set up a volatility crush following the morning CPI report. However, the volatility release we saw on Monday was fairly tepid after the initial morning bounce, so the same may be true following tomorrow’s report.
The CPI report is expected to show strong headline inflation and more modest core CPI readings. Market-based pricing still suggests that headline CPI will come in at around 4.25%, which effectively rounds up to 4.3%. I do not think the market will respond negatively unless the numbers come in meaningfully hotter than expected. With the VIX 1-Day closing around 20, the market is not positioned the same way it was heading into last week’s jobs report.
At this point, the spread between the dispersion index and the 3-month implied correlation index remains very wide, well above the levels seen during previous market peaks. From that standpoint, I would think there is still more unwinding left to occur in the market overall.
 and S&P 500 (SPX) from 2022 to mid-2026, with RSI indicator below")
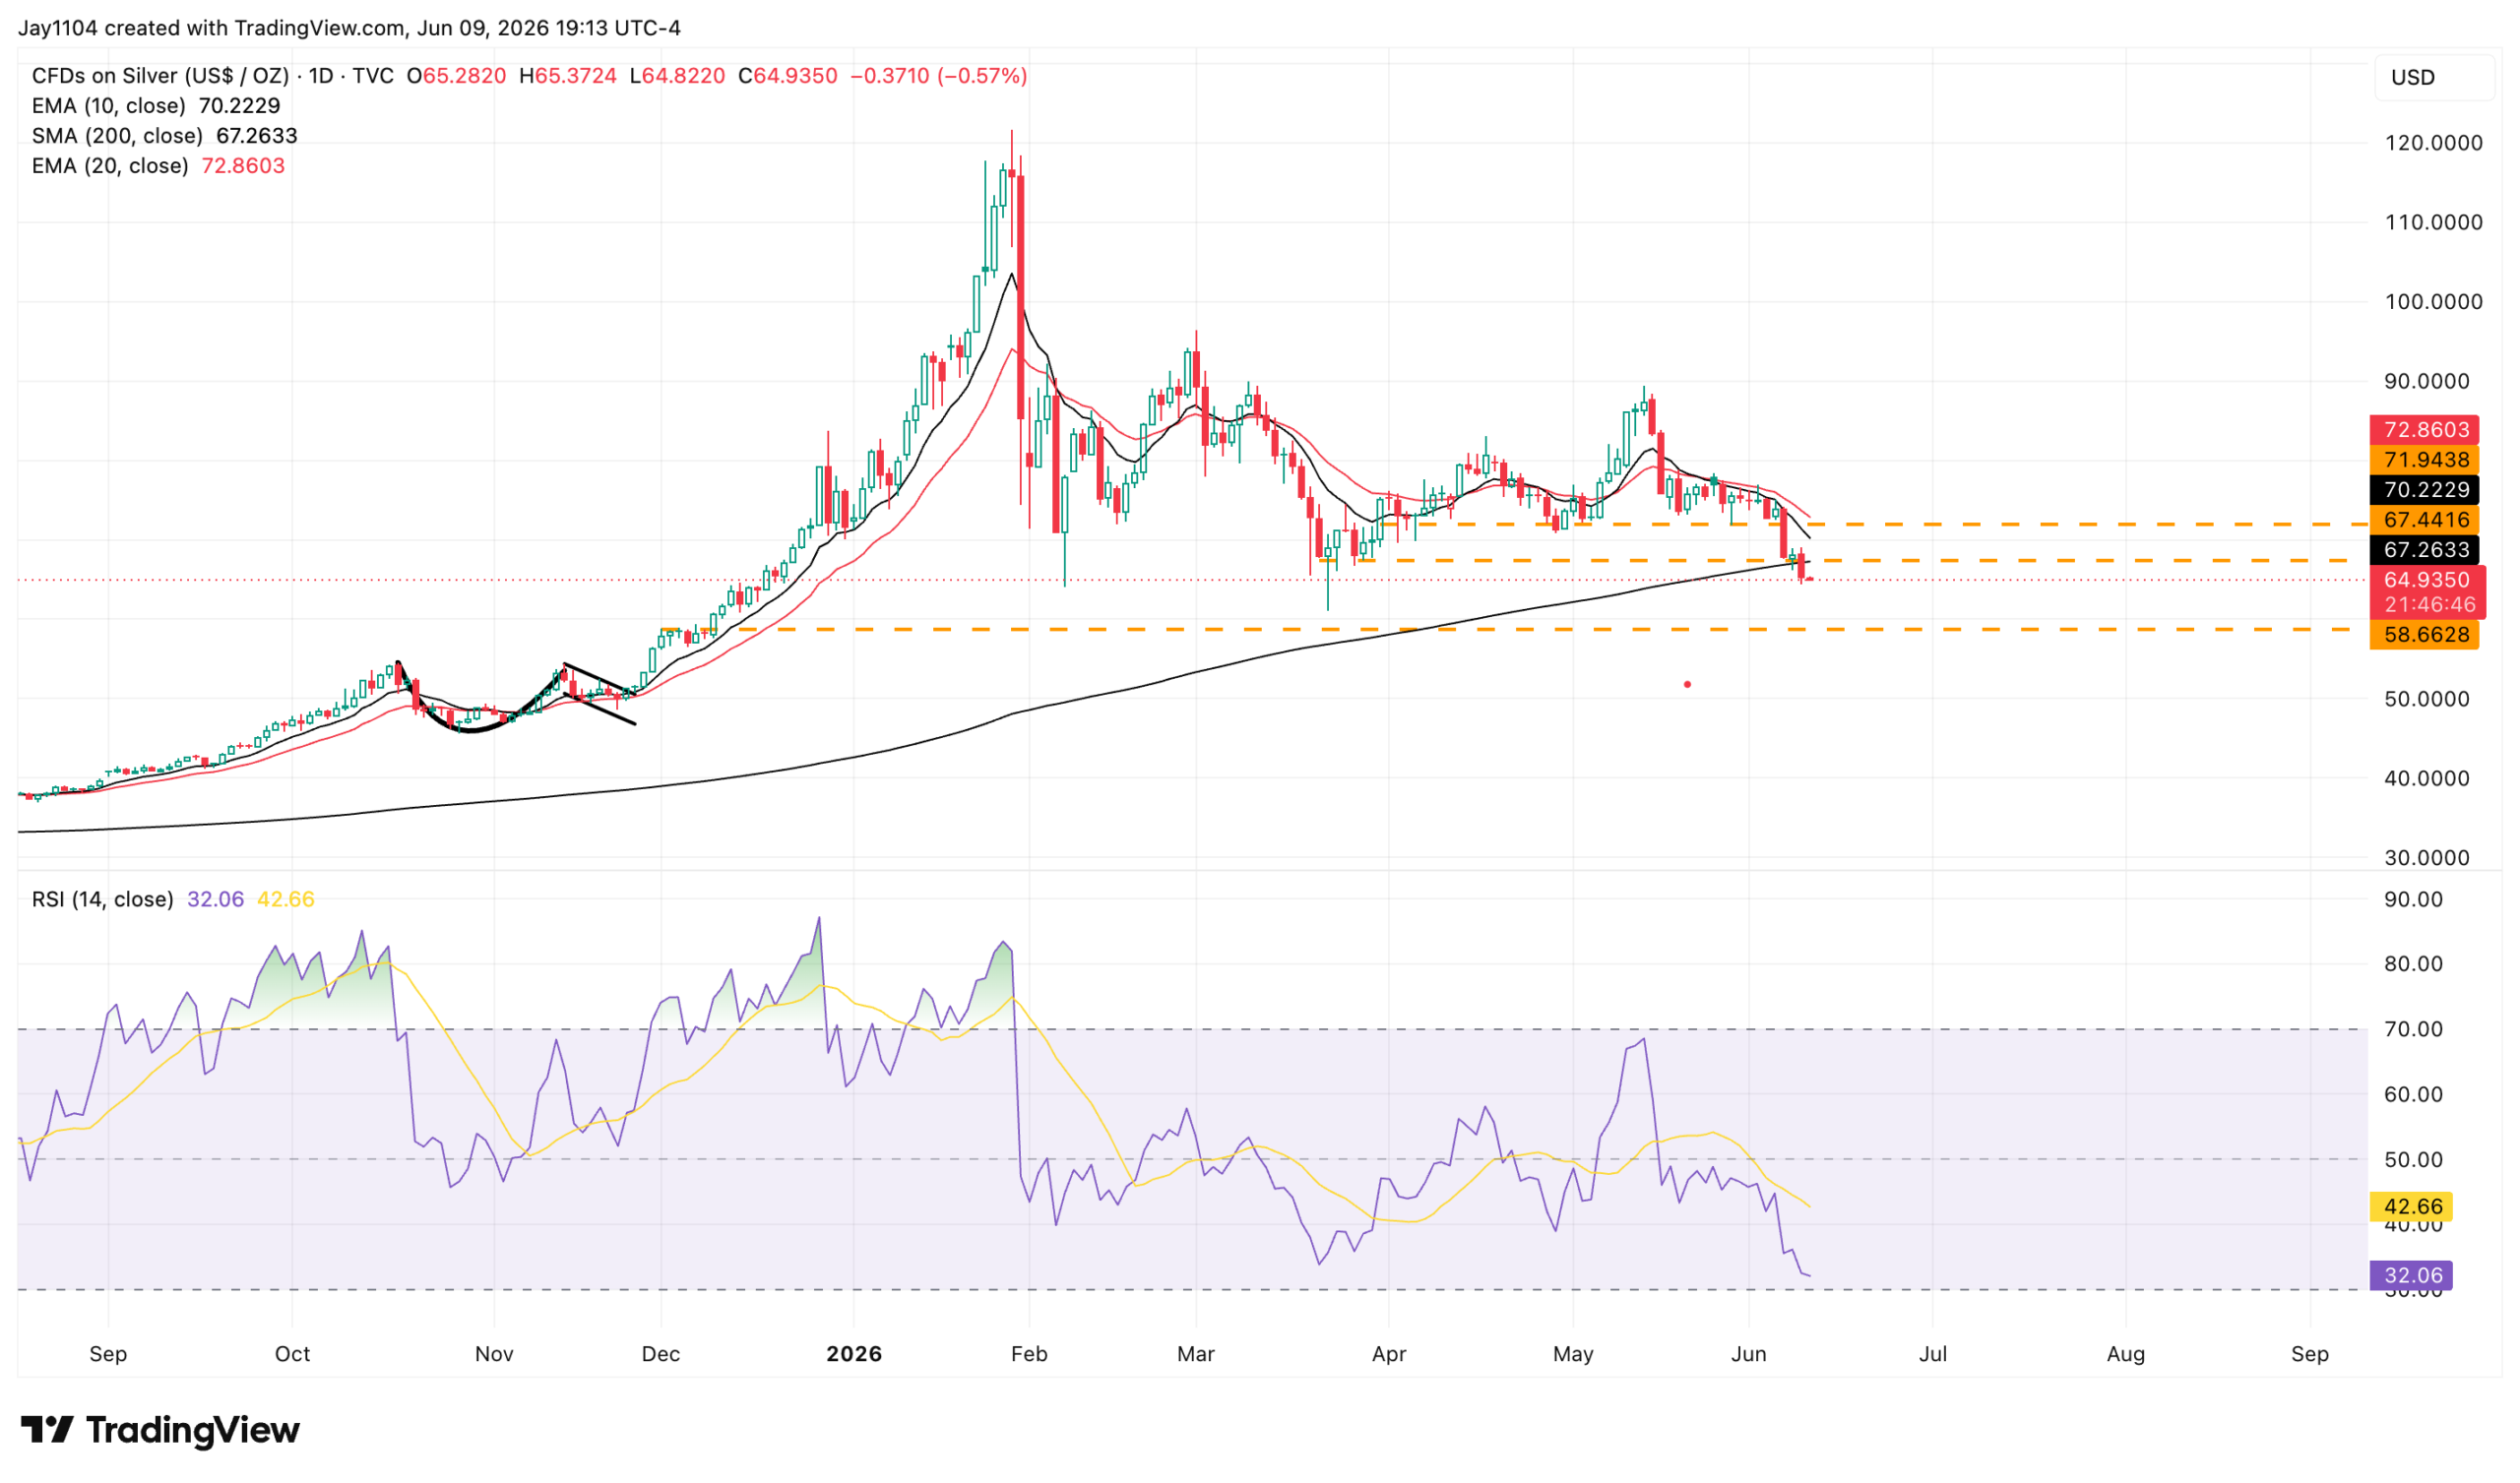
Silver fell sharply today, breaking below support around $67.25 and the 200-day moving average. With that support now broken, it is difficult to identify another meaningful support level on the chart until around $58.50.
As long as the 10-day exponential moving average continues to act as resistance, the path of least resistance for silver appears to remain lower.
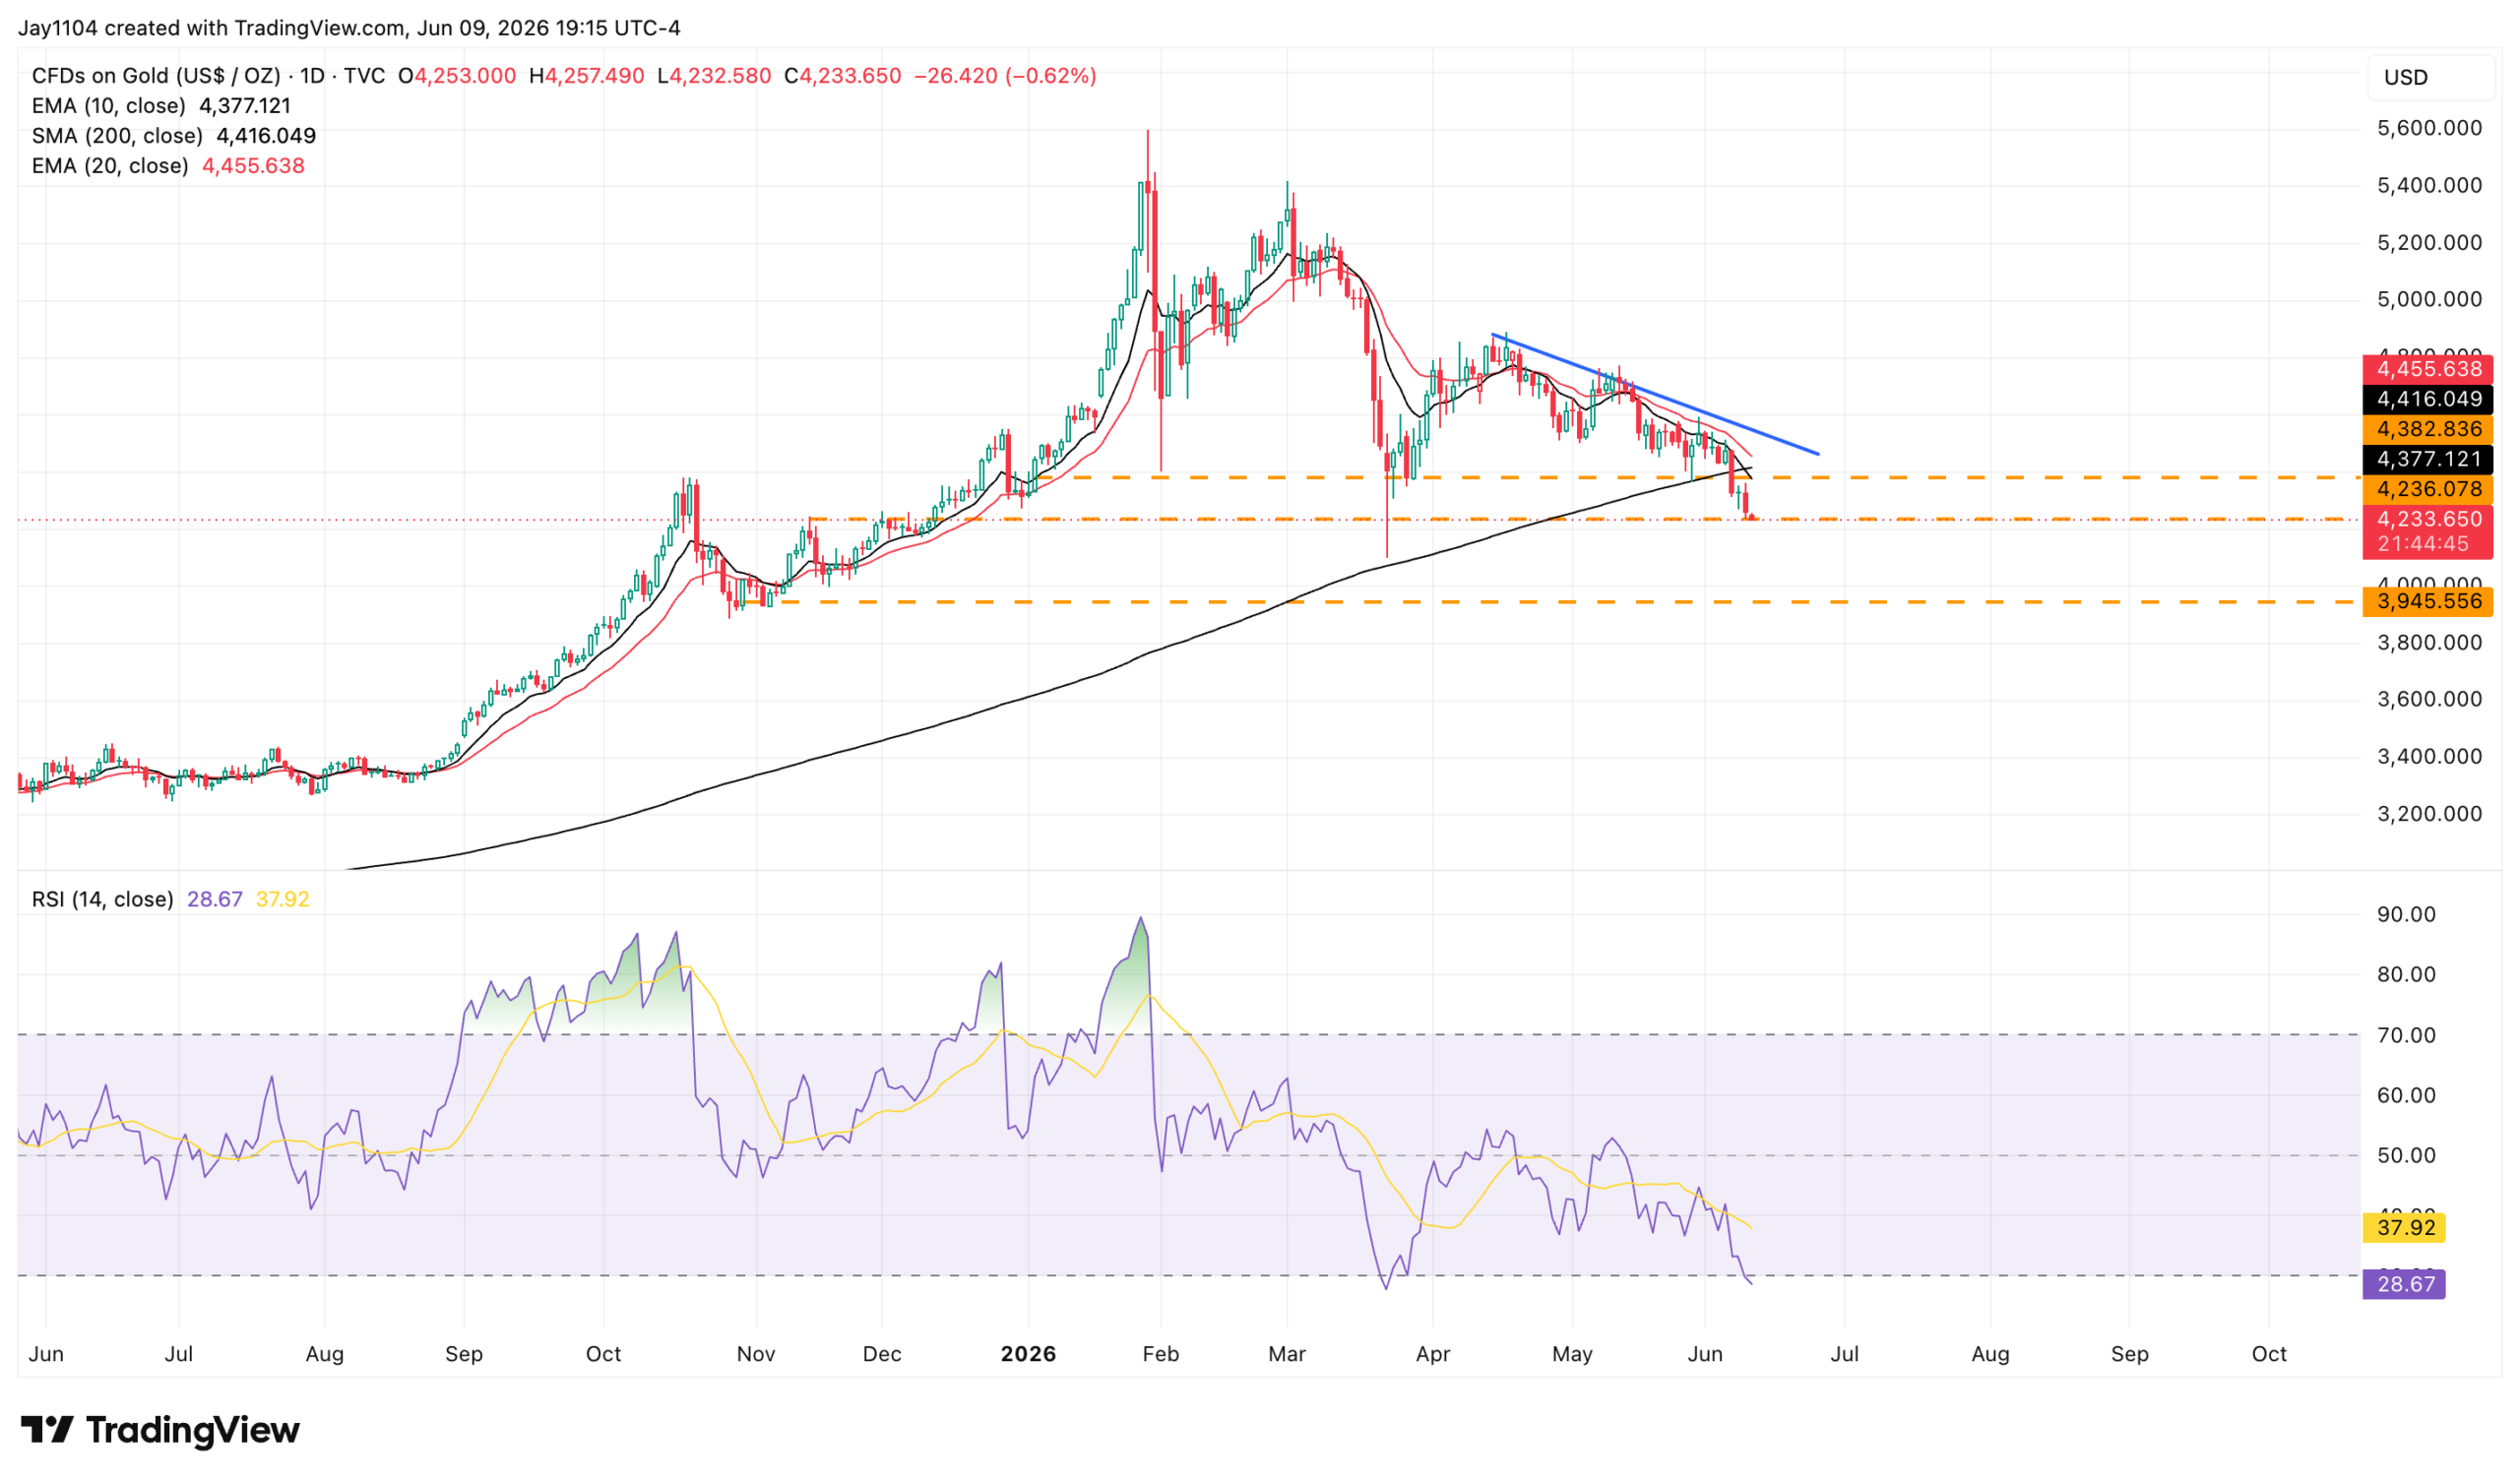
Gold also appears to be weakening, with the metal now trading below its 200-day moving average and under key support at $4,225. The break suggests that downside risks are increasing, with the next major support zone located between $3,900 and $4,000.
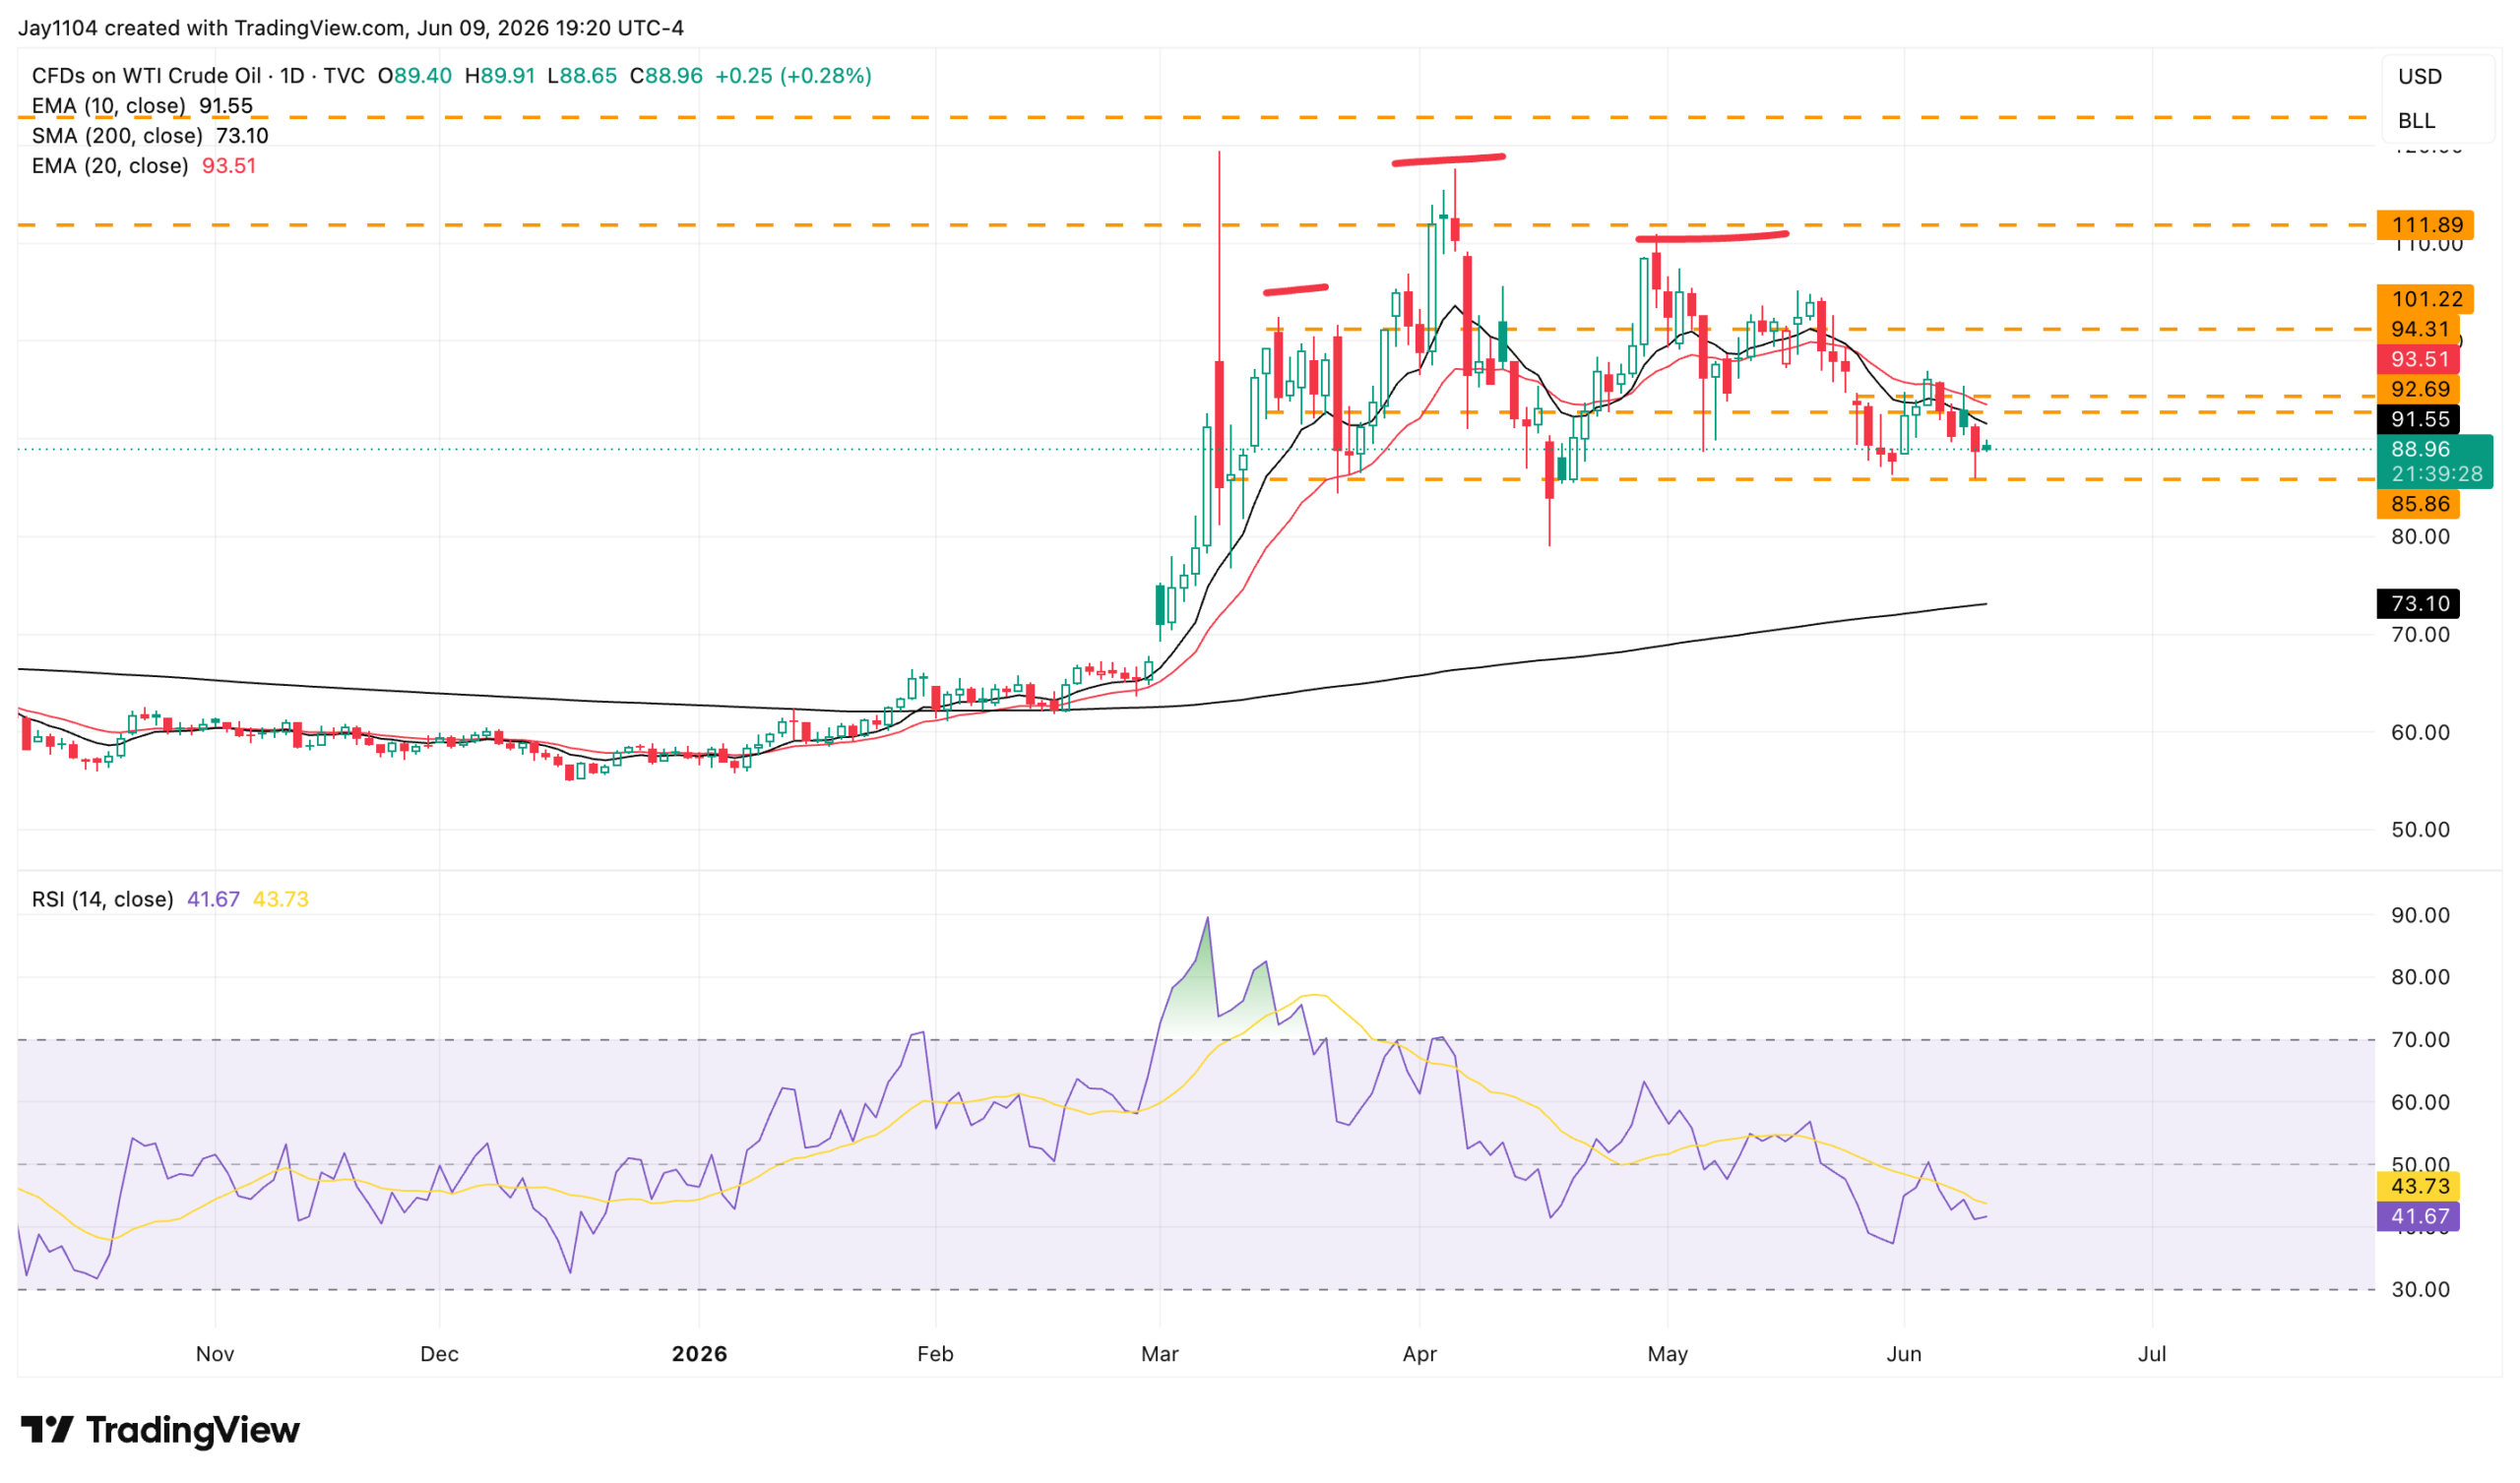
Oil continues to be stubborn. It has repeatedly held support around $85, but it has also been unable to break above $95. At some point, something is going to have to give.
The head-and-shoulders pattern resolves in one of two ways. The first is a break below the neckline near $85, suggesting a move back toward $70. The second is a failure of the pattern, with oil breaking above $95 and taking out its prior highs.
Anyway, see you later.
Mike
Glossary by ChatGPT
200-Day Moving Average — A long-term trend indicator calculated using the average closing price over the previous 200 trading days.
Core CPI — A measure of inflation that excludes volatile food and energy prices to better reflect underlying price trends.
Dispersion Index — A measure of how widely individual stock returns vary from one another within an index.
Exponential Moving Average (EMA) — A moving average that places greater weight on recent price data to better reflect current trends.
Head-and-Shoulders Pattern — A technical chart formation that can signal either a trend reversal or, if invalidated, a continuation of the existing trend.
Headline CPI — The broad Consumer Price Index measure that includes all categories of consumer spending, including food and energy.
Implied Correlation Index — An options-derived measure estimating the degree to which stocks within an index are expected to move together.
Support Level — A price area where buying interest has historically been strong enough to prevent further declines.
VIX 1-Day — A short-term volatility index that reflects market expectations for S&P 500 price fluctuations over the next trading day.
Volatility Crush — A rapid decline in implied volatility, often occurring after a major scheduled event such as an economic report or earnings release.
Disclosure
This report contains independent commentary to be used for informational and educational purposes only. Michael Kramer is a member and investment adviser representative with Mott Capital Management. Mr. Kramer is not affiliated with this company and does not serve on the board of any related company that issued this stock. All opinions and analyses presented by Michael Kramer in this analysis or market report are solely Michael Kramer’s views. Readers should not treat any opinion, viewpoint, or prediction expressed by Michael Kramer as a specific solicitation or recommendation to buy or sell a particular security or follow a particular strategy. Michael Kramer’s analyses are based upon information and independent research that he considers reliable, but neither Michael Kramer nor Mott Capital Management guarantees its completeness or accuracy, and it should not be relied upon as such. Michael Kramer is not under any obligation to update or correct any information presented in his analyses. Mr. Kramer’s statements, guidance, and opinions are subject to change without notice. Past performance is not indicative of future results. Neither Michael Kramer nor Mott Capital Management guarantees any specific outcome or profit. You should be aware of the real risk of loss in following any strategy or investment commentary presented in this analysis. Strategies or investments discussed may fluctuate in price or value. Investments or strategies mentioned in this analysis may not be suitable for you. This material does not consider your particular investment objectives, financial situation, or needs and is not intended as a recommendation appropriate for you. You must make an independent decision regarding investments or strategies in this analysis. Upon request, the advisor will provide a list of all recommendations made during the past twelve months. Before acting on information in this analysis, you should consider whether it is suitable for your circumstances and strongly consider seeking advice from your own financial or investment adviser to determine the suitability of any investment.