
30-Year Treasury Yield Nears Next Breakout As The Market Reprices The Neutral Rate

Please remember to subscribe to my Substack to receive this free daily commentary—which I work very hard to produce—directly in your inbox.


Summer is nearly over. In fact, my kids go back to school on September 1, which means this is the final two-week stretch. Summer seems to go faster every year, especially as my children grow older and lead busier, more active lives. Summers for me used to feel like they dragged on forever and were rather chaotic. Those days, for the most part, seem to be over. Now, with just two weeks left, we can look forward to the return to school and football as the seasons change and the hot, humid New York summer days give way to cooler temperatures and fewer hours of daylight.
From my personal experience, the Hamptons last week were not as busy as I remember them being in summers past, either. Maybe people are finding alternative destinations. Whatever the case, enjoy the end of summer, as I expect many people will be on vacation and trading volume will decline.
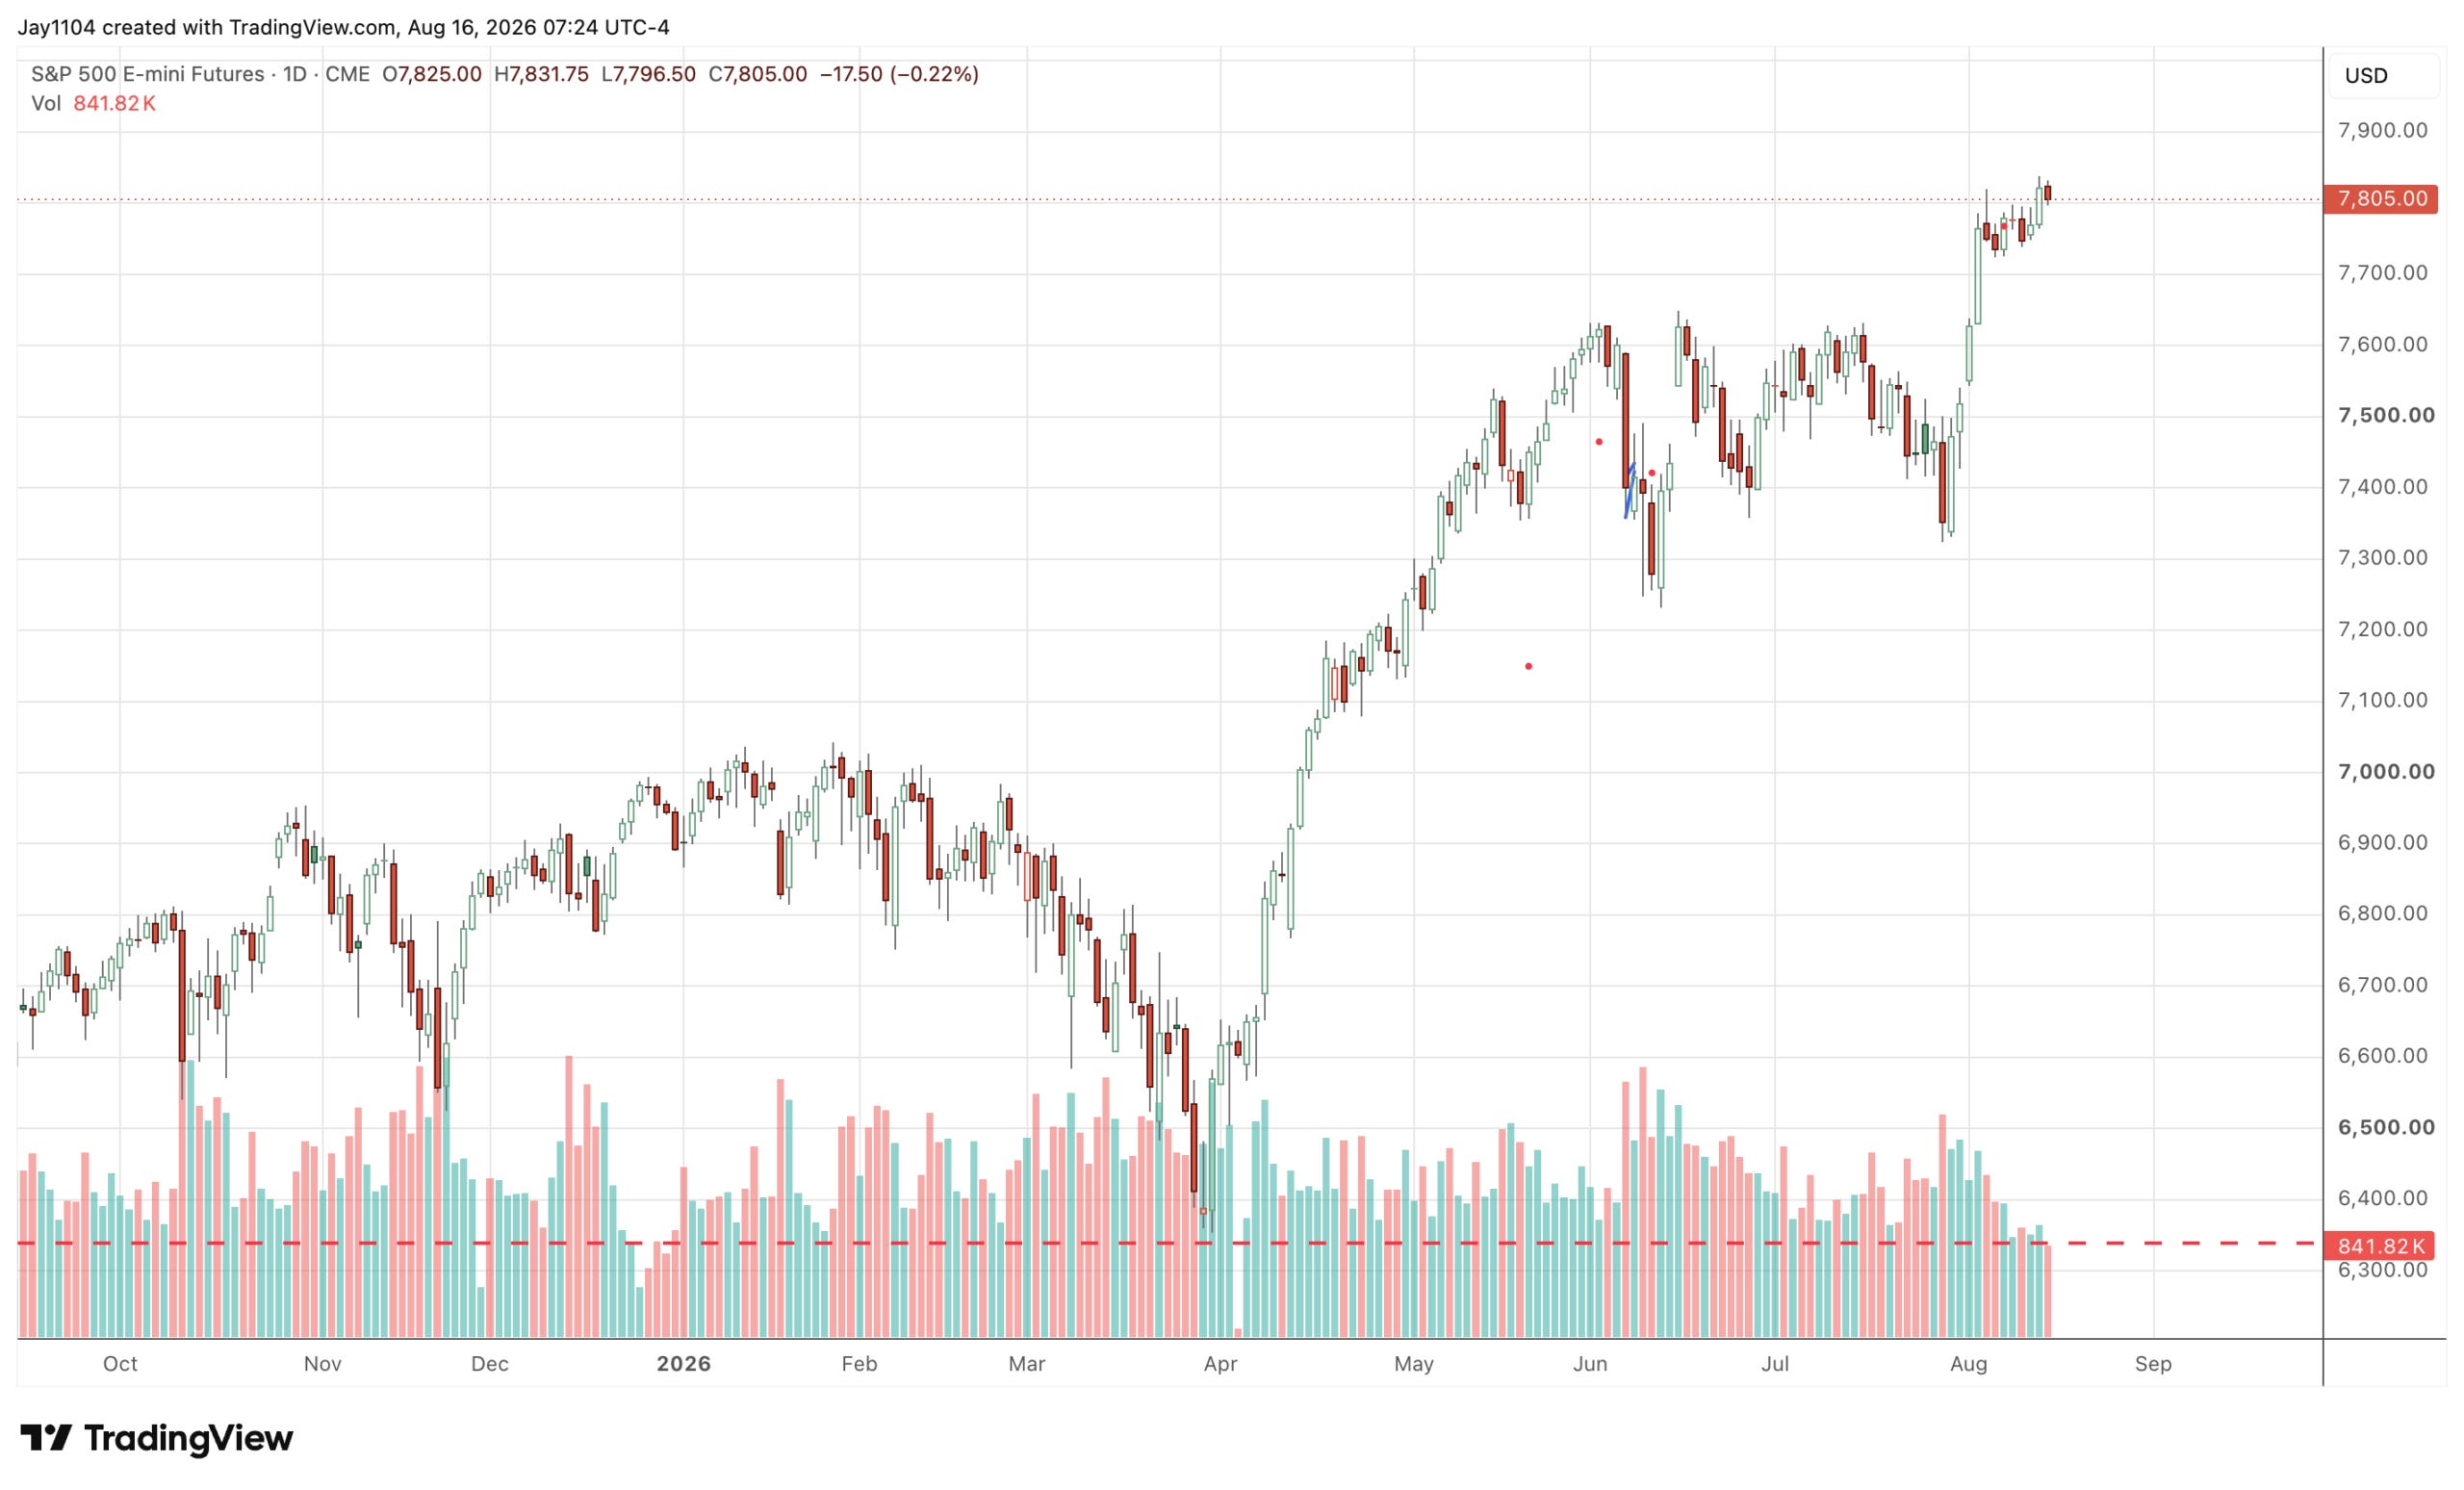
Trading volume on the S&P 500 E-minis has steadily declined since the end of July and didn’t even reach 850,000 contracts on Friday, the lightest trading day since the final few days of 2025. The most exciting thing this week is likely to be the Fed minutes, and given how much Kevin Warsh likes to share, those minutes aren’t likely to say much, either.
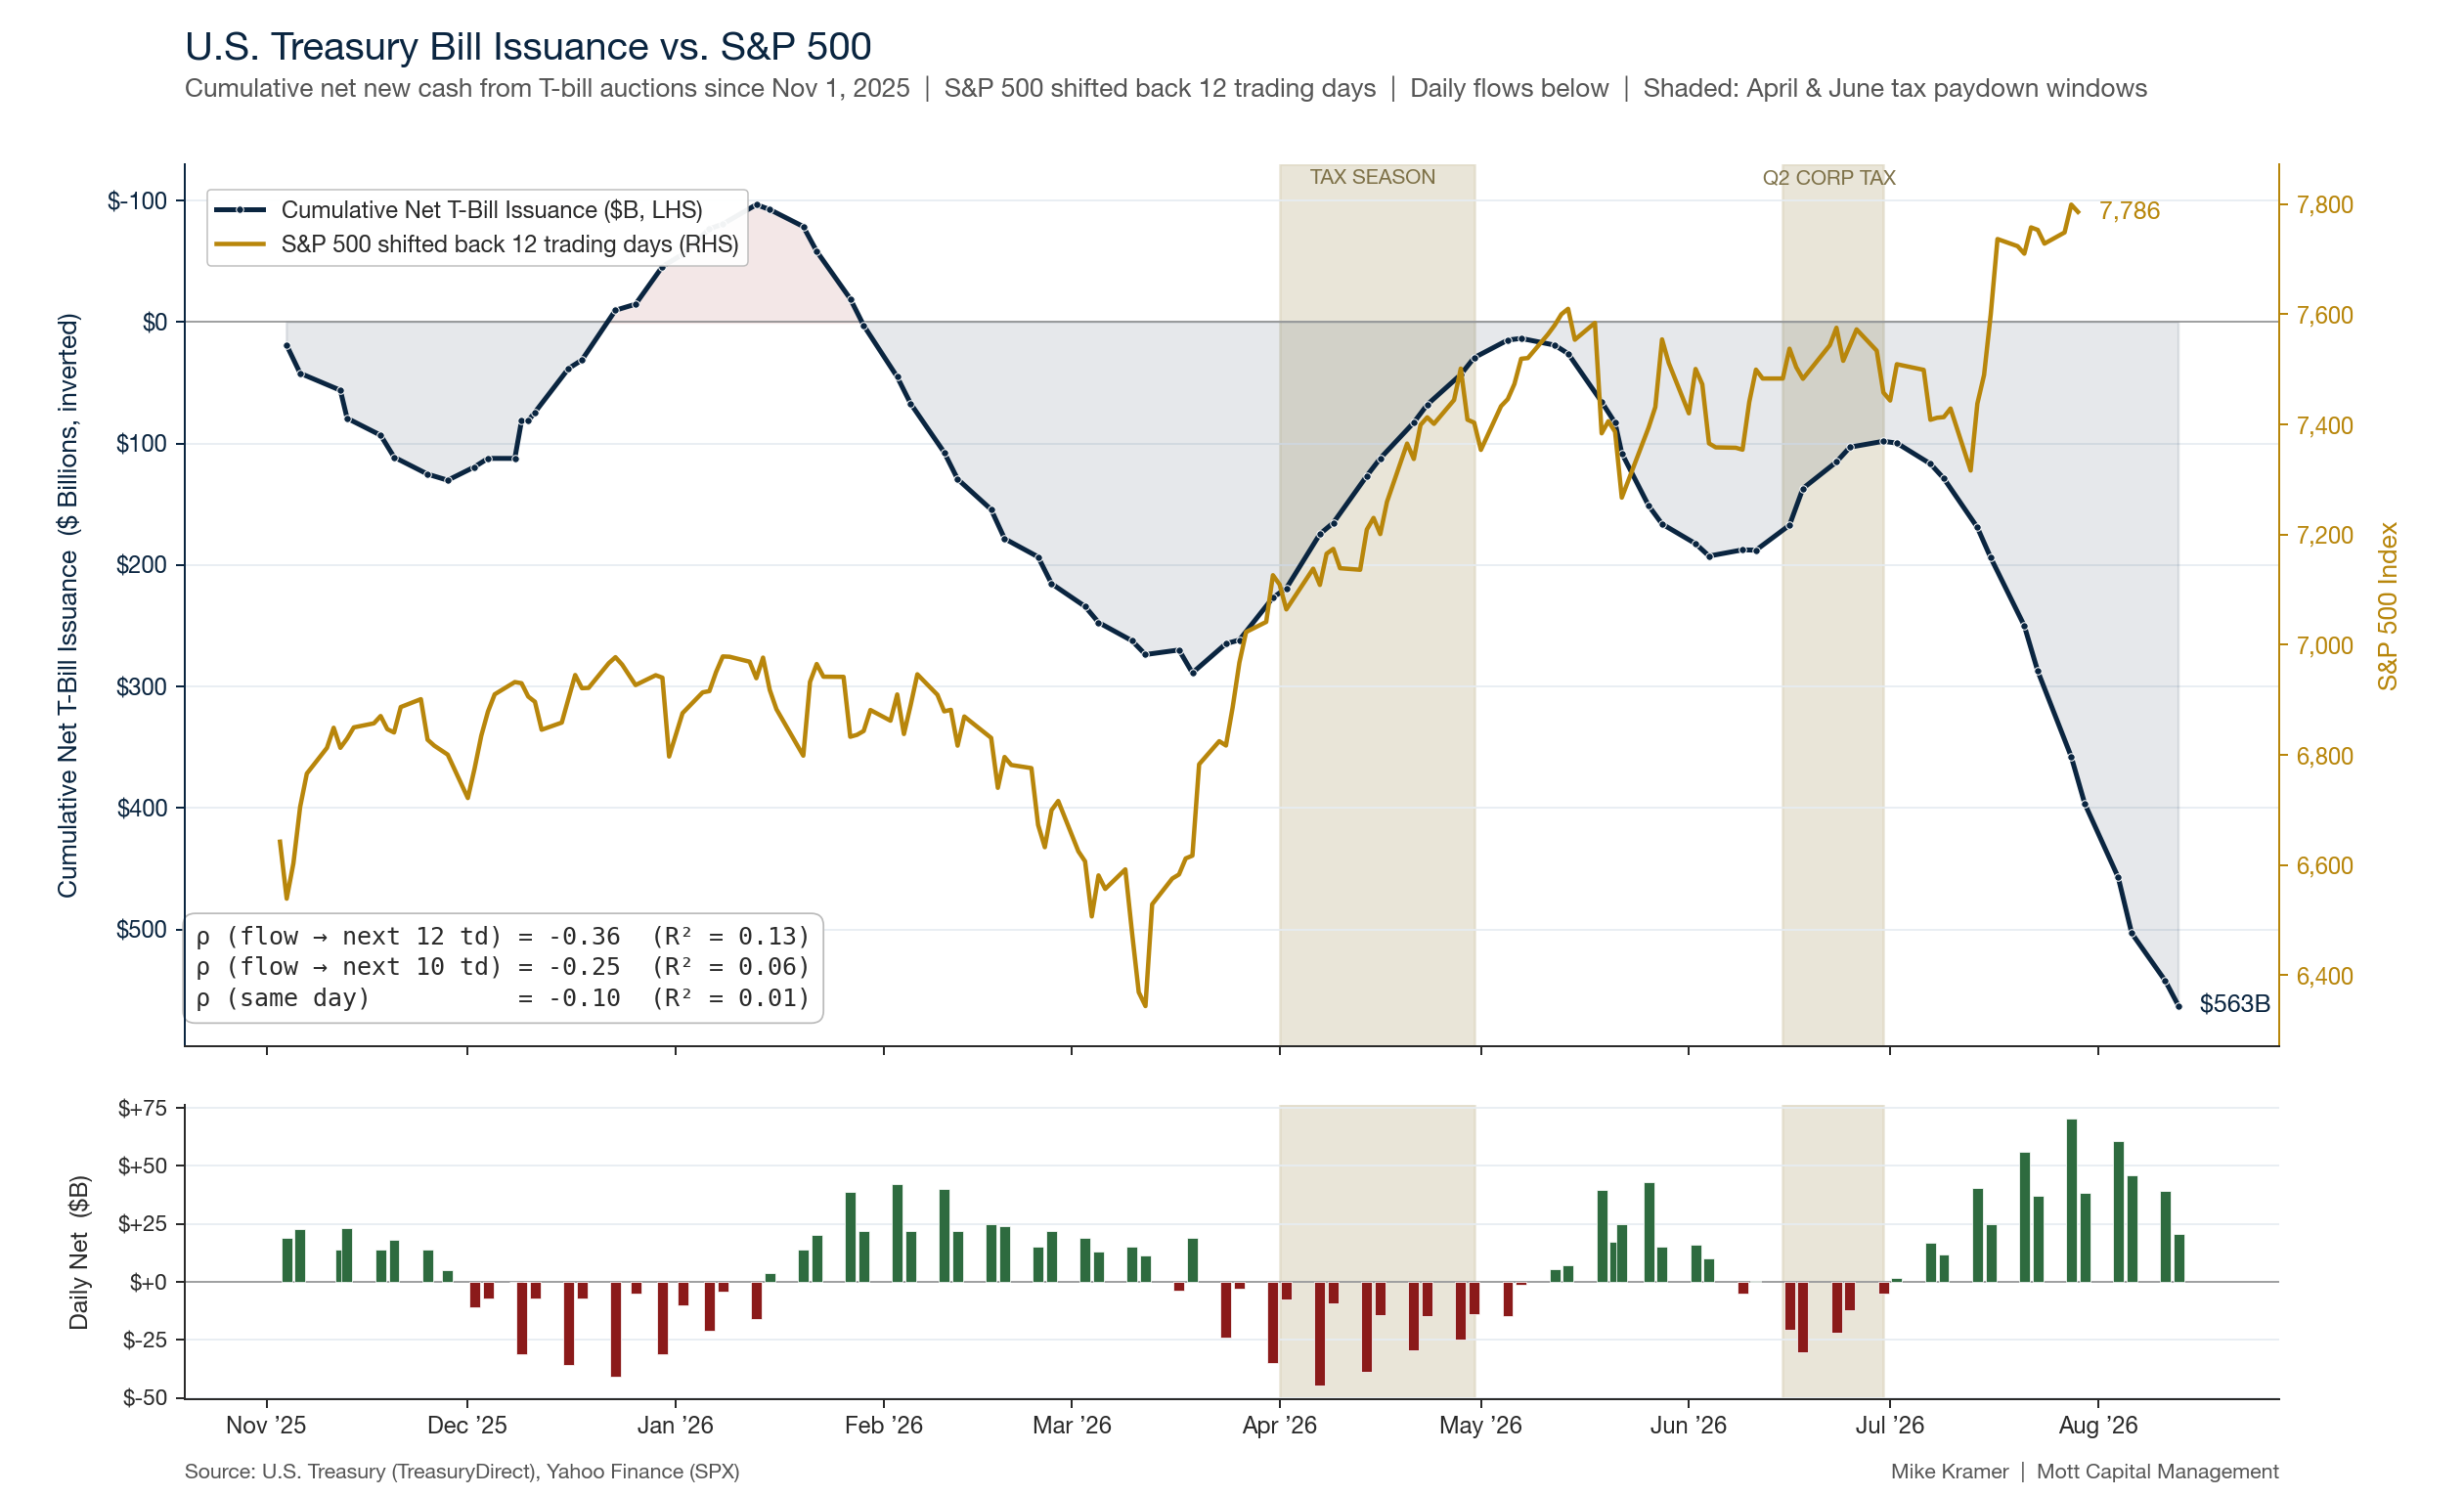
Additionally, we are now well past peak Treasury issuance and have reached the point where issuance will begin to decline steadily into September, with a few weeks of paydowns before issuance ramps back up in October. The cumulative T-bill issuance charts had been working very well until two weeks ago, when the gamma squeeze hit the markets. There is still plenty of T-bill liquidity draining that could reassert itself with a 12-day lag.
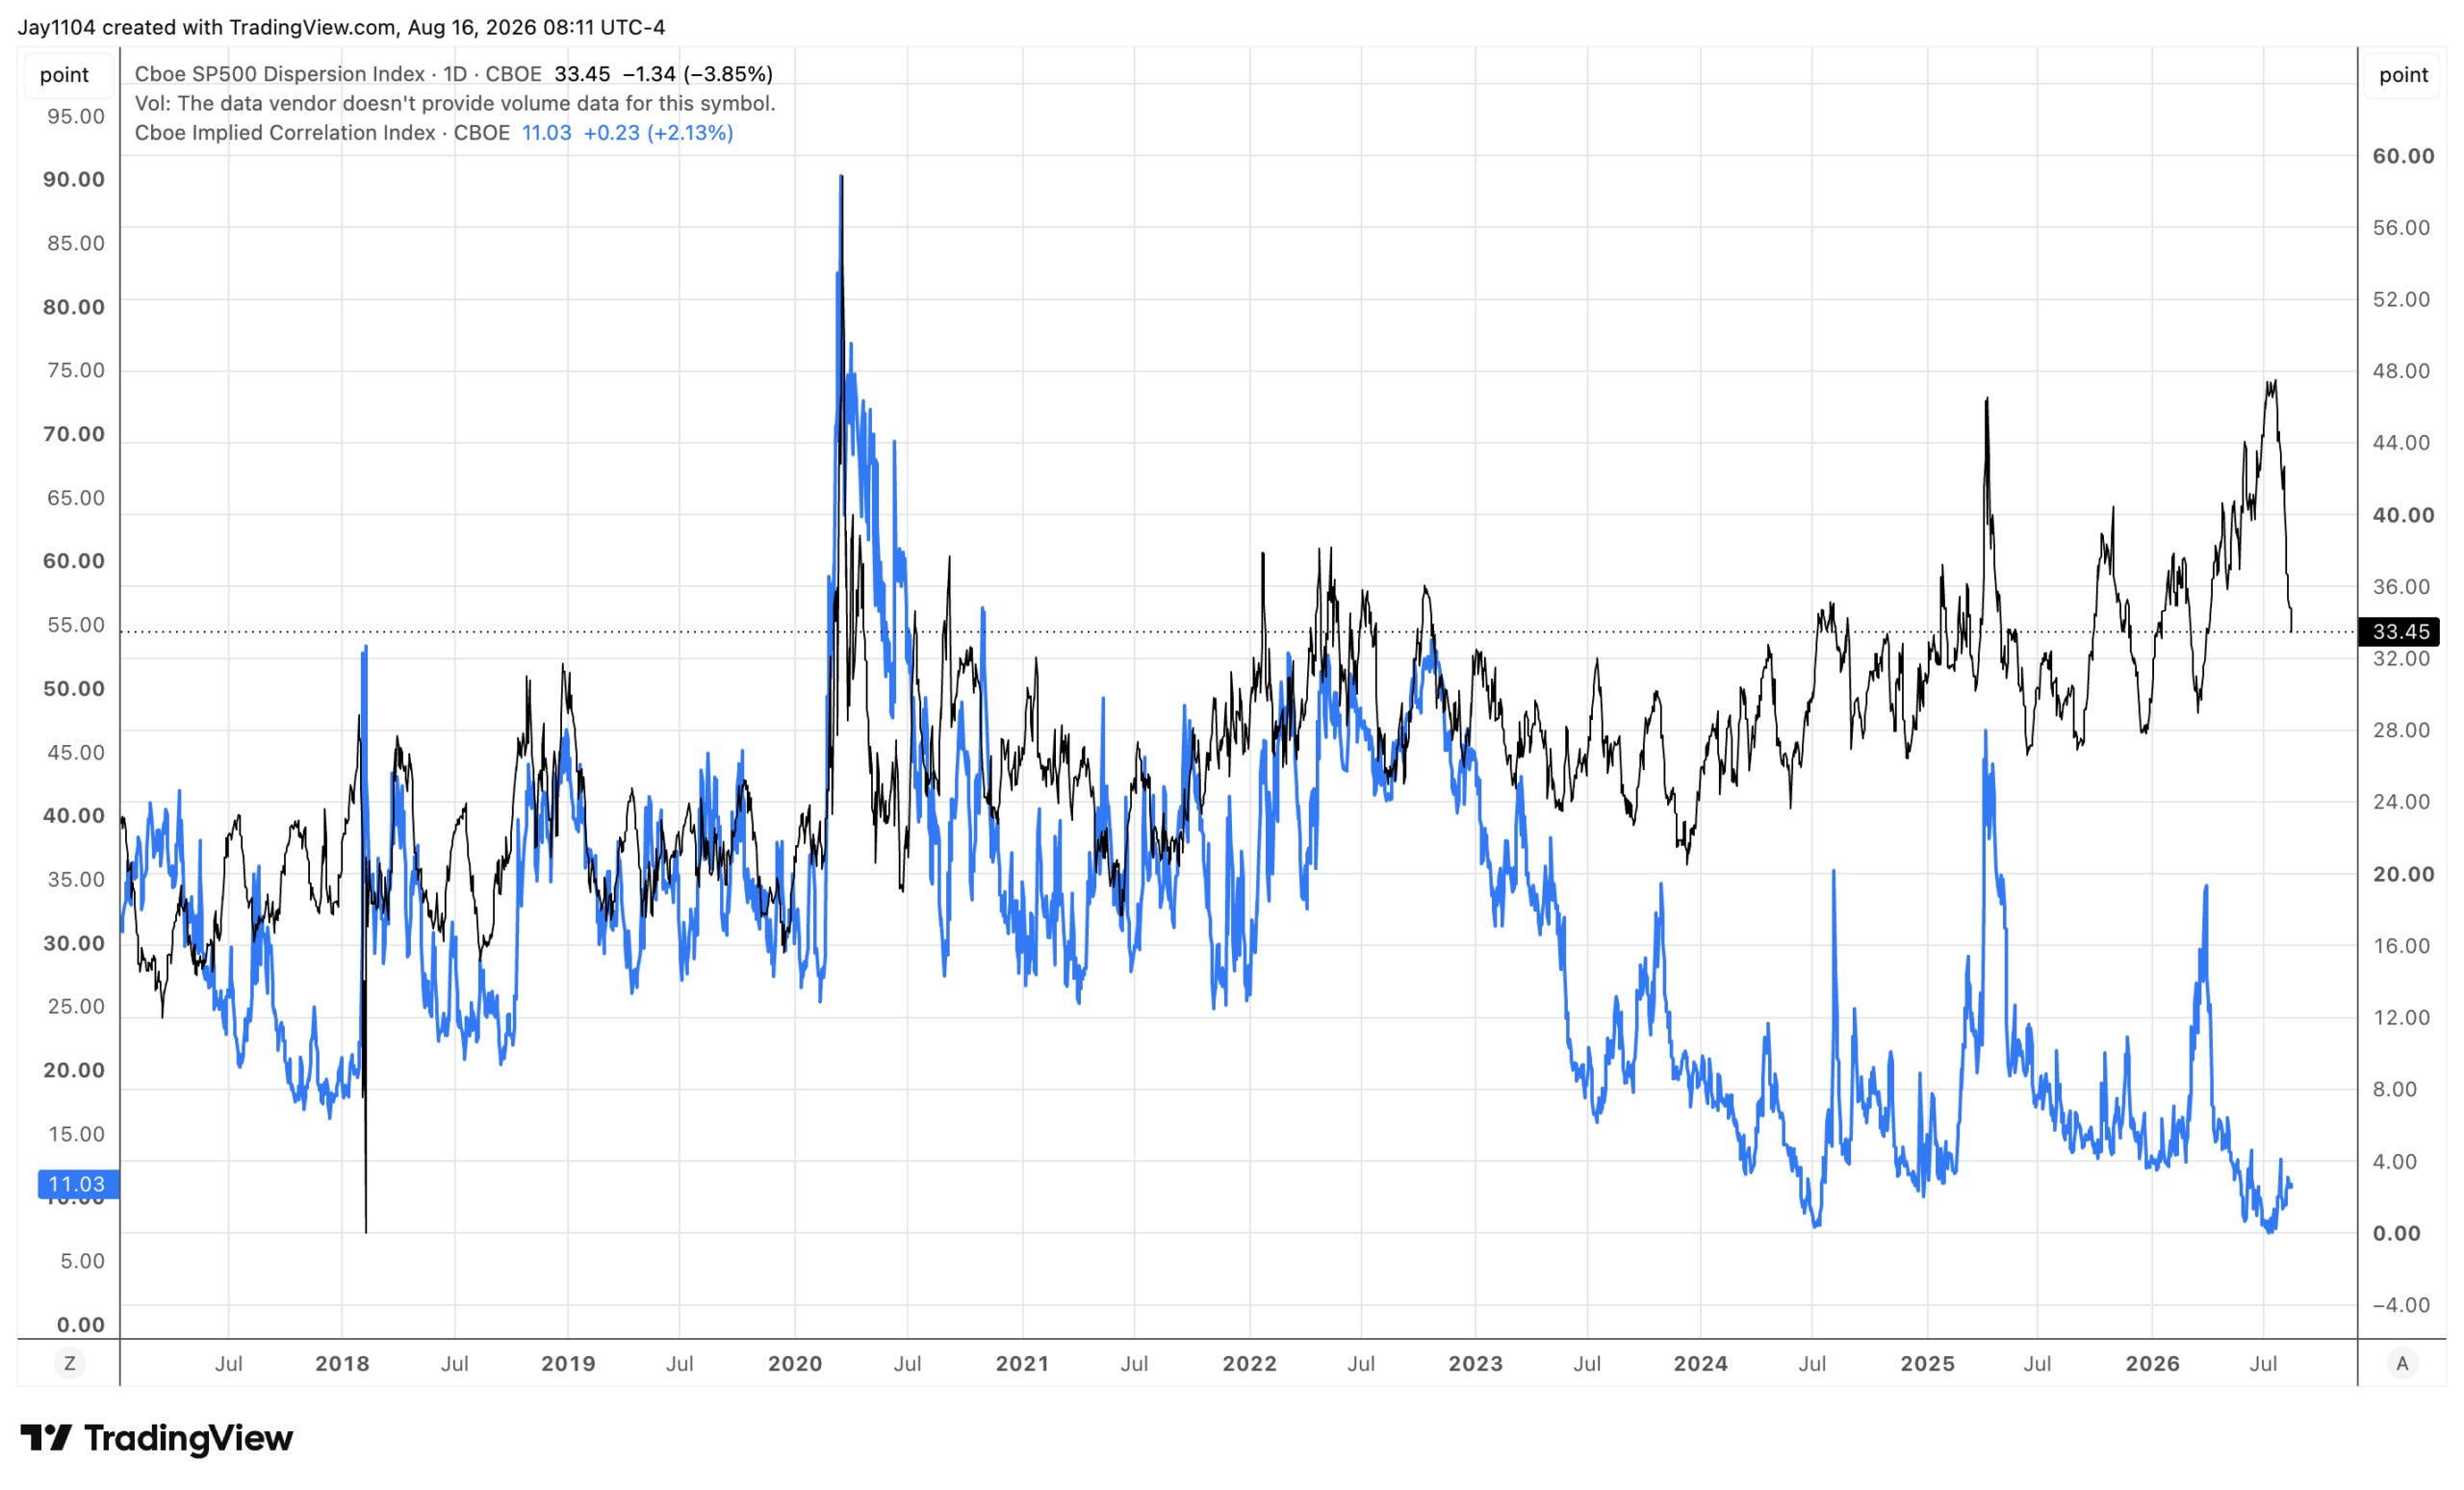
Meanwhile, the Dispersion Index continues to melt. No surprises here, right? I mean, I have been talking about the same thing for months, and it was well advertised that it would unwind after earnings season. The only remaining issue at this point is that implied correlations remain very low. At some point, correlations will be forced higher, and the only reason they haven’t moved higher to this point is that the VIX has been getting pounded every day ahead of OpEx. That could potentially change this week.
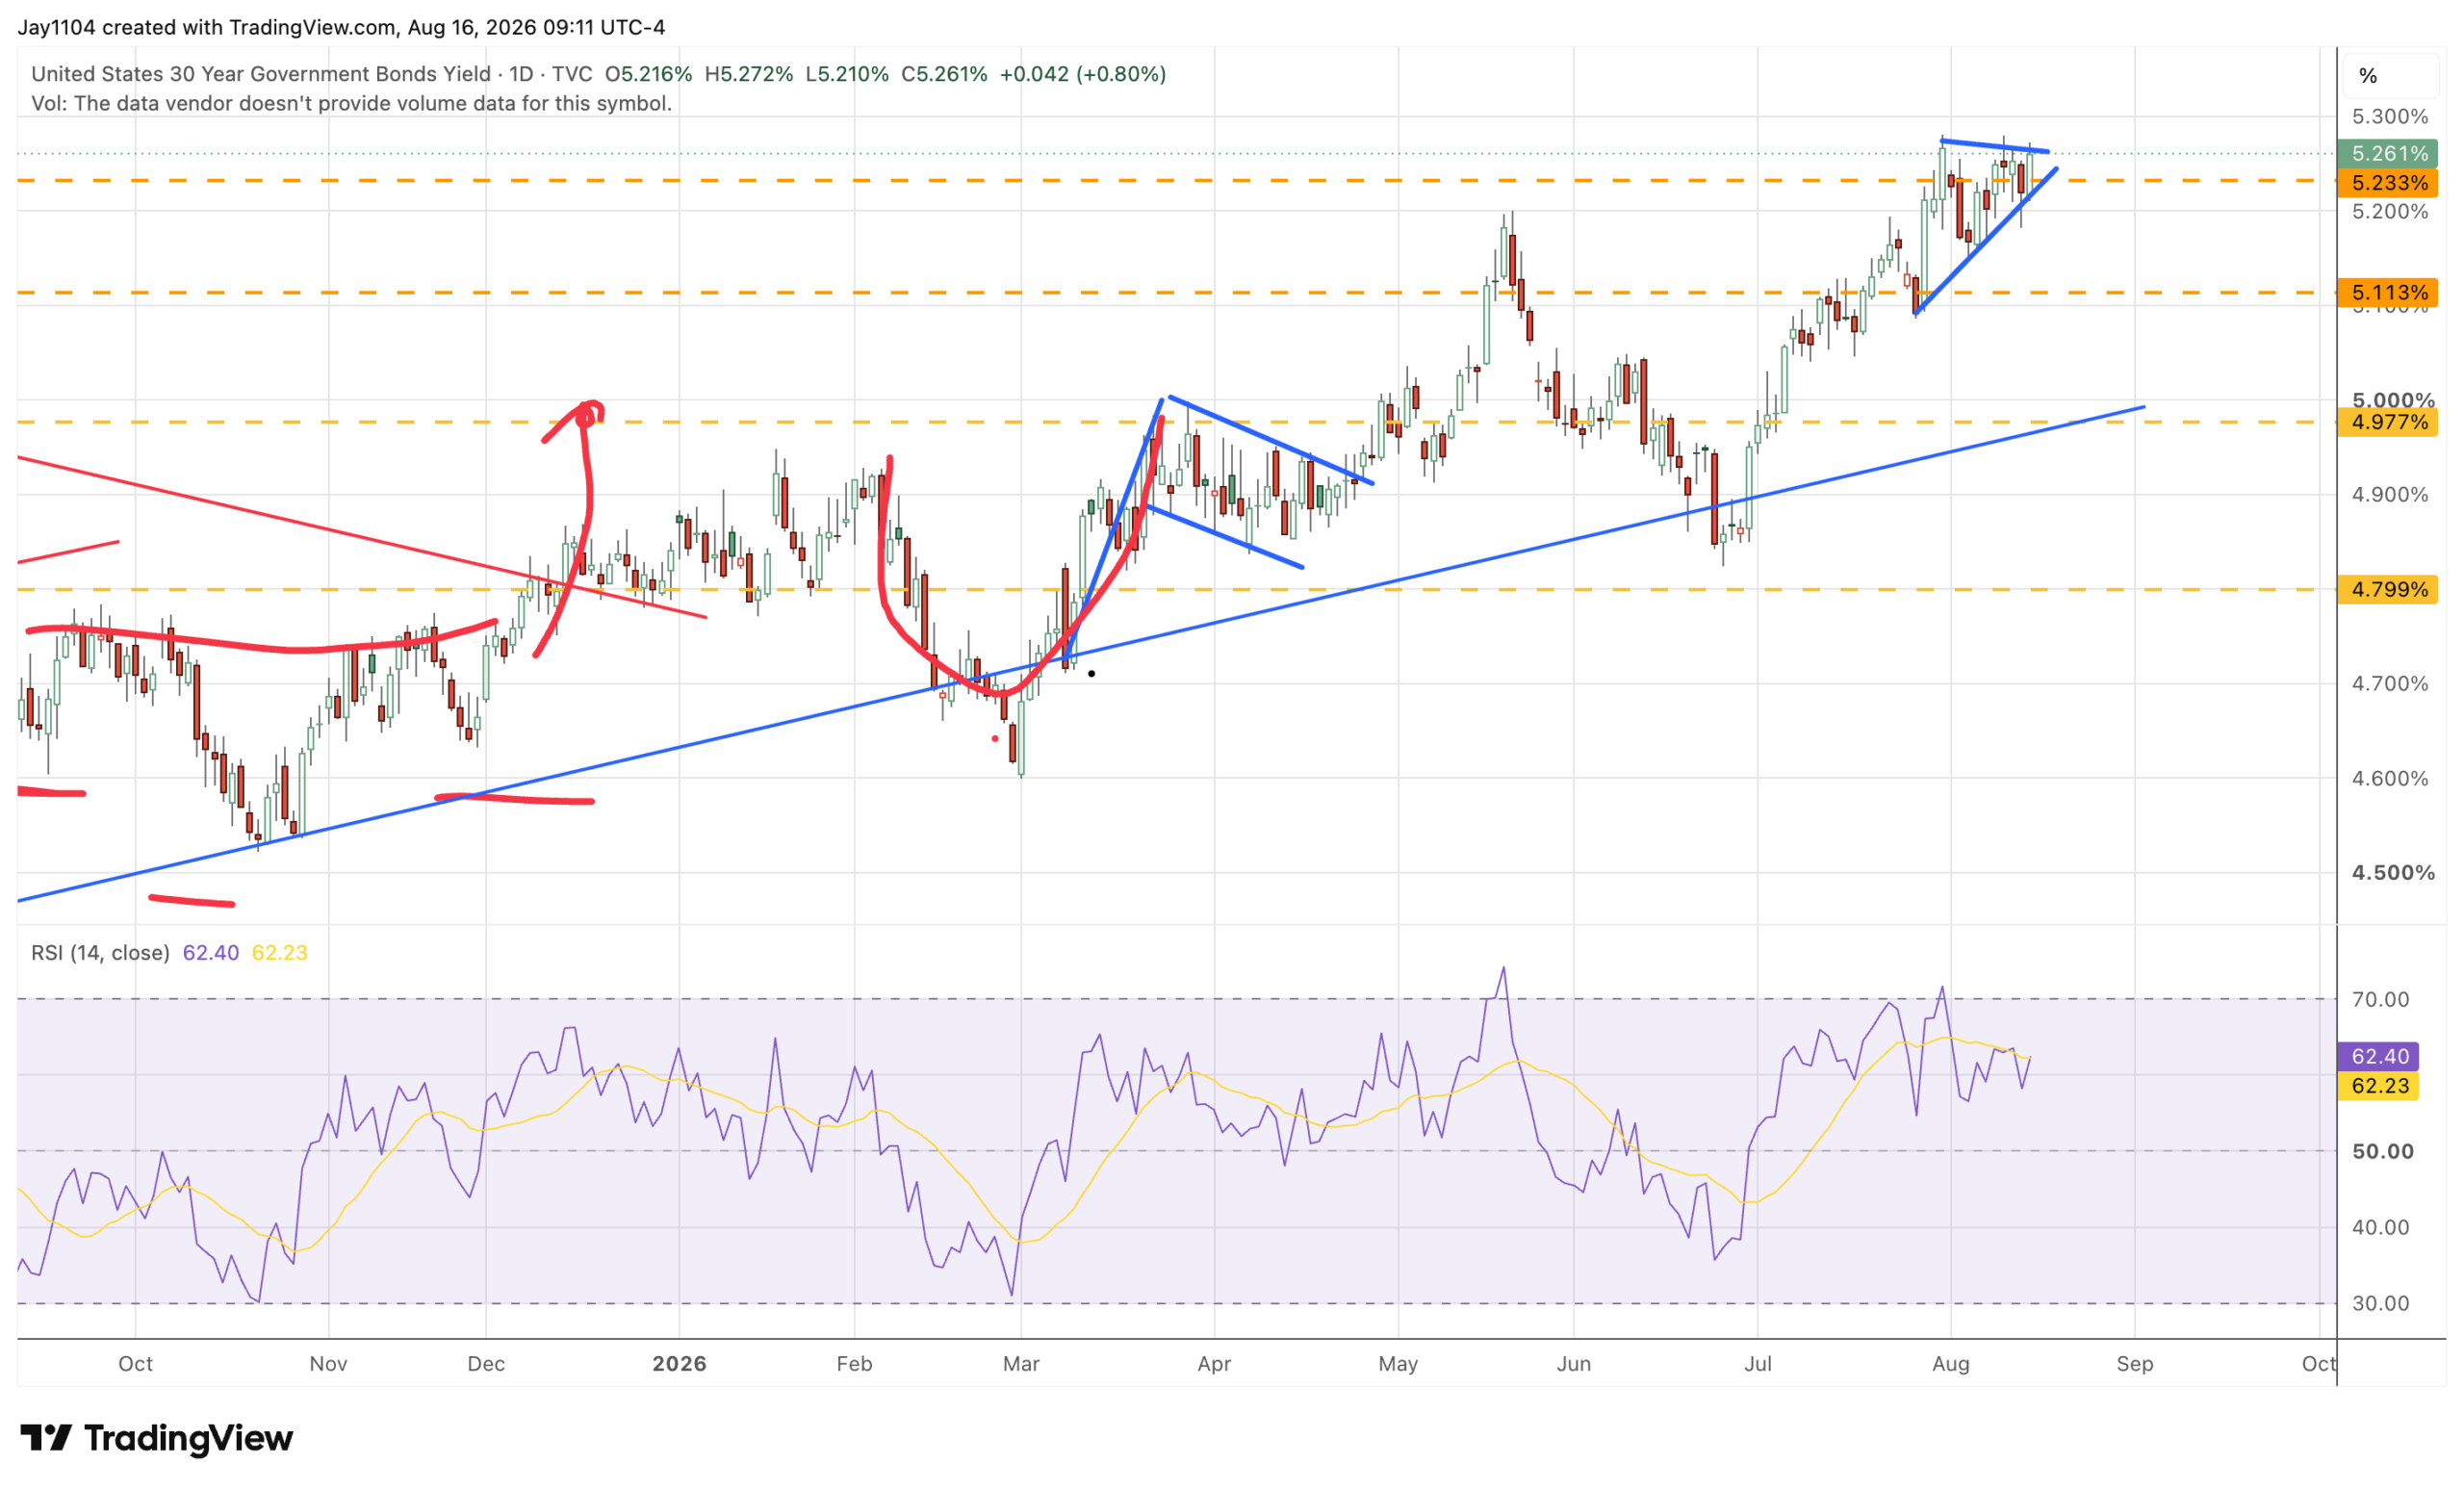
The 30-year rate rose this past week, closing at 5.26%, but more importantly, it appears to be consolidating here, similar to what we saw in USD/JPY a few weeks back. That could mean a breakout to the upside may be in store for the 30-year in the not-too-distant future.
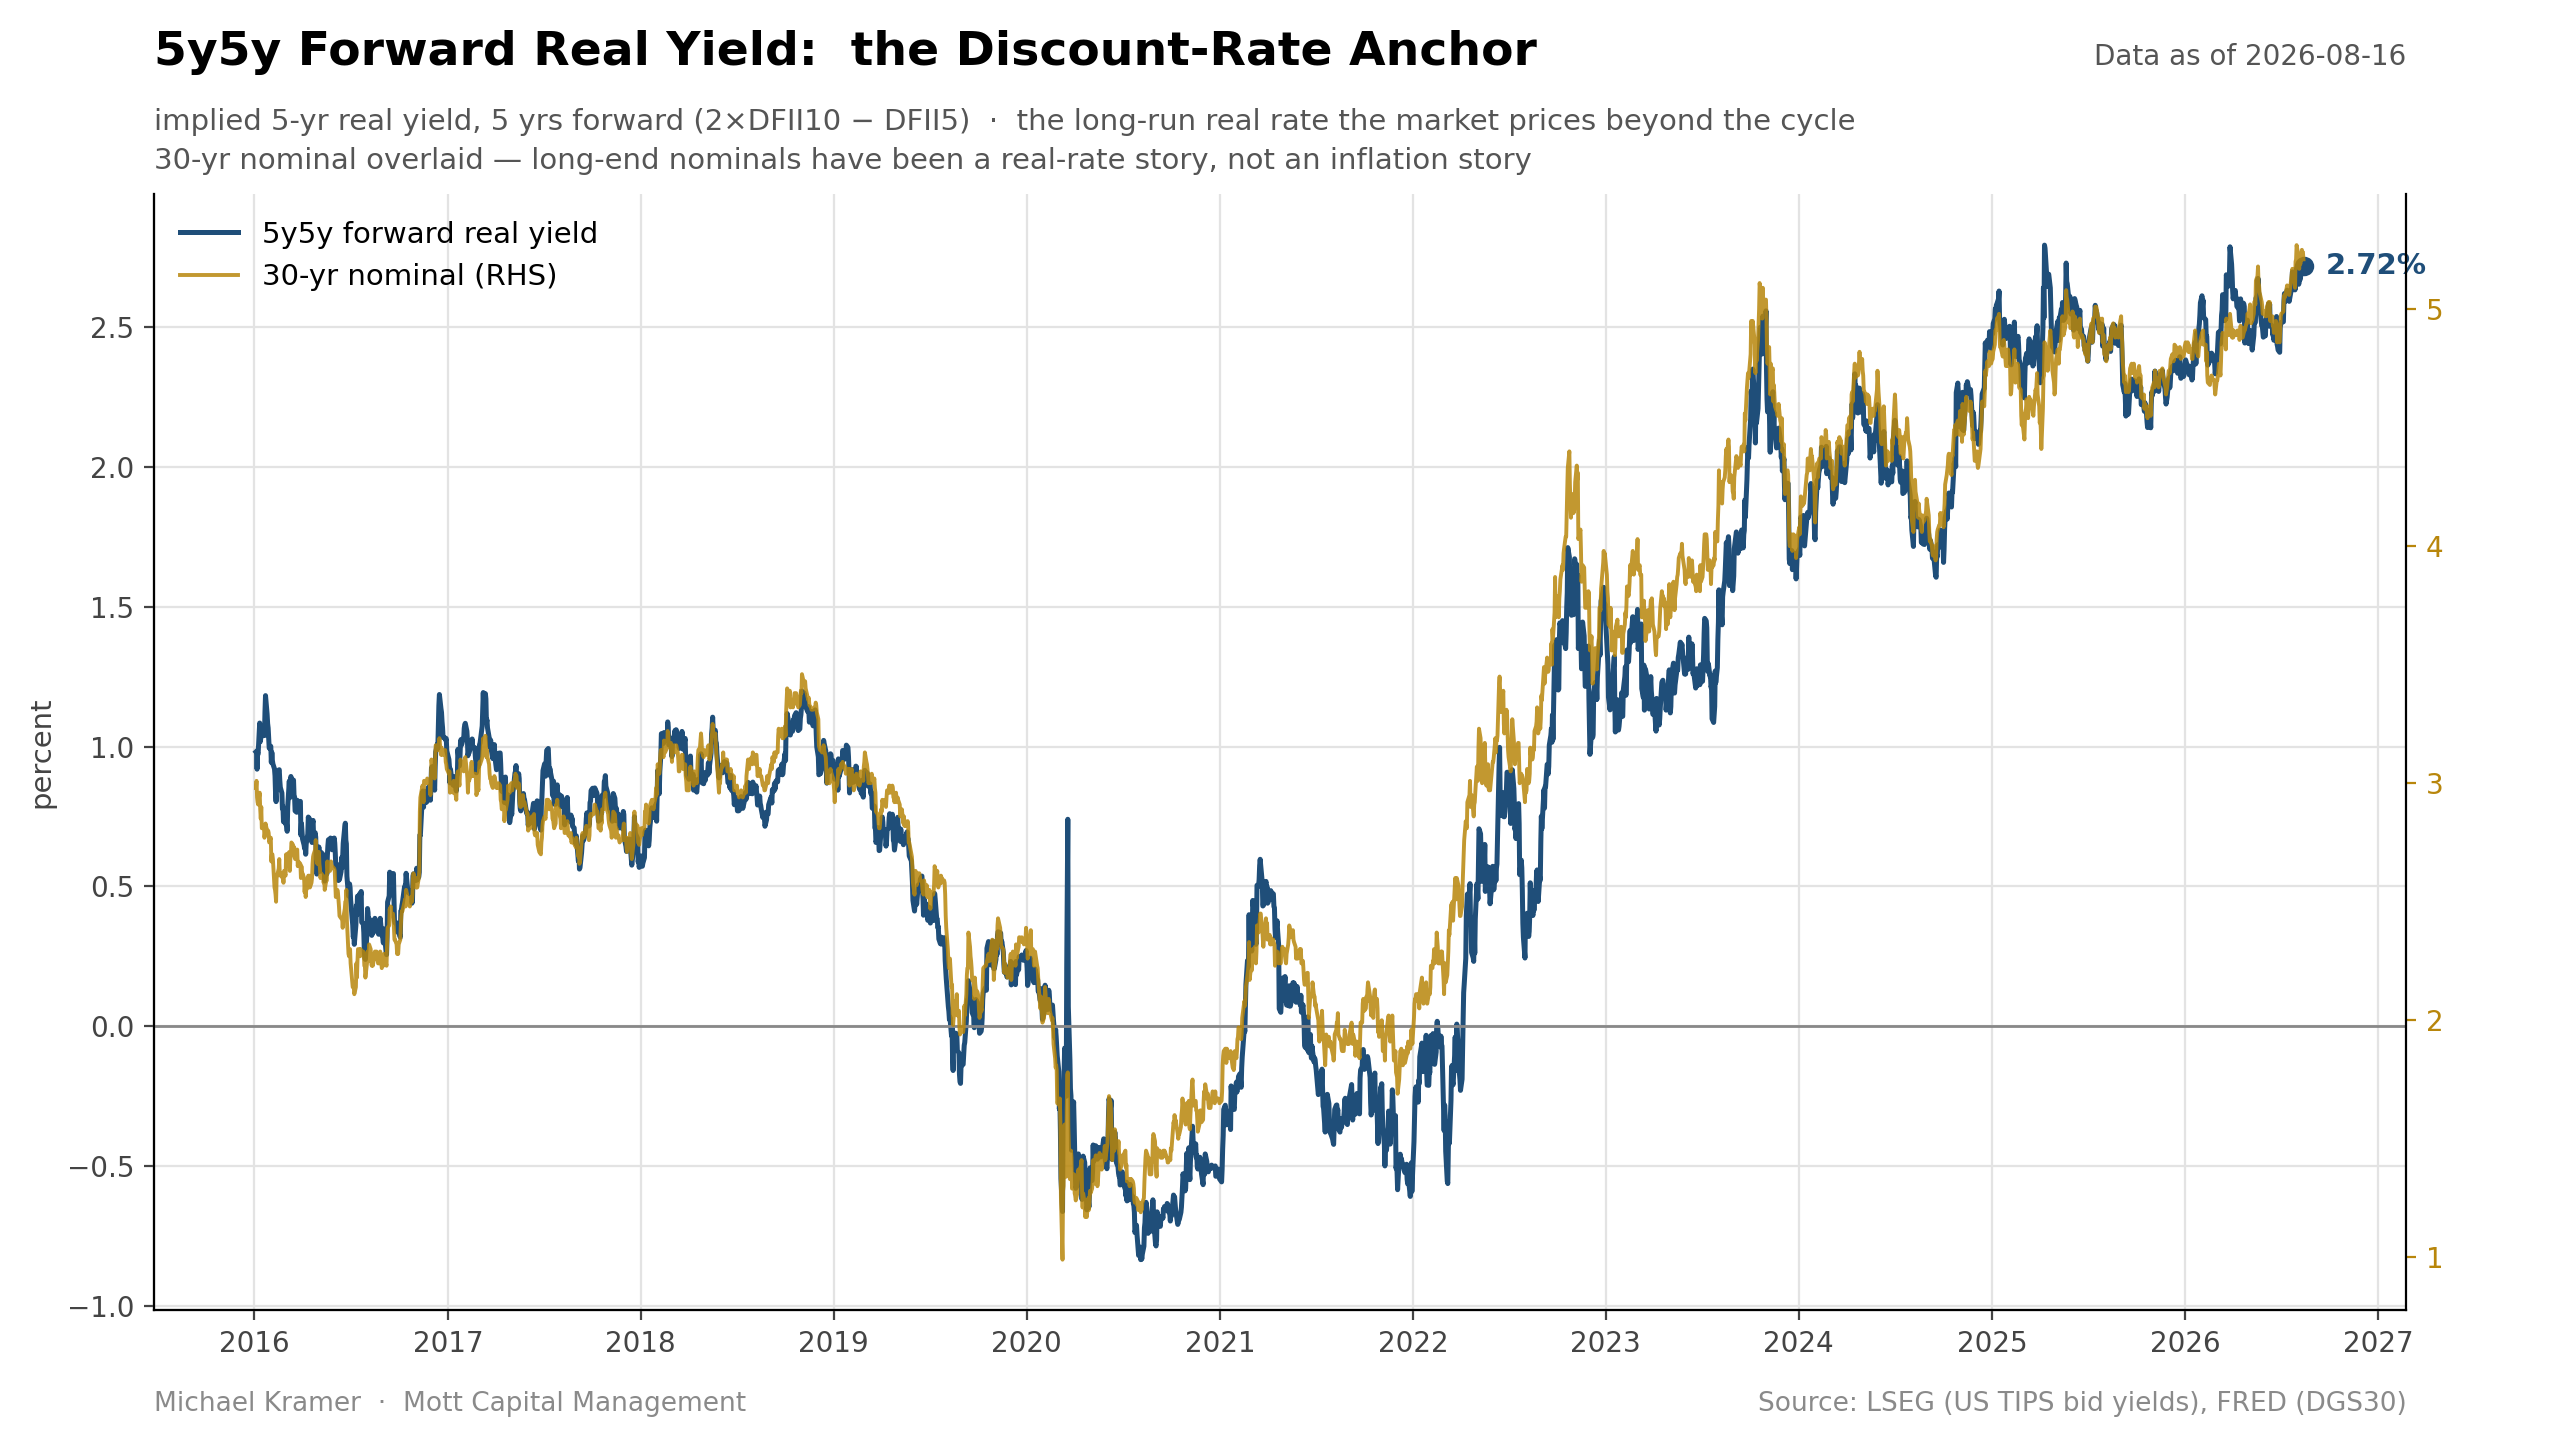
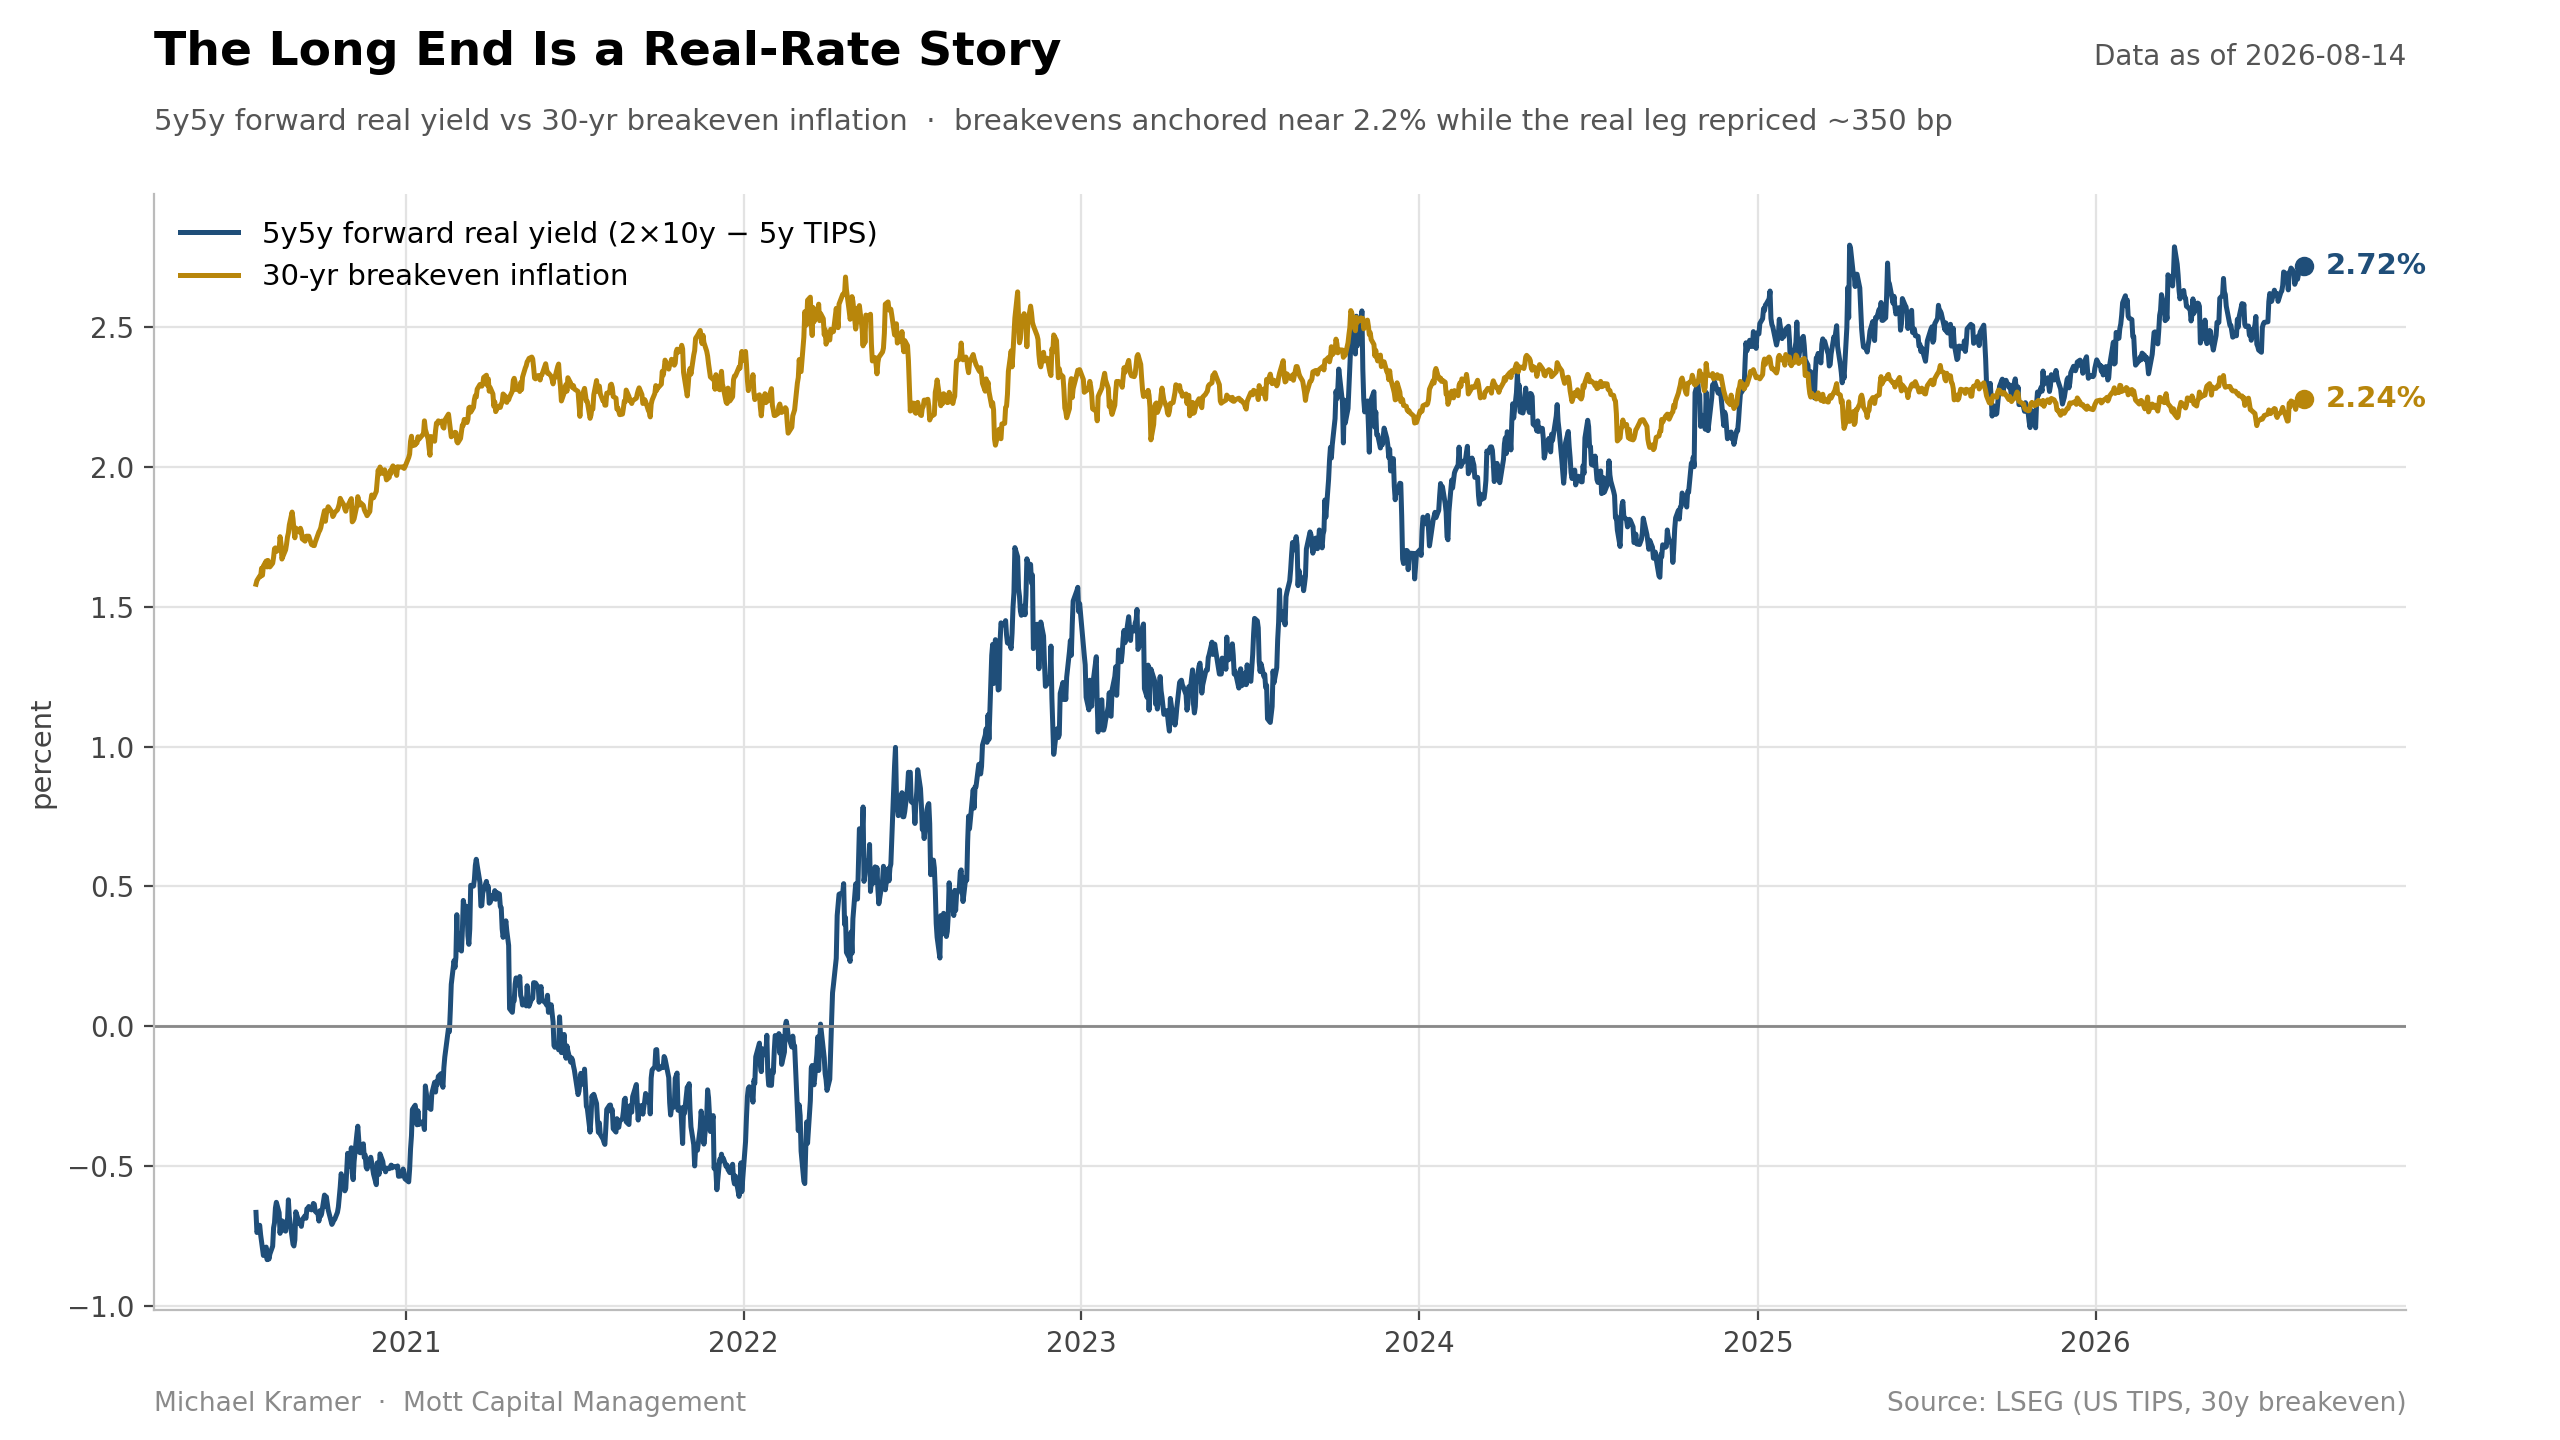
What is interesting is that, as I have been researching real rates and inflation expectations, I found that the 5y5y forward real rate is currently around 2.7%, has been rising, and moves nearly in step with the 30-year nominal rate. That tells us a couple of things, but, most importantly, in my view, it suggests that the market is in the process of repricing the economy’s neutral rate, which is causing nominal rates to rise.
If the market were pricing in higher inflation expectations, then the chart wouldn’t look like this. The 30-year inflation breakeven has been practically flat, stuck between 2.0% and 2.5% since 2021. More importantly, if the 30-year breaks out from here, it would suggest that the market’s assumption for the neutral rate is rising.
That’s all until Monday.
-Mike
Glossary by ChatGPT
30-Year Inflation Breakeven — The market-implied average inflation rate over 30 years, derived from the yield difference between nominal and inflation-protected Treasury securities.
5y5y Forward Real Rate — The market-implied five-year real interest rate beginning five years from today, used to assess longer-term expectations for inflation-adjusted rates.
Dispersion Index — A measure of the expected variation in returns among individual stocks relative to the broader index.
E-minis — Electronically traded futures contracts representing a fraction of the value of standard futures contracts, including those linked to the S&P 500.
Gamma Squeeze — A market move accelerated by options dealers adjusting their hedges as the underlying asset’s price changes.
Implied Correlation — The options market’s expectation for how closely the components of an index will move together.
Inflation Breakeven — The difference between nominal Treasury and comparable inflation-protected Treasury yields, representing the market’s implied inflation expectation.
Neutral Rate — The theoretical interest rate consistent with an economy operating at full employment and stable inflation without stimulating or restricting growth.
Nominal Rate — An interest rate that has not been adjusted for inflation.
OpEx — Options expiration, when outstanding options contracts expire and related positioning and hedging flows can affect markets.
Paydowns — Periods when Treasury securities mature or are redeemed in amounts exceeding new issuance, reducing the net supply of government debt.
T-Bill Liquidity — Market liquidity associated with Treasury bill issuance and repayment that can influence the amount of cash available within the financial system.
Treasury Issuance — The sale of U.S. government debt securities to finance federal borrowing requirements.
VIX — The Cboe Volatility Index, which measures the options market’s expectation of near-term S&P 500 volatility.
Disclosure
This report contains independent commentary to be used for informational and educational purposes only. Michael Kramer is a member and investment adviser representative with Mott Capital Management. Mr. Kramer is not affiliated with this company and does not serve on the board of any related company that issued this stock. All opinions and analyses presented by Michael Kramer in this analysis or market report are solely Michael Kramer’s views. Readers should not treat any opinion, viewpoint, or prediction expressed by Michael Kramer as a specific solicitation or recommendation to buy or sell a particular security or follow a particular strategy. Michael Kramer’s analyses are based upon information and independent research that he considers reliable, but neither Michael Kramer nor Mott Capital Management guarantees its completeness or accuracy, and it should not be relied upon as such. Michael Kramer is not under any obligation to update or correct any information presented in his analyses. Mr. Kramer’s statements, guidance, and opinions are subject to change without notice. Past performance is not indicative of future results. Neither Michael Kramer nor Mott Capital Management guarantees any specific outcome or profit. You should be aware of the real risk of loss in following any strategy or investment commentary presented in this analysis. Strategies or investments discussed may fluctuate in price or value. Investments or strategies mentioned in this analysis may not be suitable for you. This material does not consider your particular investment objectives, financial situation, or needs and is not intended as a recommendation appropriate for you. You must make an independent decision regarding investments or strategies in this analysis. Upon request, the advisor will provide a list of all recommendations made during the past twelve months. Before acting on information in this analysis, you should consider whether it is suitable for your circumstances and strongly consider seeking advice from your own financial or investment adviser to determine the suitability of any investment.