
2-Year Treasury Yield Nears Key Breakout as CDS Spreads Widen

Please remember to subscribe to my Substack to receive this free daily commentary—which I work very hard to produce—directly in your inbox.

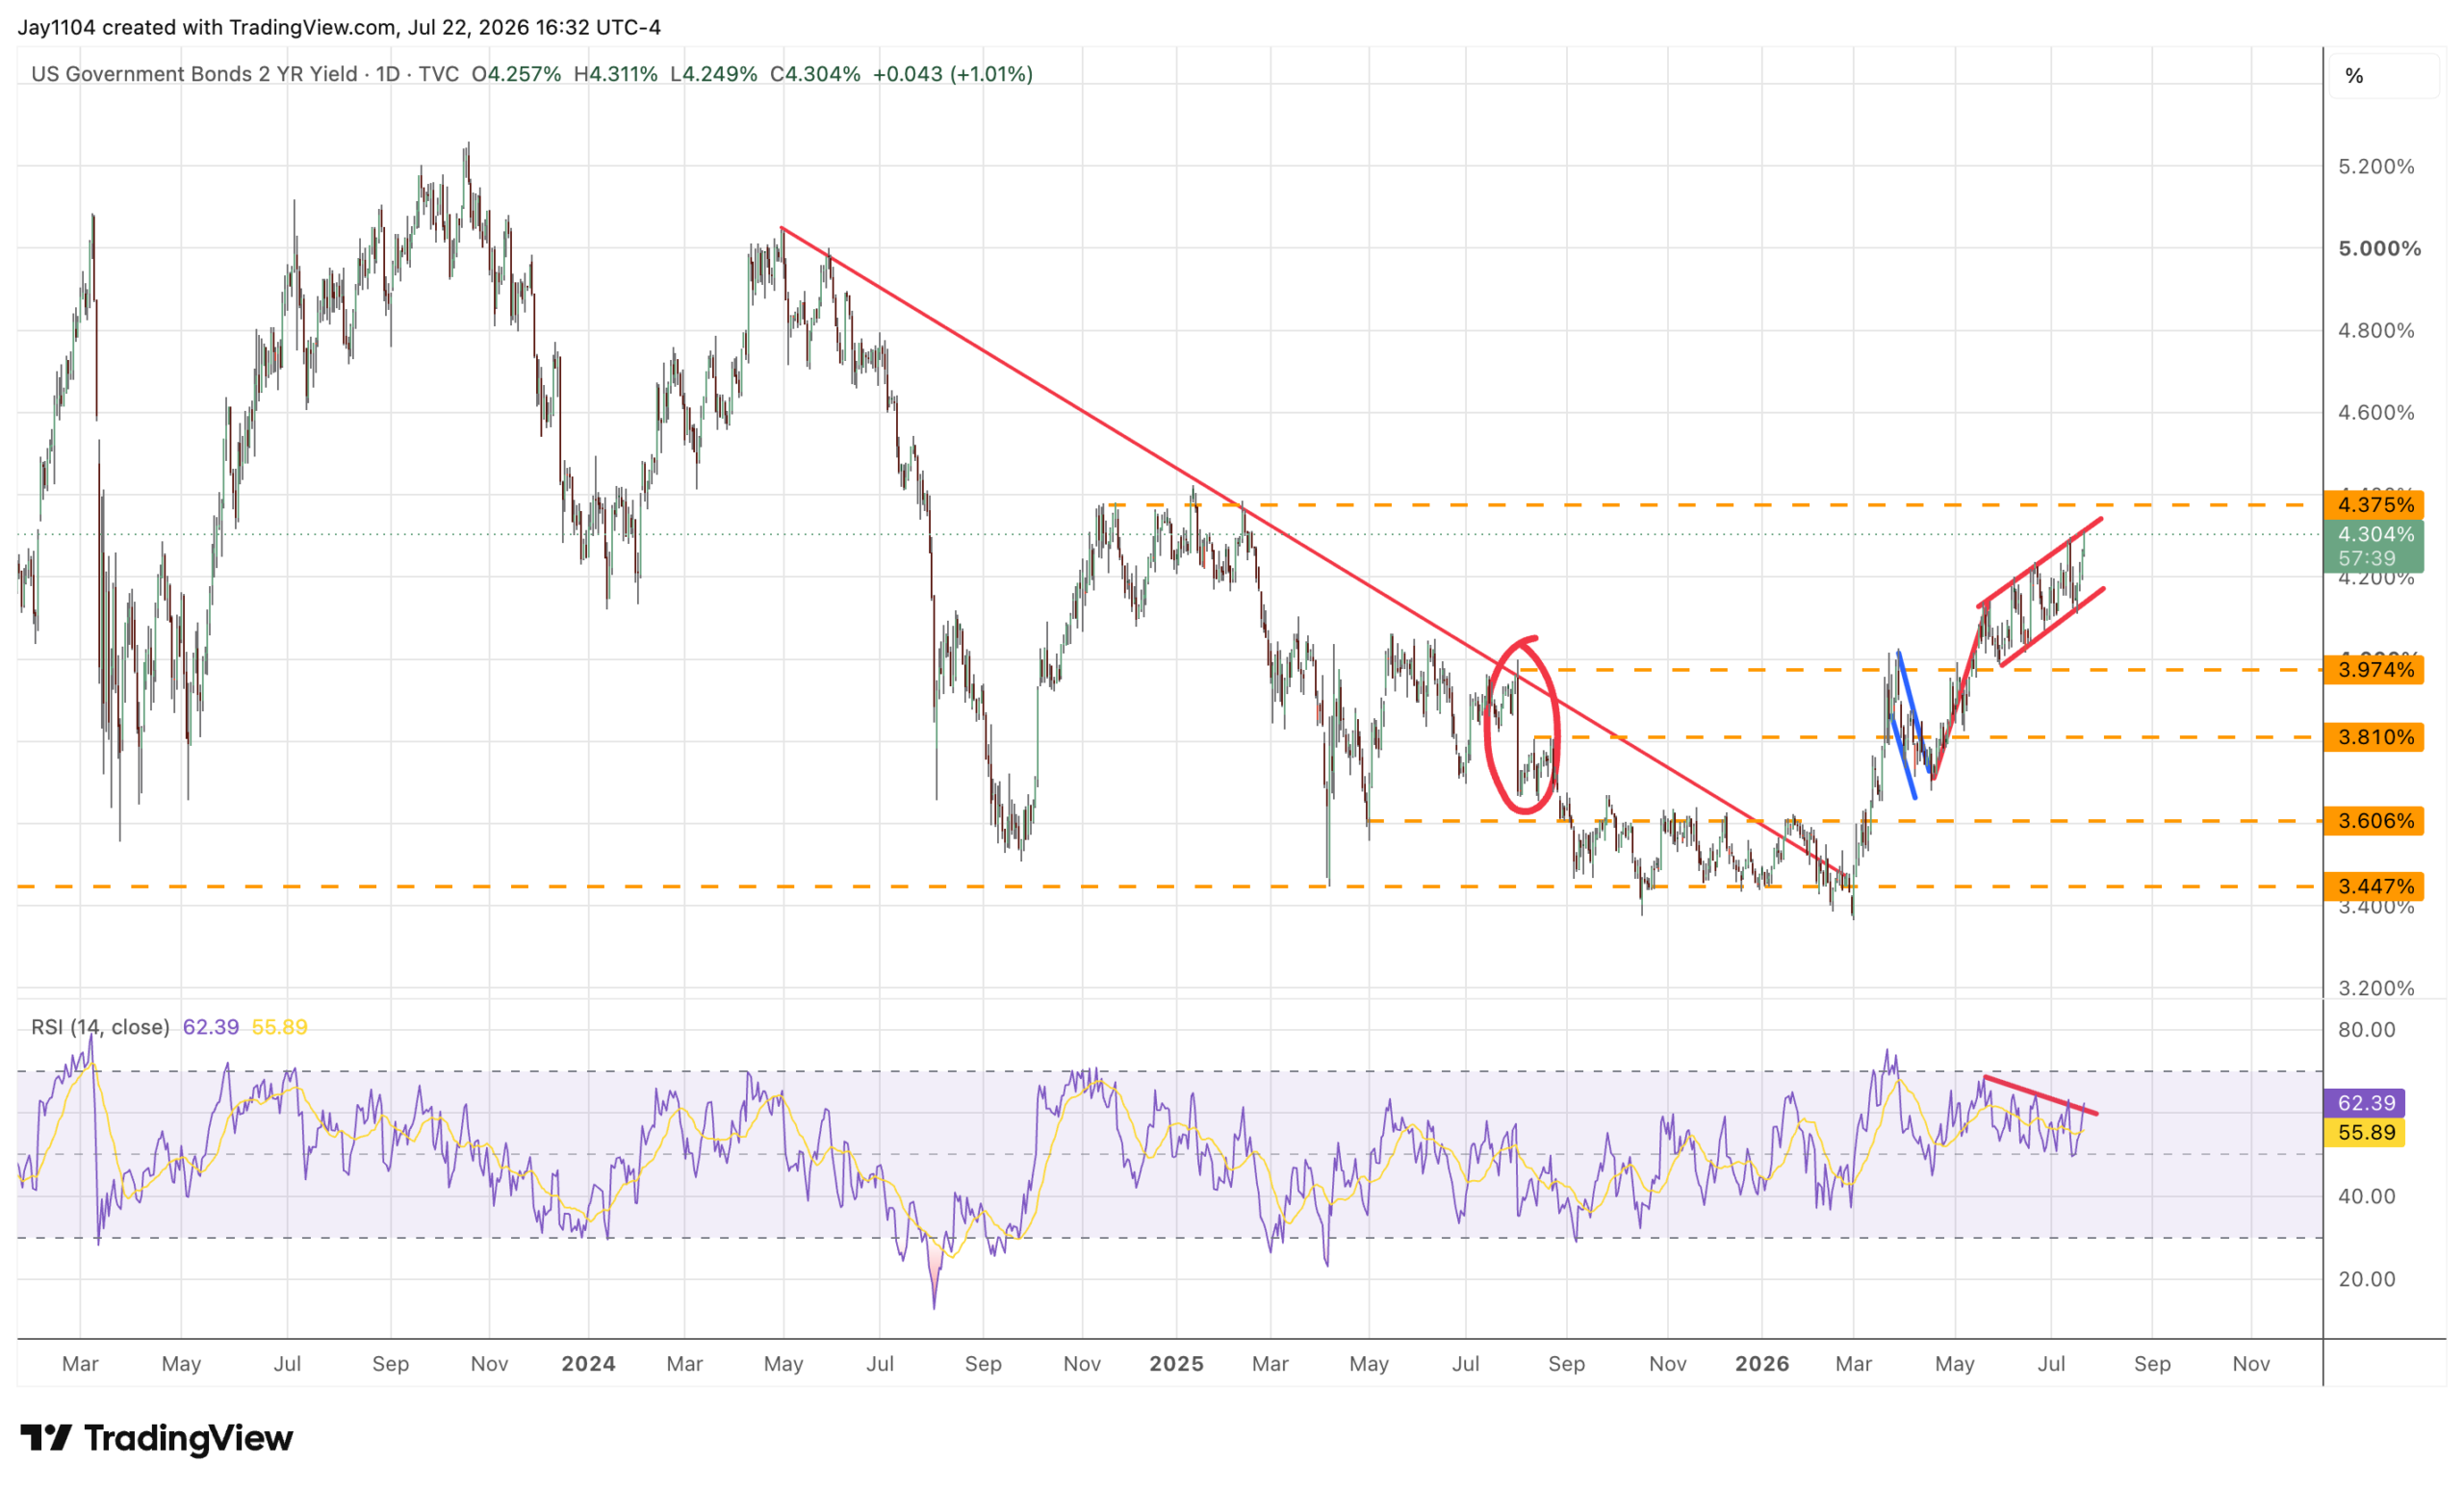
Rates moved higher again, with the 2-year Treasury yield rising to 4.3%. It is now approaching a level at which a significant move could be developing, either higher or lower. For now, the 2-year remains in a rising channel, which can serve as either a continuation pattern or, on occasion, a reversal pattern. More recently, however, I have found that these patterns have tended to act as continuation formations.
The 2-year still has more to prove and needs to break above resistance around 4.4%. If it can do that, the yield could be on its way significantly higher, potentially toward the 4.75% to 5.0% range.
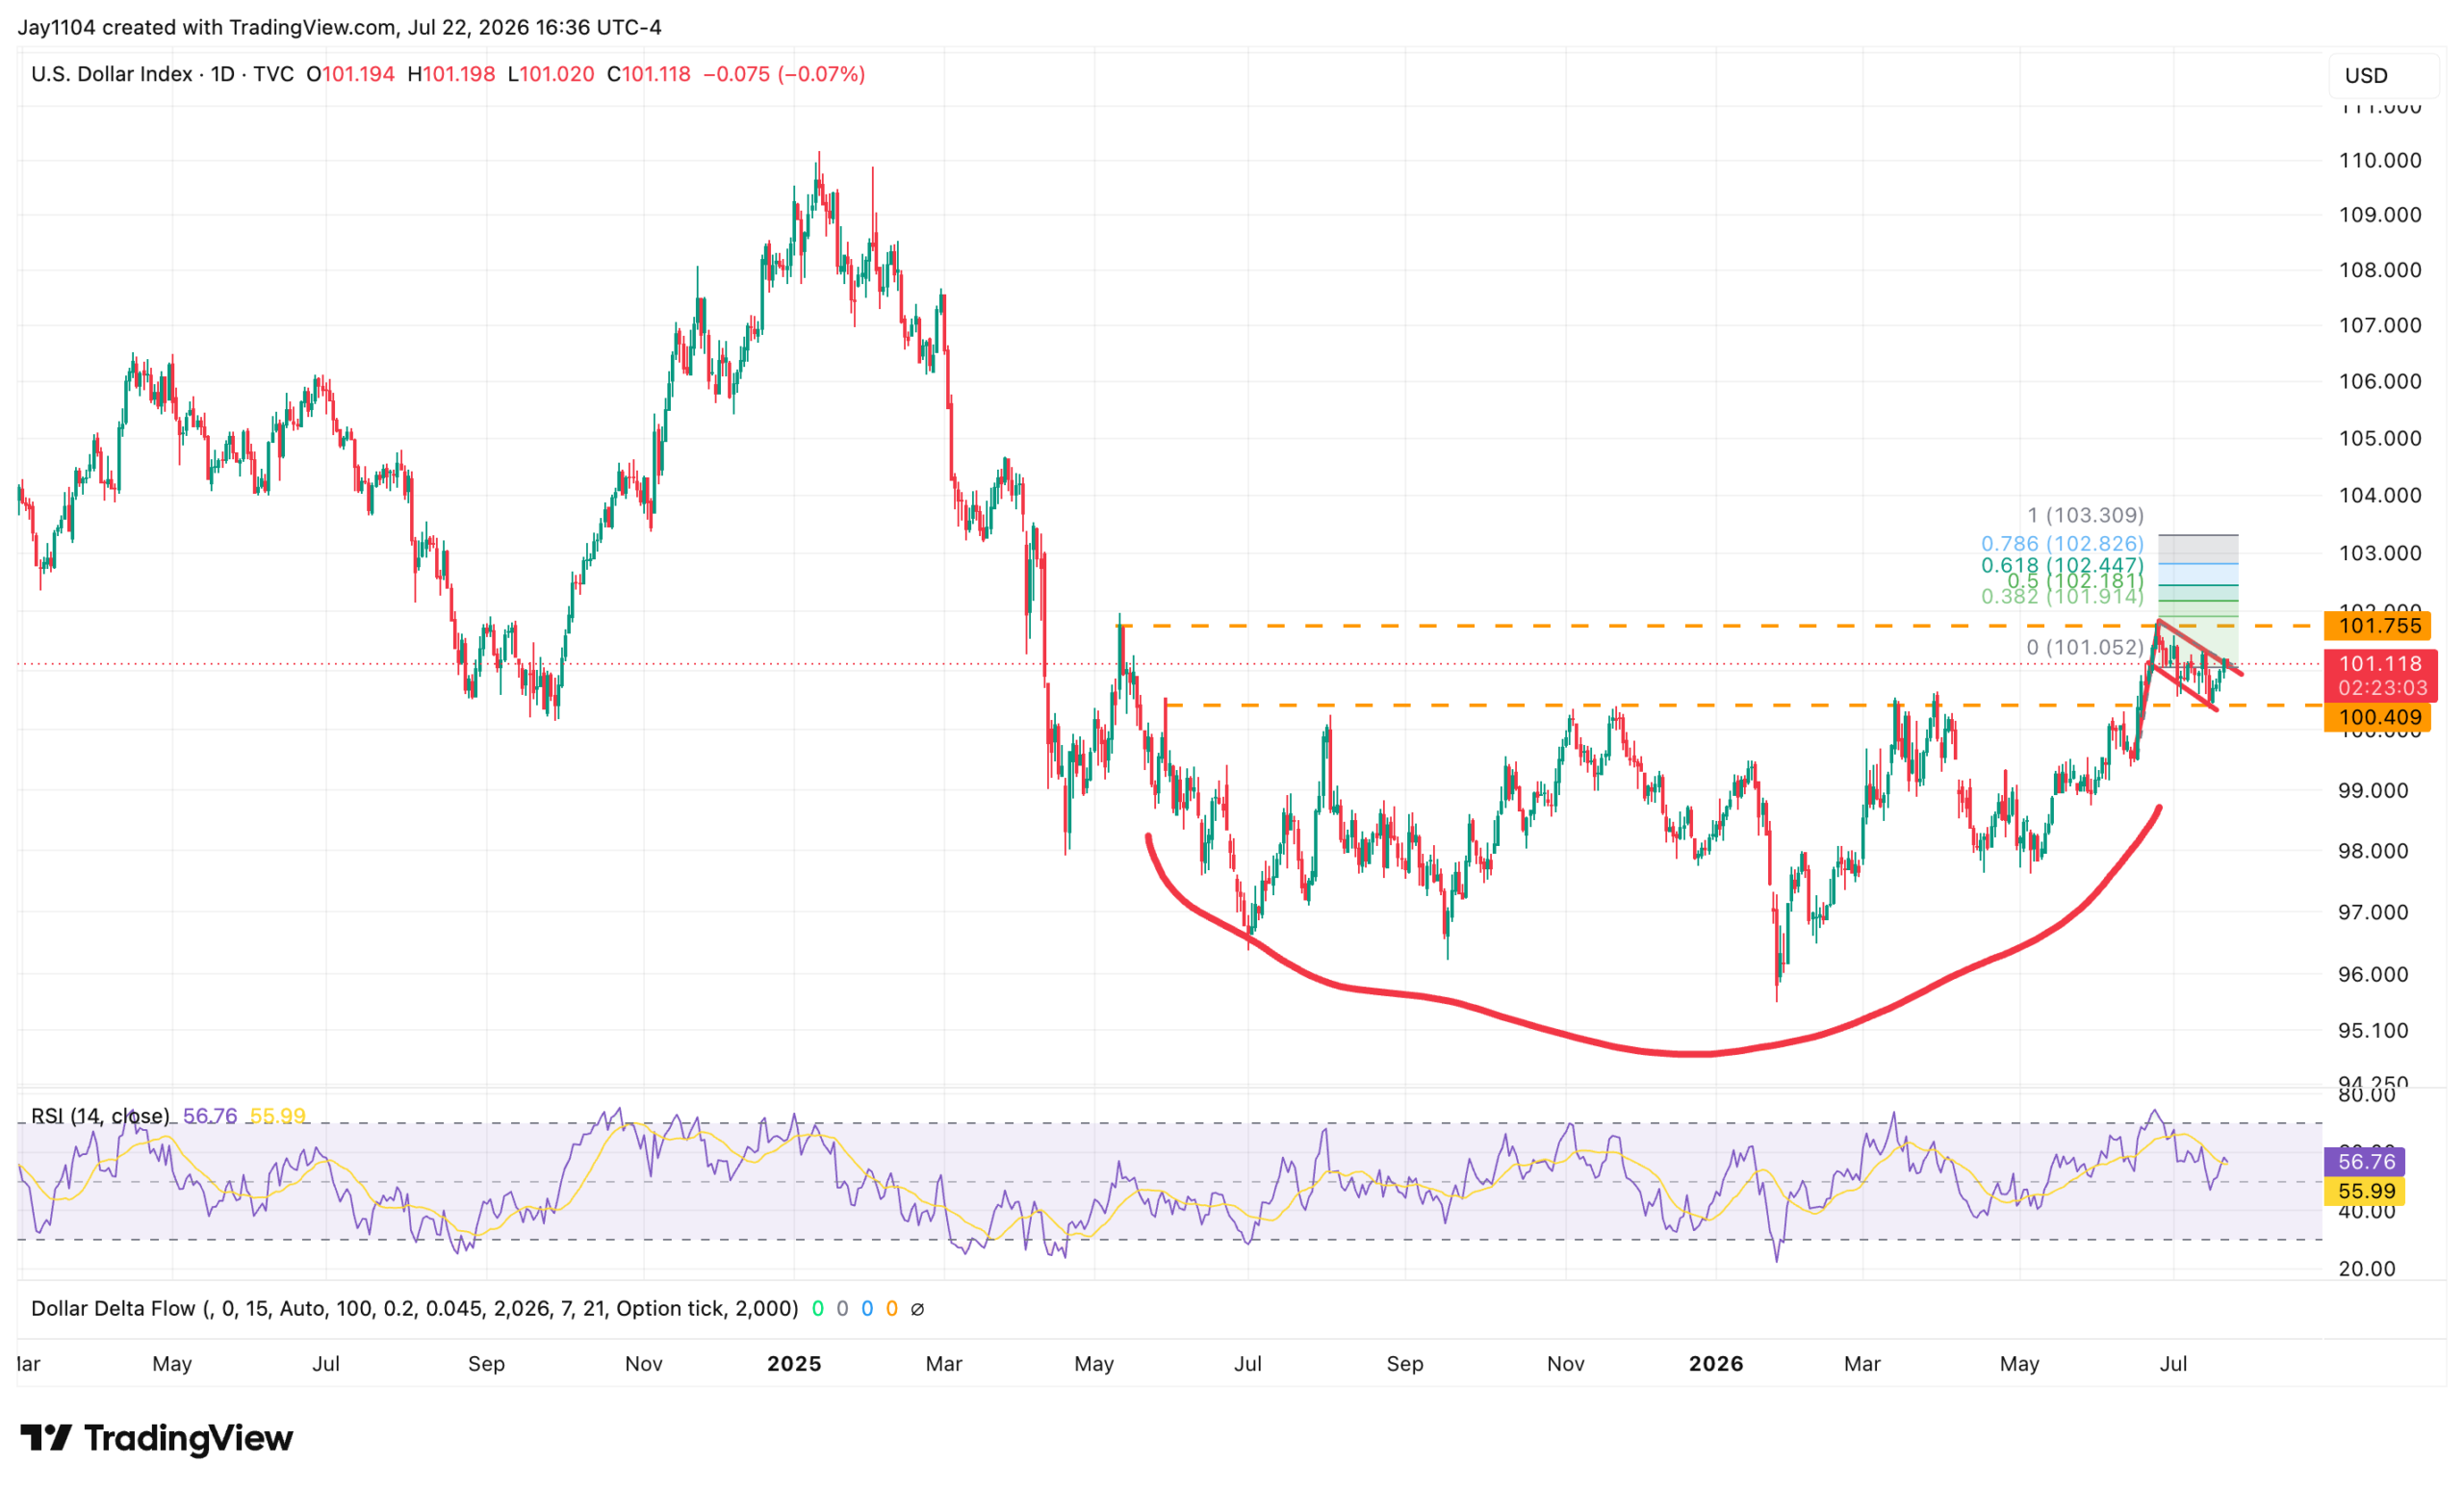
The dollar continues to form a bull flag pattern, and with the ECB meeting on Thursday, there is an opportunity for the next leg higher to develop. That is especially true if the ECB strikes a more dovish tone than markets expect. Currently, the market is pricing in just one additional ECB rate hike between now and the end of 2026.
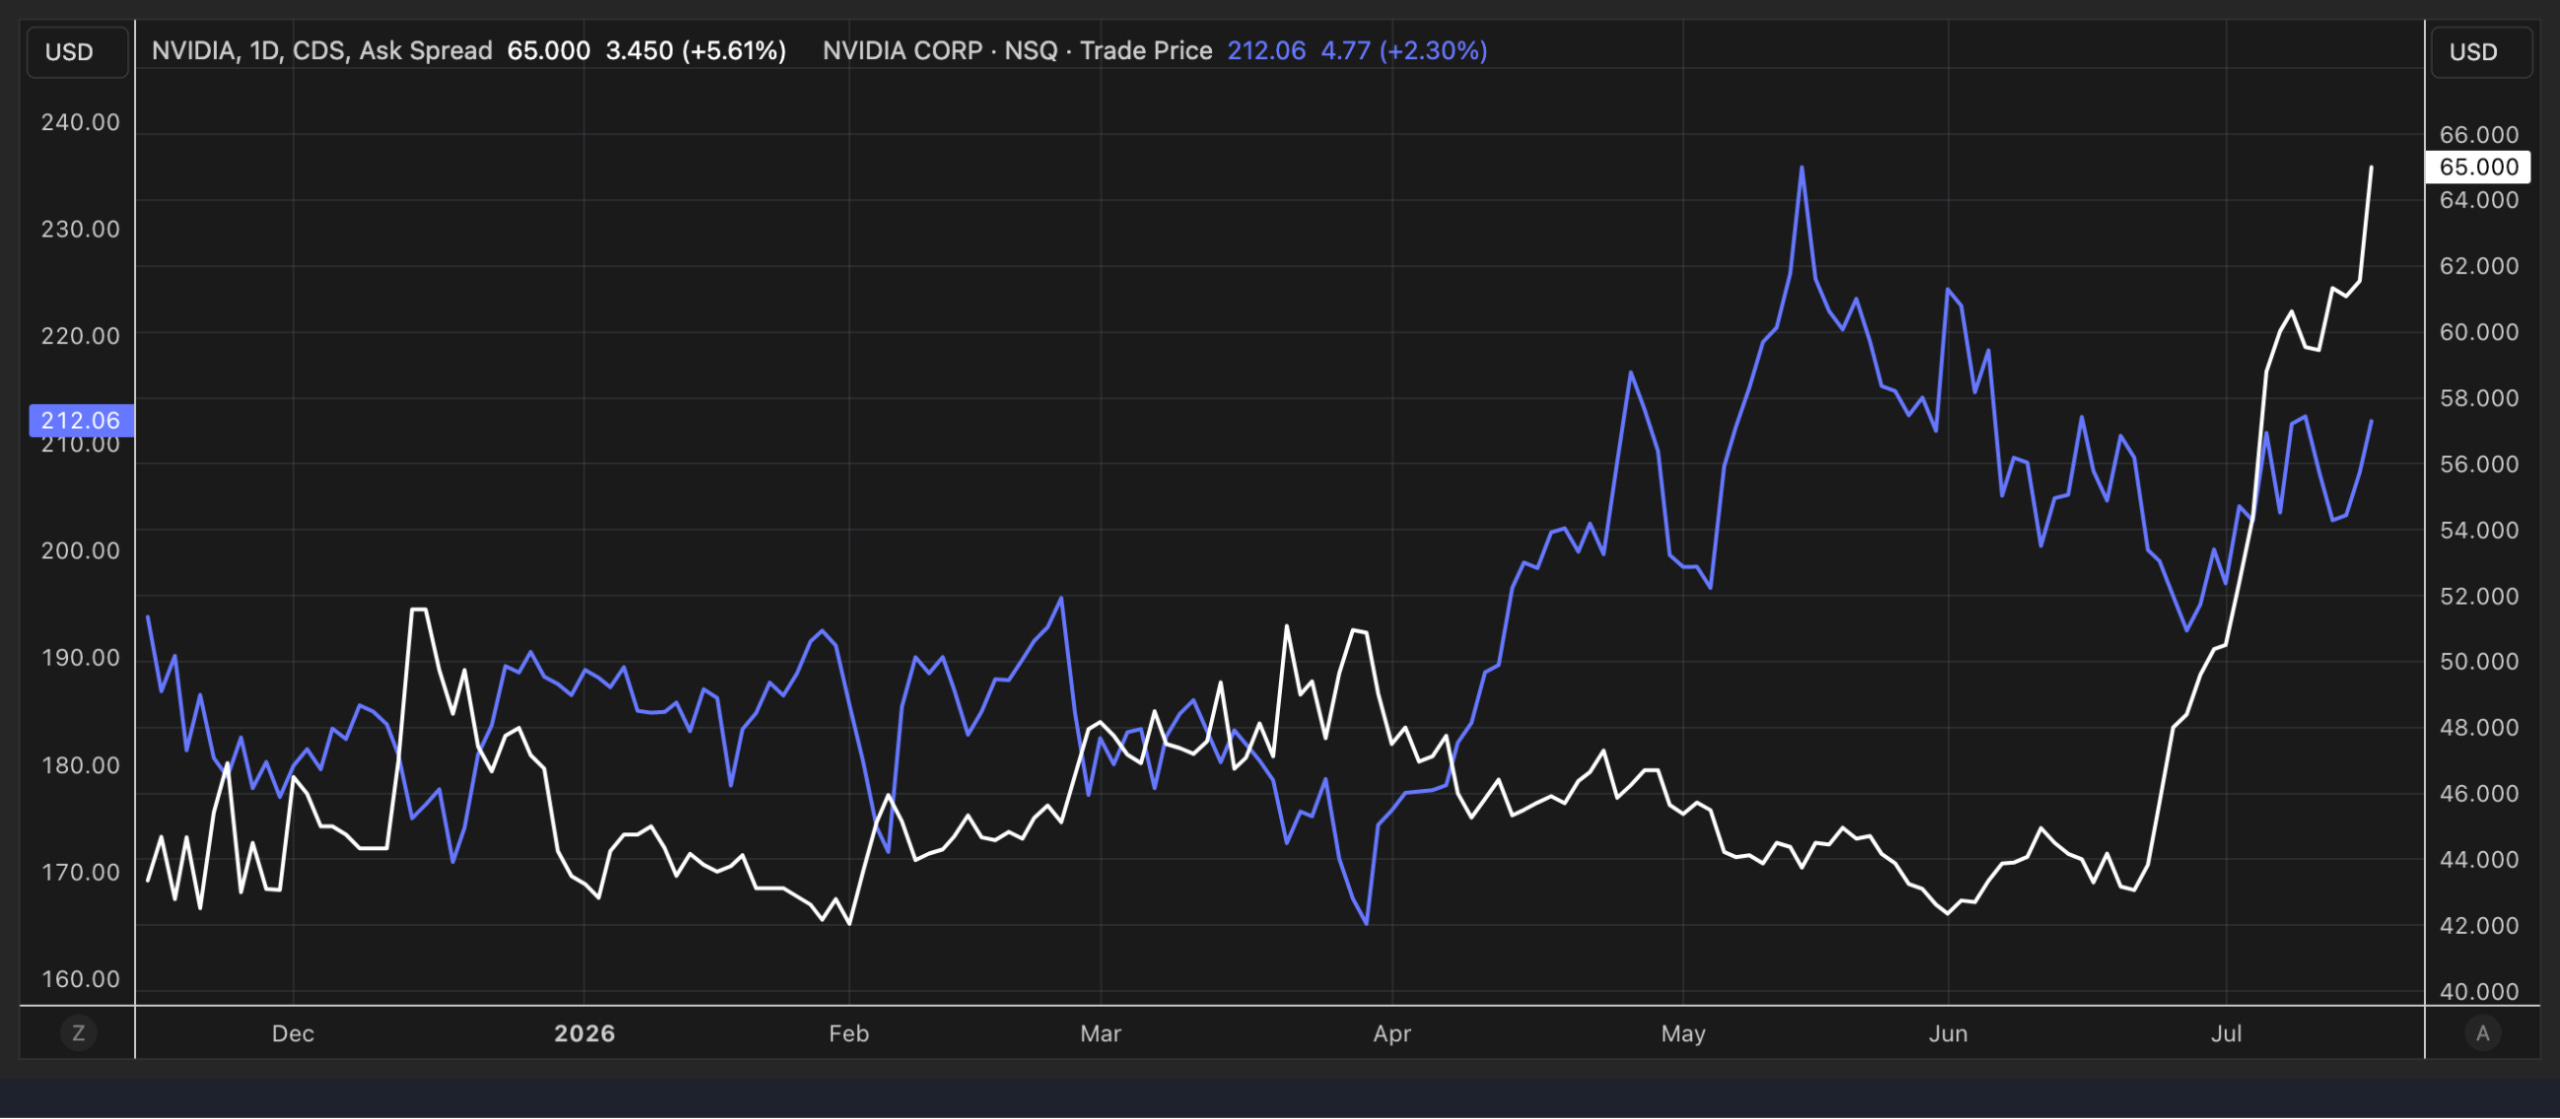
In the meantime, CDS spreads widened again today across the semiconductor sector, with Nvidia once again leading the move. The ask spread rose to 65 basis points, implying a roughly 5% cumulative default probability over five years. That remains a relatively low level in absolute terms. However, what stands out is the steady increase in the spread, which suggests the credit market is becoming increasingly cautious.
At the same time, Nvidia’s stock continued to rise today, meaning we remain in an unusual situation where the equity price is advancing even as the company’s CDS spread widens.
(LSEG)
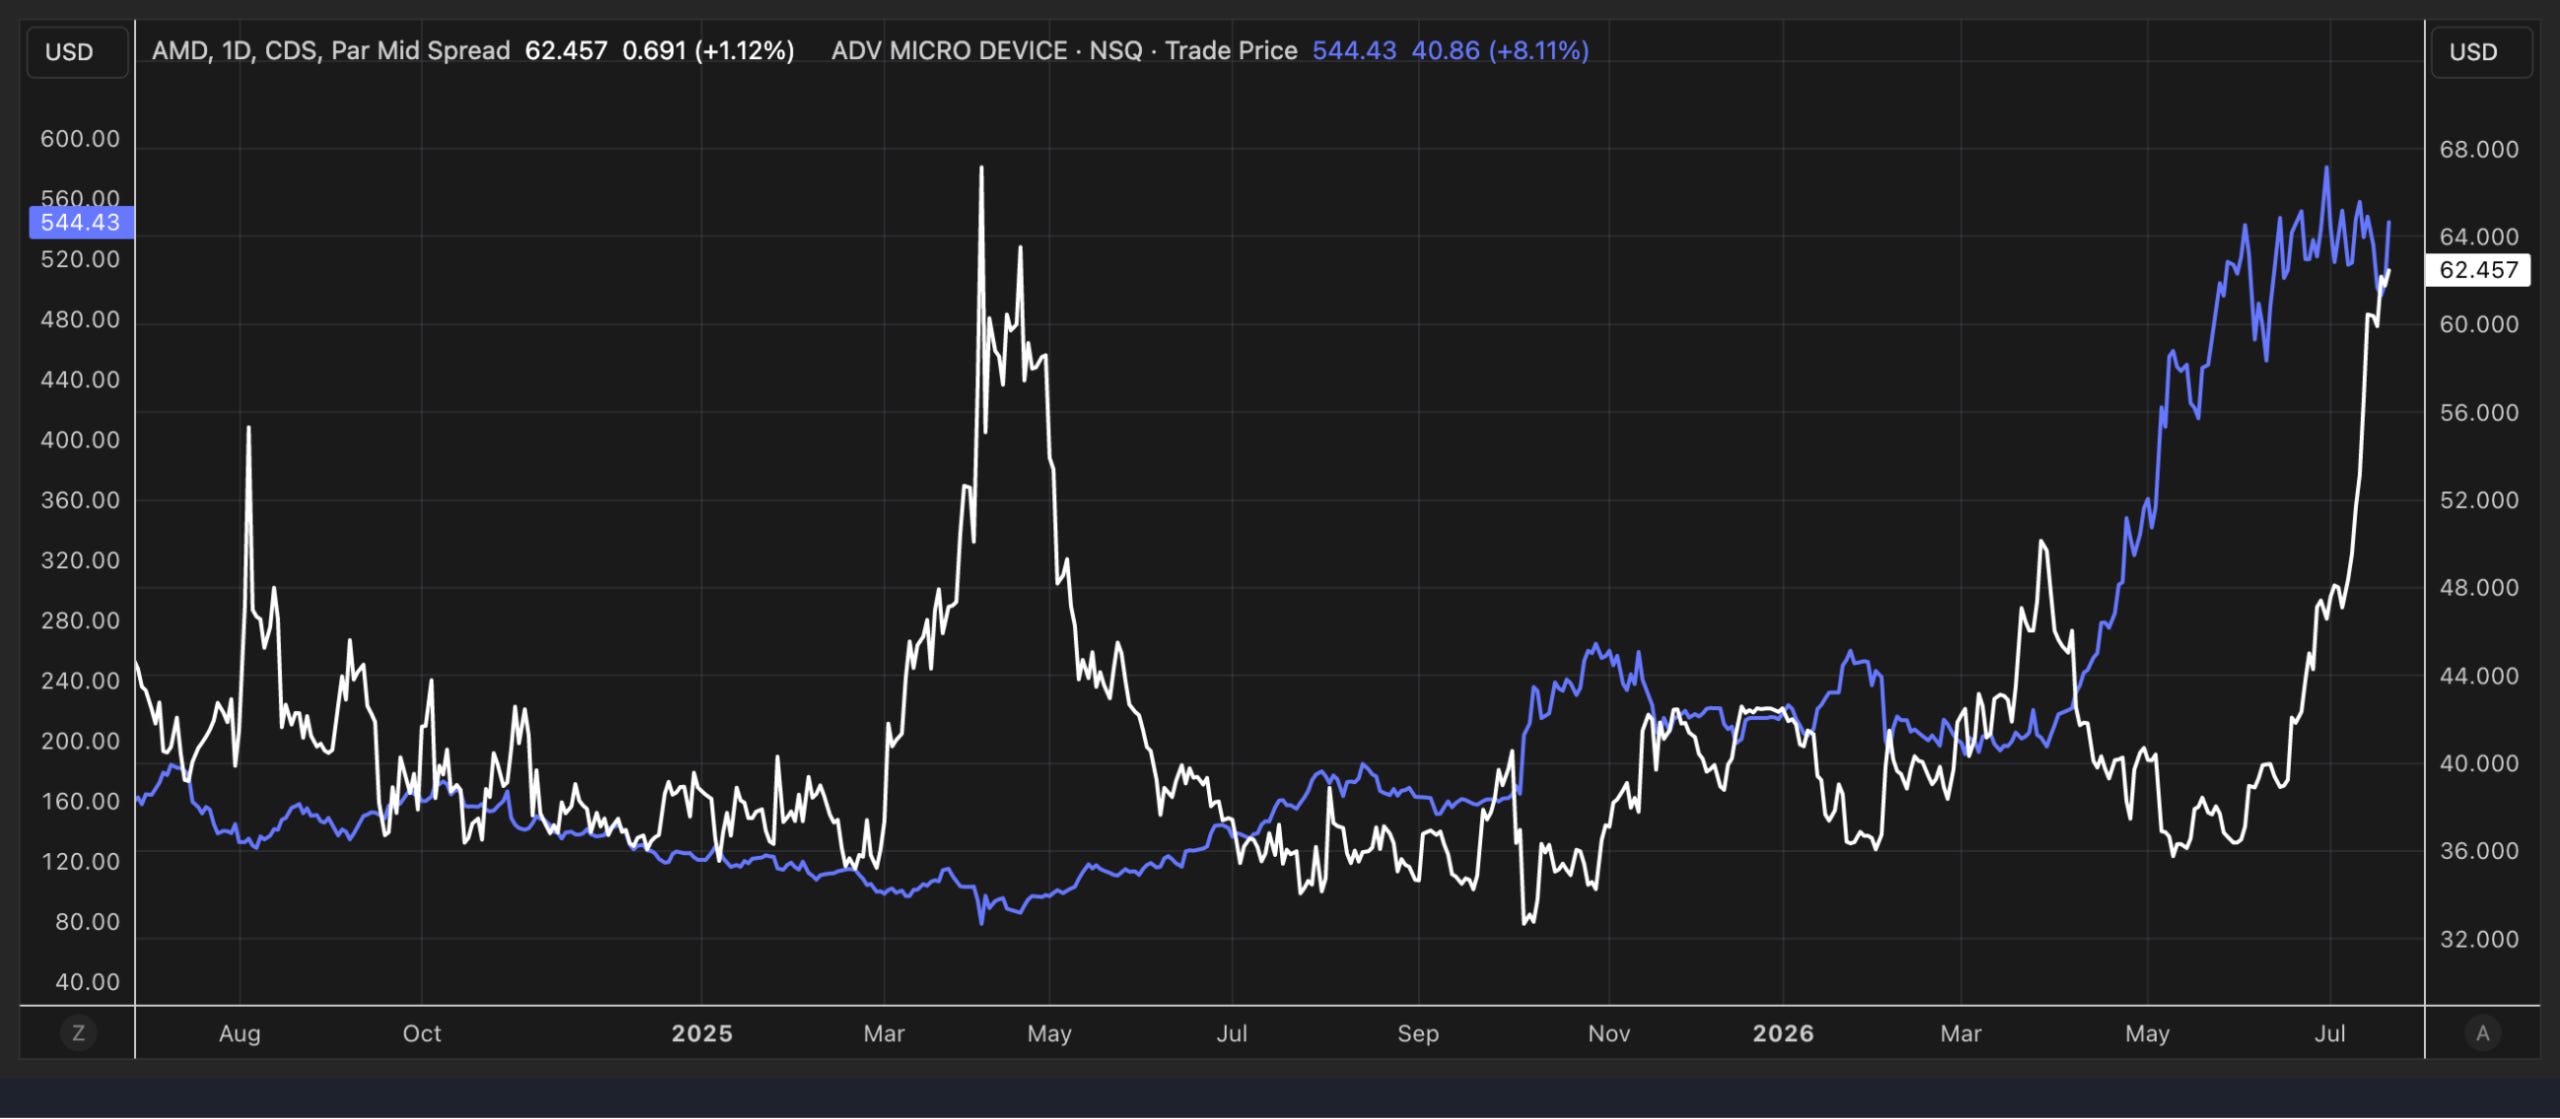
AMD’s CDS spread has widened modestly in recent weeks, even as the stock has continued to hold up well. Notably, the spread is now approaching levels seen during the tariff-driven sell-off, suggesting the credit market is becoming increasingly cautious despite resilience in the share price.
(LSEG)
What does the credit market know that the equity market doesn’t? It’s a fair question. Clearly, credit investors are seeing something that is leading to the persistent widening in CDS spreads, even as equity prices continue to climb. Whether that caution ultimately proves justified remains to be seen, but the growing divergence between the two markets is becoming increasingly difficult to ignore.
-Mike
Glossary by ChatGPT
Ask Spread — The premium quoted by sellers for credit protection in the CDS market.
Basis Points (bps) — A unit of measure equal to one one-hundredth of a percentage point (0.01%).
Bull Flag — A technical chart pattern that often signals the continuation of an existing upward trend.
CDS (Credit Default Swap) — A financial derivative used to insure against the default risk of a borrower.
Continuation Pattern — A technical formation suggesting the prevailing price trend is likely to resume after a pause.
Cumulative Default Probability — The estimated likelihood that a borrower will default over a specified period.
Dovish — A monetary policy stance favoring lower interest rates or easier financial conditions.
ECB (European Central Bank) — The central bank responsible for monetary policy in the euro area.
Resistance — A price or yield level where selling pressure has historically limited further advances.
Reversal Pattern — A technical chart formation indicating a potential change in the direction of the prevailing trend.
Tariff-Driven Sell-Off — A market decline primarily triggered by concerns over tariffs and their economic impact.
Treasury Yield — The return investors earn from holding a U.S. Treasury security to maturity.
Disclosure
This report contains independent commentary to be used for informational and educational purposes only. Michael Kramer is a member and investment adviser representative with Mott Capital Management. Mr. Kramer is not affiliated with this company and does not serve on the board of any related company that issued this stock. All opinions and analyses presented by Michael Kramer in this analysis or market report are solely Michael Kramer’s views. Readers should not treat any opinion, viewpoint, or prediction expressed by Michael Kramer as a specific solicitation or recommendation to buy or sell a particular security or follow a particular strategy. Michael Kramer’s analyses are based upon information and independent research that he considers reliable, but neither Michael Kramer nor Mott Capital Management guarantees its completeness or accuracy, and it should not be relied upon as such. Michael Kramer is not under any obligation to update or correct any information presented in his analyses. Mr. Kramer’s statements, guidance, and opinions are subject to change without notice. Past performance is not indicative of future results. Neither Michael Kramer nor Mott Capital Management guarantees any specific outcome or profit. You should be aware of the real risk of loss in following any strategy or investment commentary presented in this analysis. Strategies or investments discussed may fluctuate in price or value. Investments or strategies mentioned in this analysis may not be suitable for you. This material does not consider your particular investment objectives, financial situation, or needs and is not intended as a recommendation appropriate for you. You must make an independent decision regarding investments or strategies in this analysis. Upon request, the advisor will provide a list of all recommendations made during the past twelve months. Before acting on information in this analysis, you should consider whether it is suitable for your circumstances and strongly consider seeking advice from your own financial or investment adviser to determine the suitability of any investment.